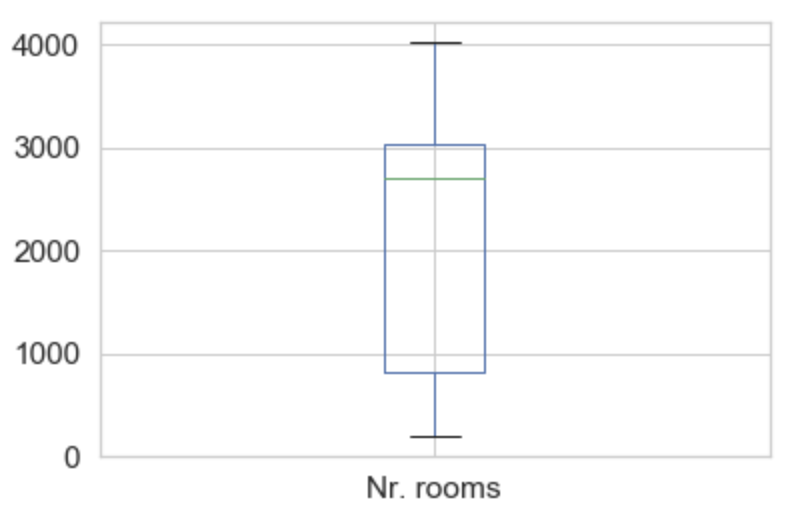
Einführung in kategoriale Plots mit Seaborn

Arbeiten mit kategorialen Daten in Python

Kasey Jones

Research Data Scientist

Unser drittes Dataset

  • Name: Las Vegas TripAdvisor Reviews - reviews
  • Zeilen: 504
  • Spalten: 20
Arbeiten mit kategorialen Daten in Python

Las-Vegas-Bewertungen

reviews.info()
RangeIndex: 504 entries, 0 to 503
Data columns (total 20 columns):
 #   Column             Non-Null Count  Dtype 
     ------             --------------  ----- 
 0   User country       504 non-null    object
...
 6   Traveler type      504 non-null    object
 7   Pool               504 non-null    object
 8   Gym                504 non-null    object
 9   Tennis court       504 non-null    object
...
dtypes: int64(7), object(13)
memory usage: 78.9+ KB
1 https://www.kaggle.com/crawford/las-vegas-tripadvisor-reviews
Arbeiten mit kategorialen Daten in Python

Seaborn

Kategoriale Plots:

import seaborn as sns
import matplotlib.pyplot as plt

sns.catplot(...)
plt.show()
Arbeiten mit kategorialen Daten in Python

Die Funktion catplot

Parameter:

  • x: Name der Variable in data
  • y: Name der Variable in data
  • data: ein DataFrame
  • kind: Plot-Typ – einer von: "strip", "swarm", "box", "violin", "boxen", "point", "bar" oder "count"
Arbeiten mit kategorialen Daten in Python

Boxplot

Arbeiten mit kategorialen Daten in Python

Bewertungsscore

reviews["Score"].value_counts()
5    227
4    164
3     72
2     30
1     11
Arbeiten mit kategorialen Daten in Python

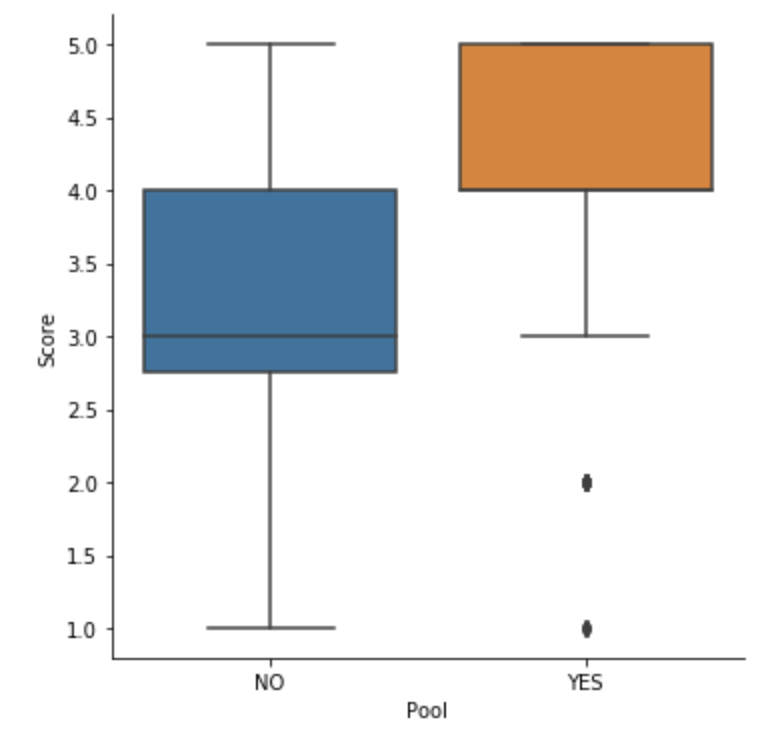
Boxplot-Beispiel

sns.catplot(
  x="Pool",
  y="Score",
  data=reviews,
  kind="box"
)
plt.show()

Arbeiten mit kategorialen Daten in Python

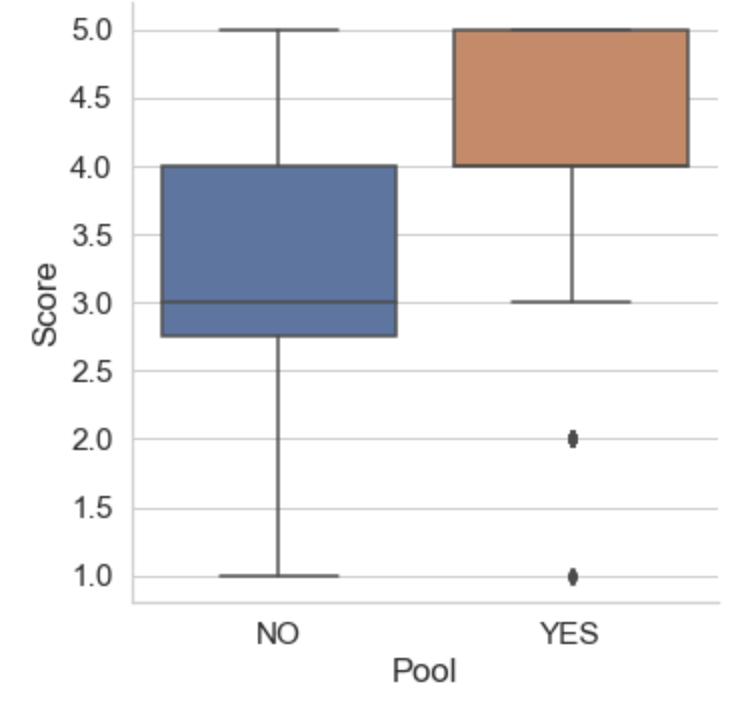
Zwei schnelle Optionen

# Schriftgröße und Hintergrund setzen
sns.set(font_scale=1.4)

sns.set_style("whitegrid")
sns.catplot(
  x="Pool",
  y="Score",
  data=reviews,
  kind="box"
)
plt.show()

Arbeiten mit kategorialen Daten in Python

Boxplot-Übung

Arbeiten mit kategorialen Daten in Python

Preparing Video For Download...