KPI charts
Visualizations in Sigma

Mandy Gray
Solutions and Enablement Lead at Aimpoint Digital
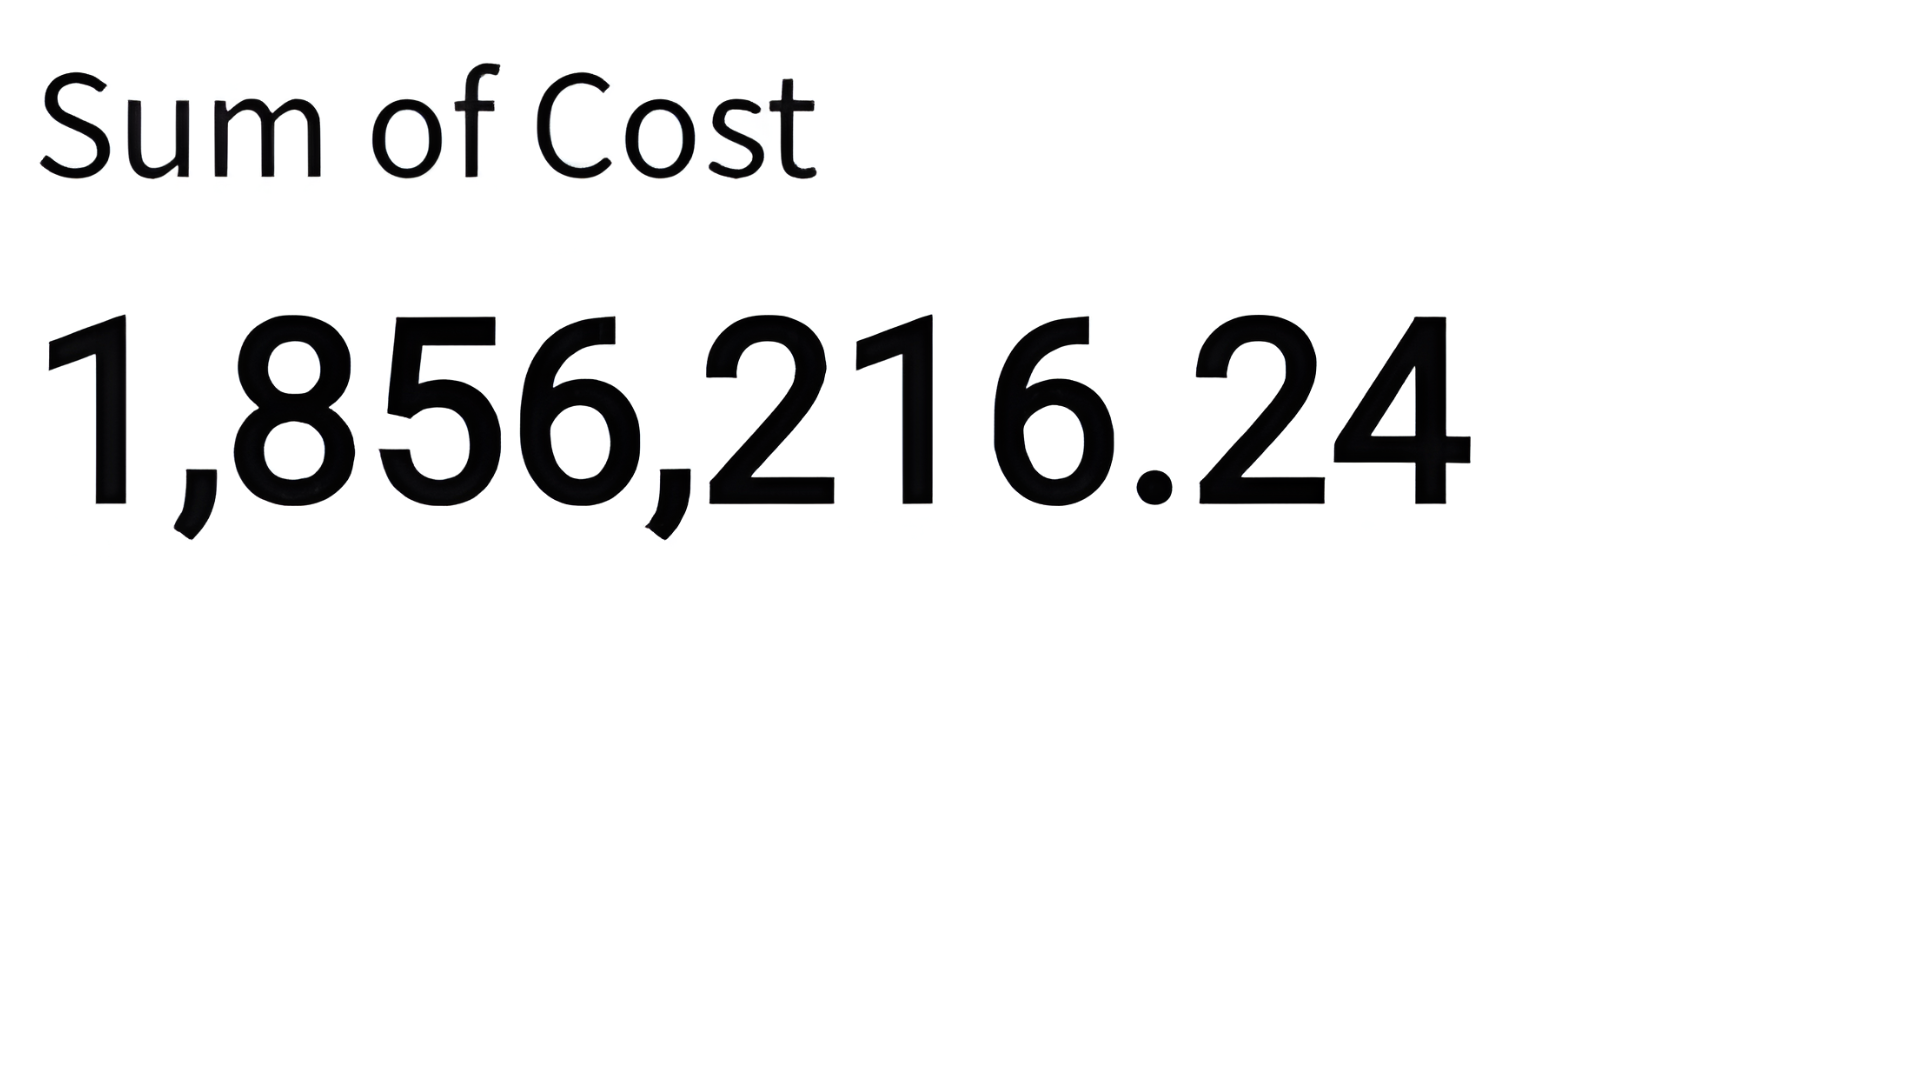
KPI (Key Performance Indicator) charts
$$ $$
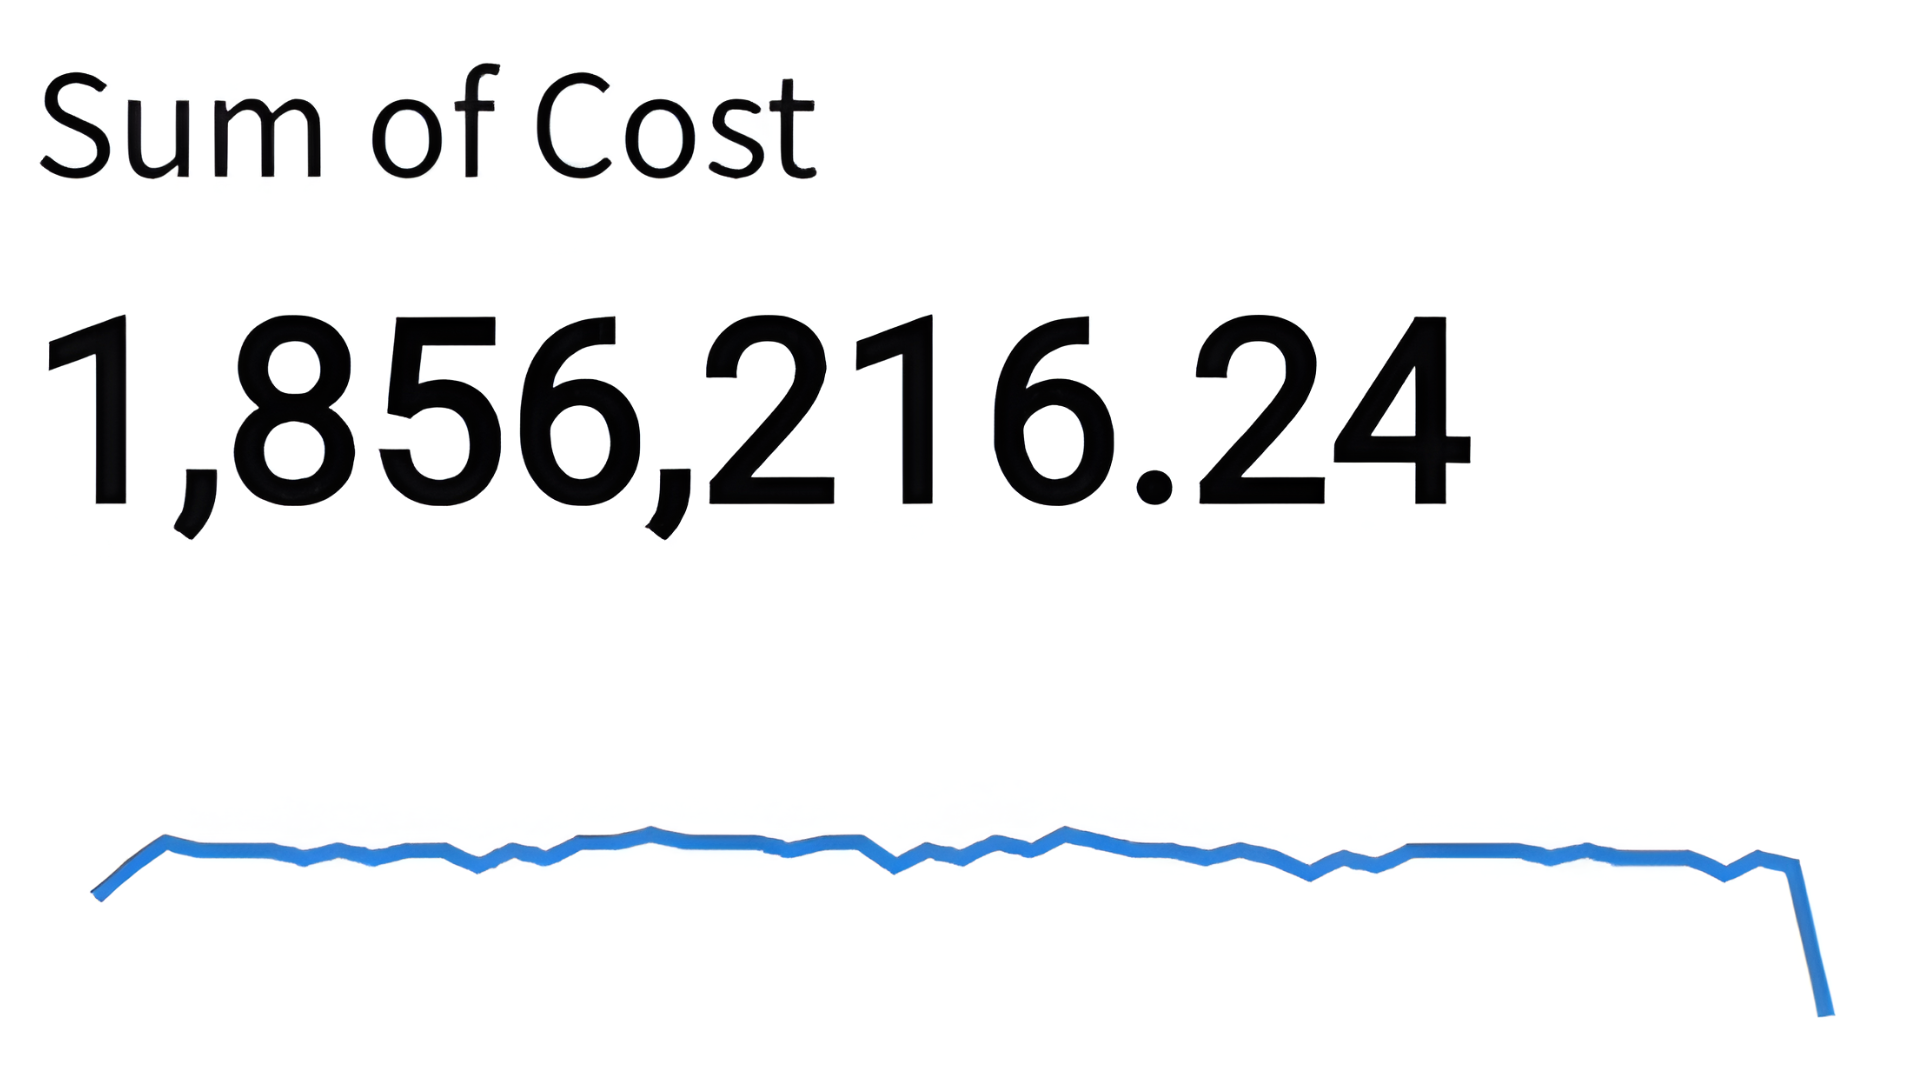
KPI (Key Performance Indicator) charts
$$ $$
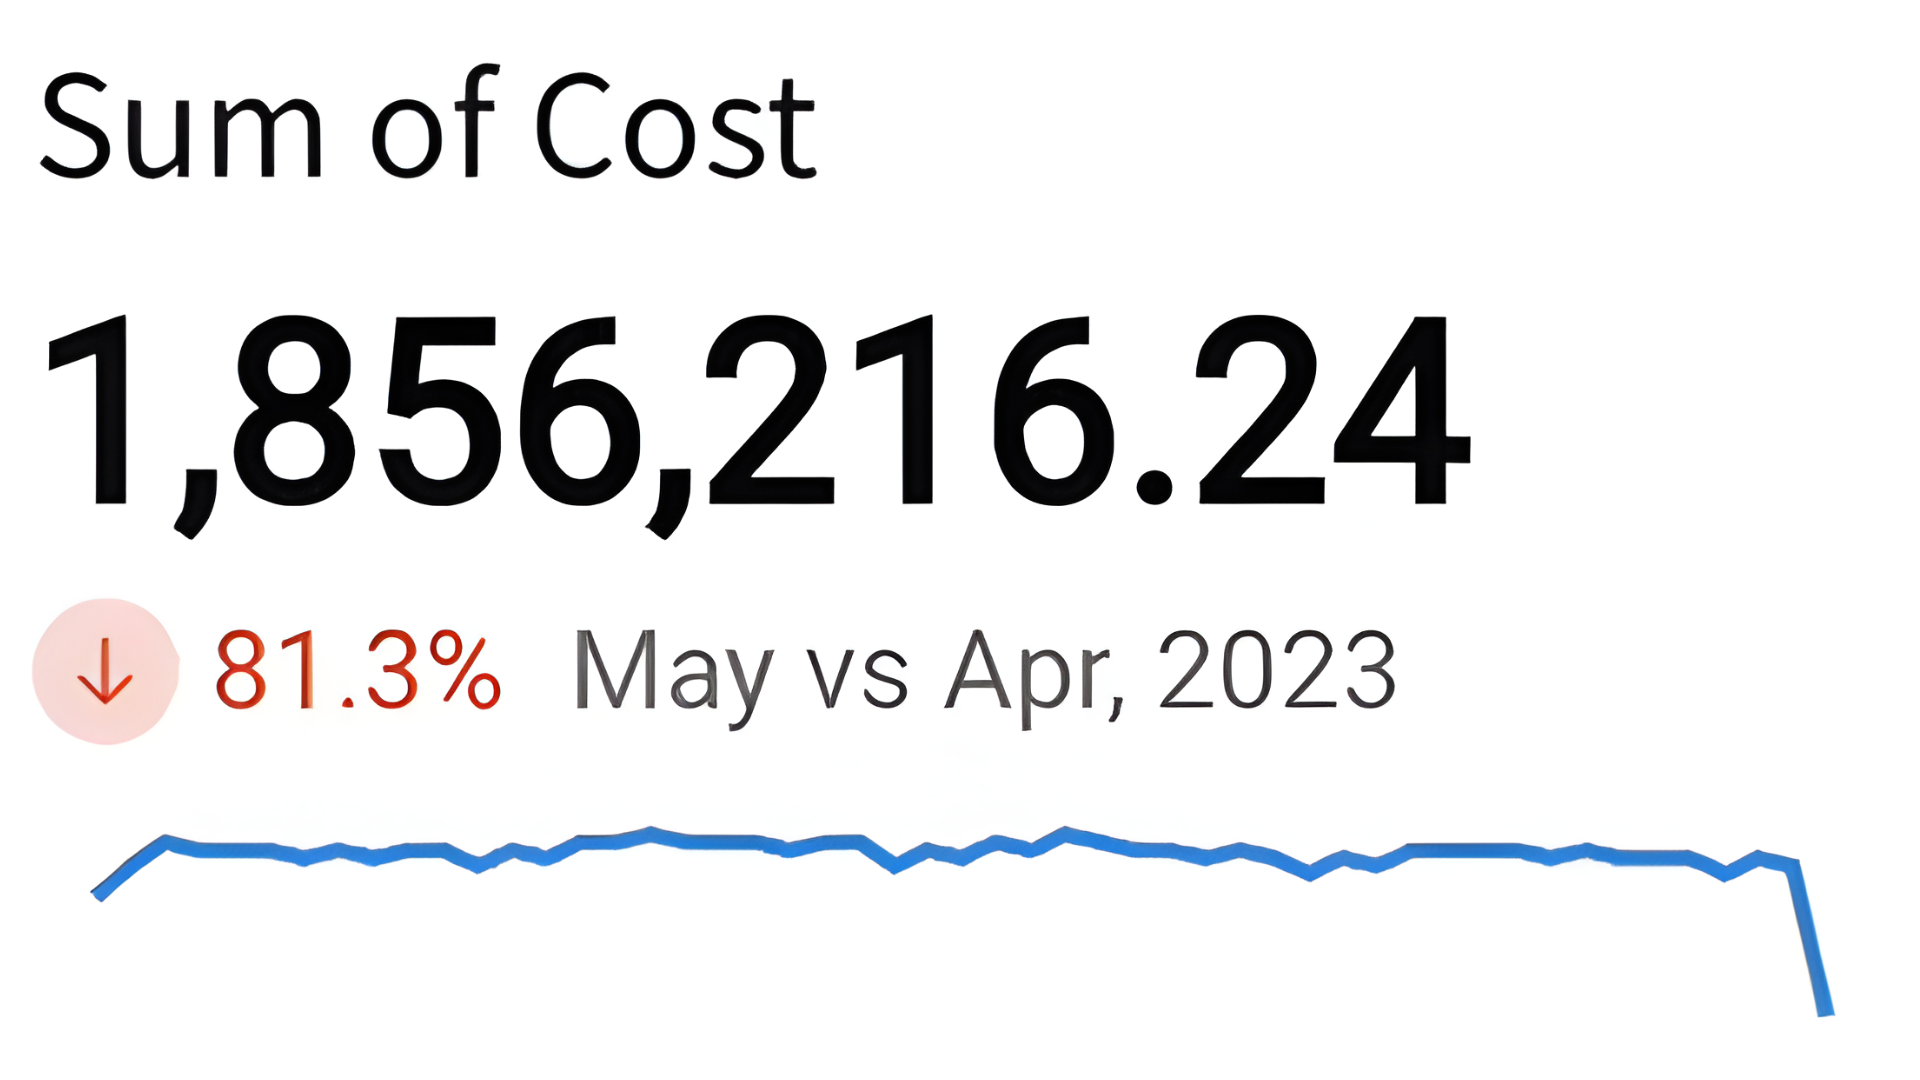
KPI (Key Performance Indicator) charts
$$ $$
Visualizations in Sigma
Mandy Gray
Solutions and Enablement Lead at Aimpoint Digital
$$ $$
$$ $$
$$ $$

