Pie and donut charts
Visualizations in Sigma
Mandy Gray
Solutions and Enablement Lead at Aimpoint Digital
Pie and donut charts
Pie and donut charts
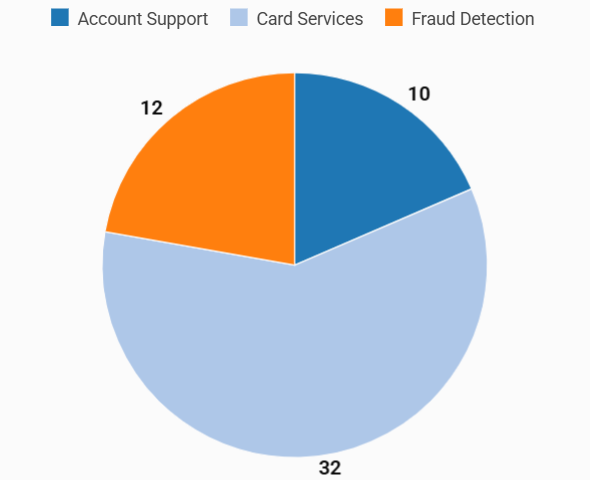
Pie charts best with 2 to 6 sections
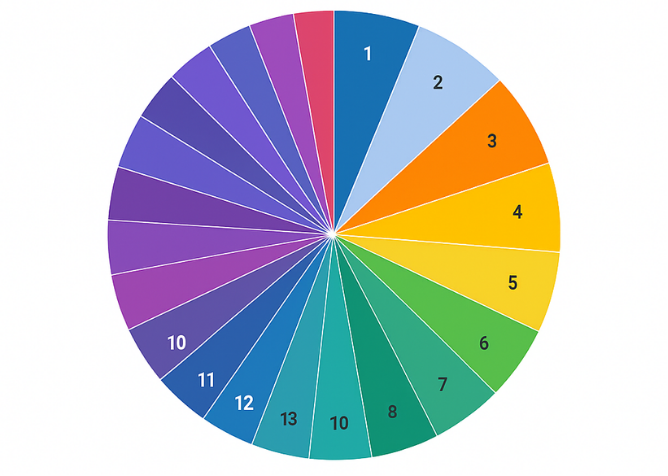
More than 6 sections can be messy
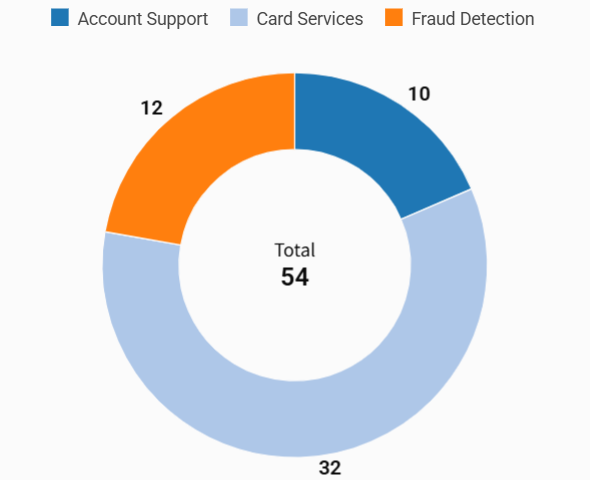
Donut charts have a hollow center
Sigma allows numbers in the donut center
DEMO
DEMO
DEMO
DEMO
DEMO
DEMO
DEMO
DEMO
Let's practice!
Visualizations in Sigma
Preparing Video For Download...