Calculating correlation coefficients

Introducción a Python en Power BI

Jacob H. Marquez

Data Scientist

What is a correlation coefficient?

Definition: a numerical measure of some type of statistical relationship between two variables

Range: -1 to 1

Range

-1:

  • strong, negative relationship
  • increase in variable A is associated with a decrease in variable B

1:

  • strong, positive relationship
  • increase in variable A is associated with an increase in variable B

0: no relationship

Introducción a Python en Power BI

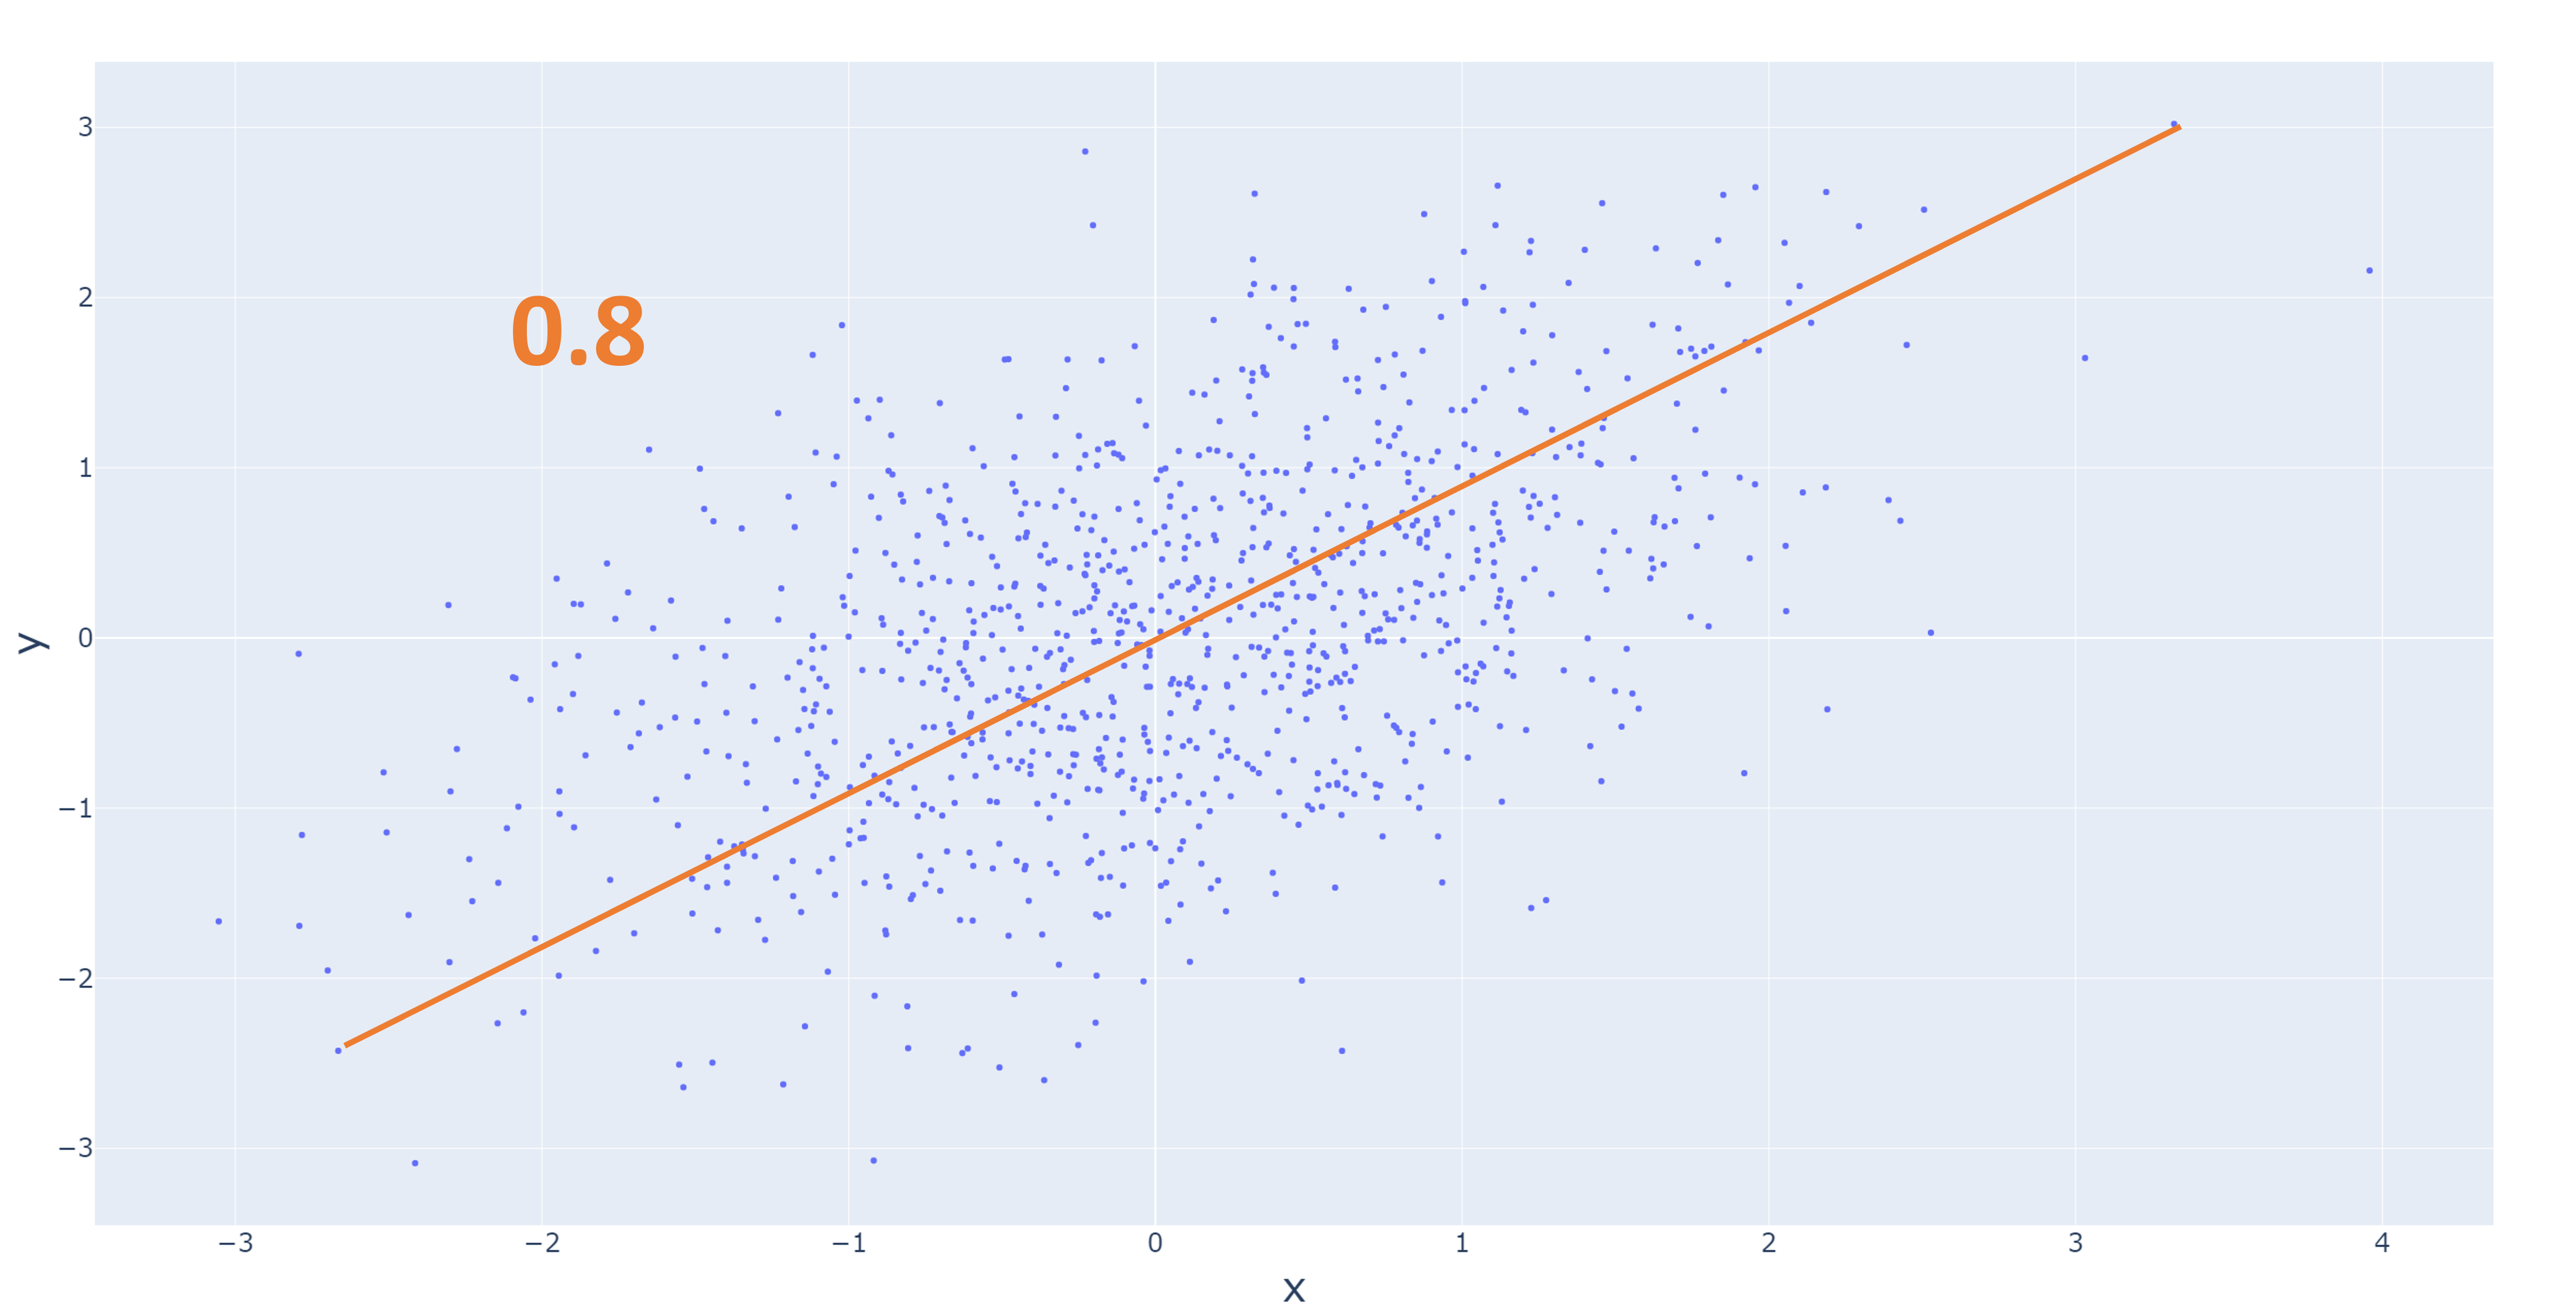
Correlation coefficient example #1

Scatter plot showing two variables with a correlation of 0.8.

Introducción a Python en Power BI

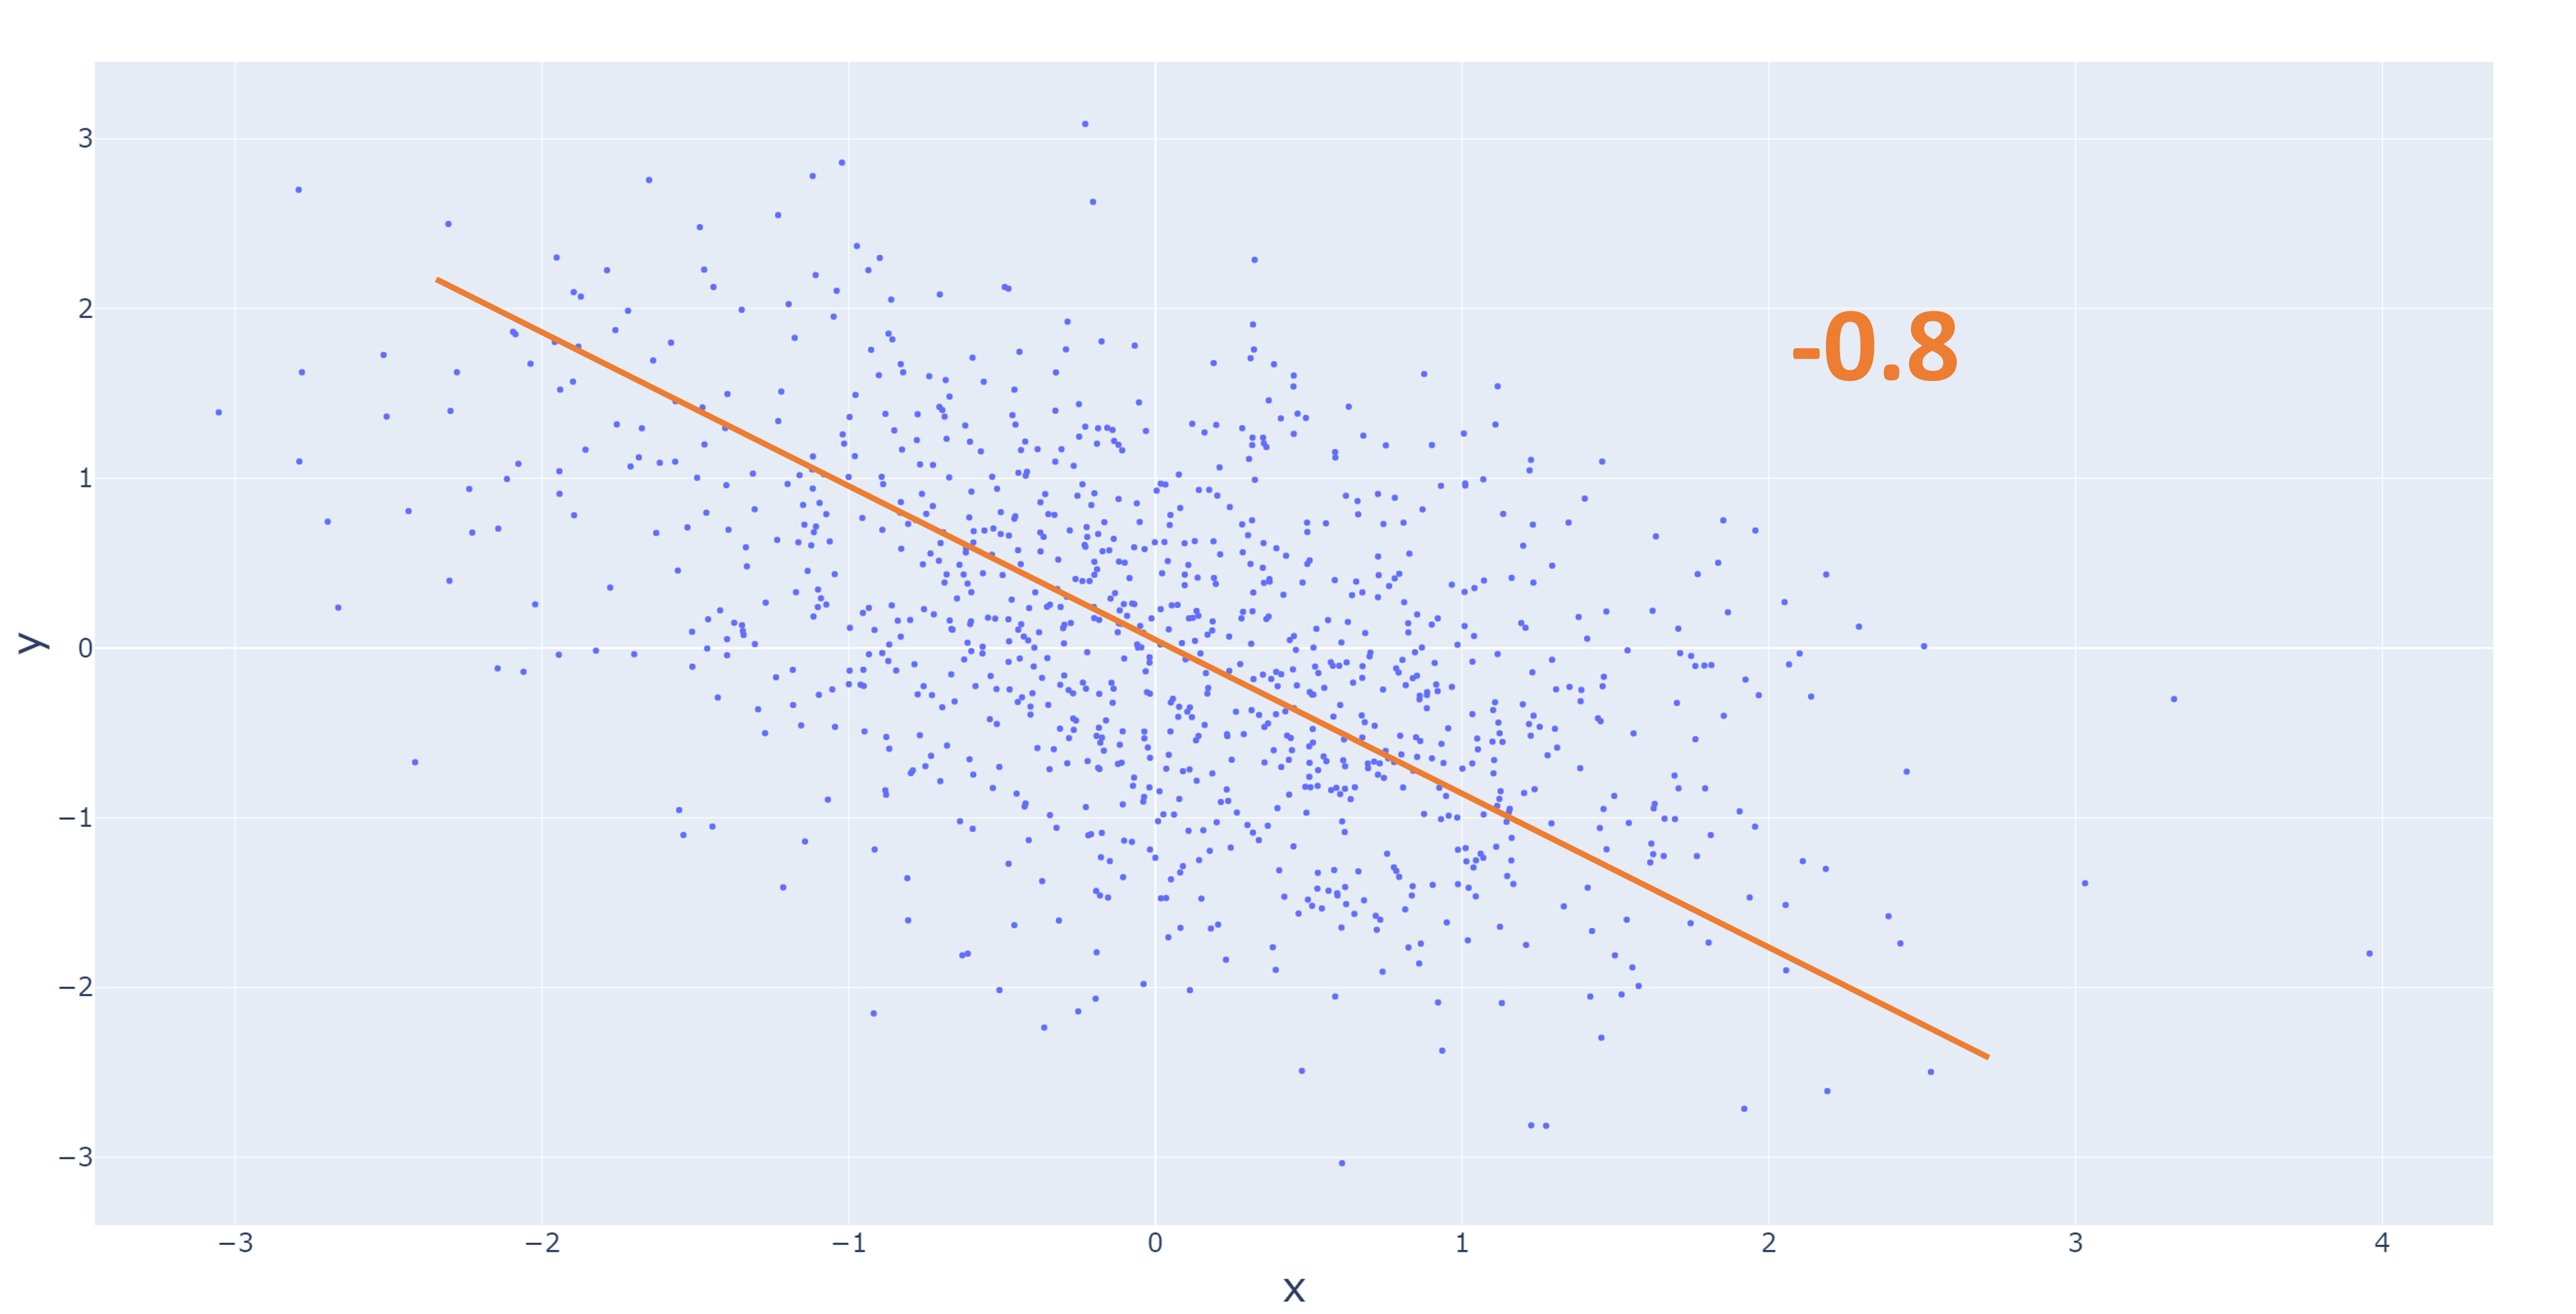
Correlation coefficient example #2

Scatter plot showing two variables with a correlation of -0.8.

Introducción a Python en Power BI

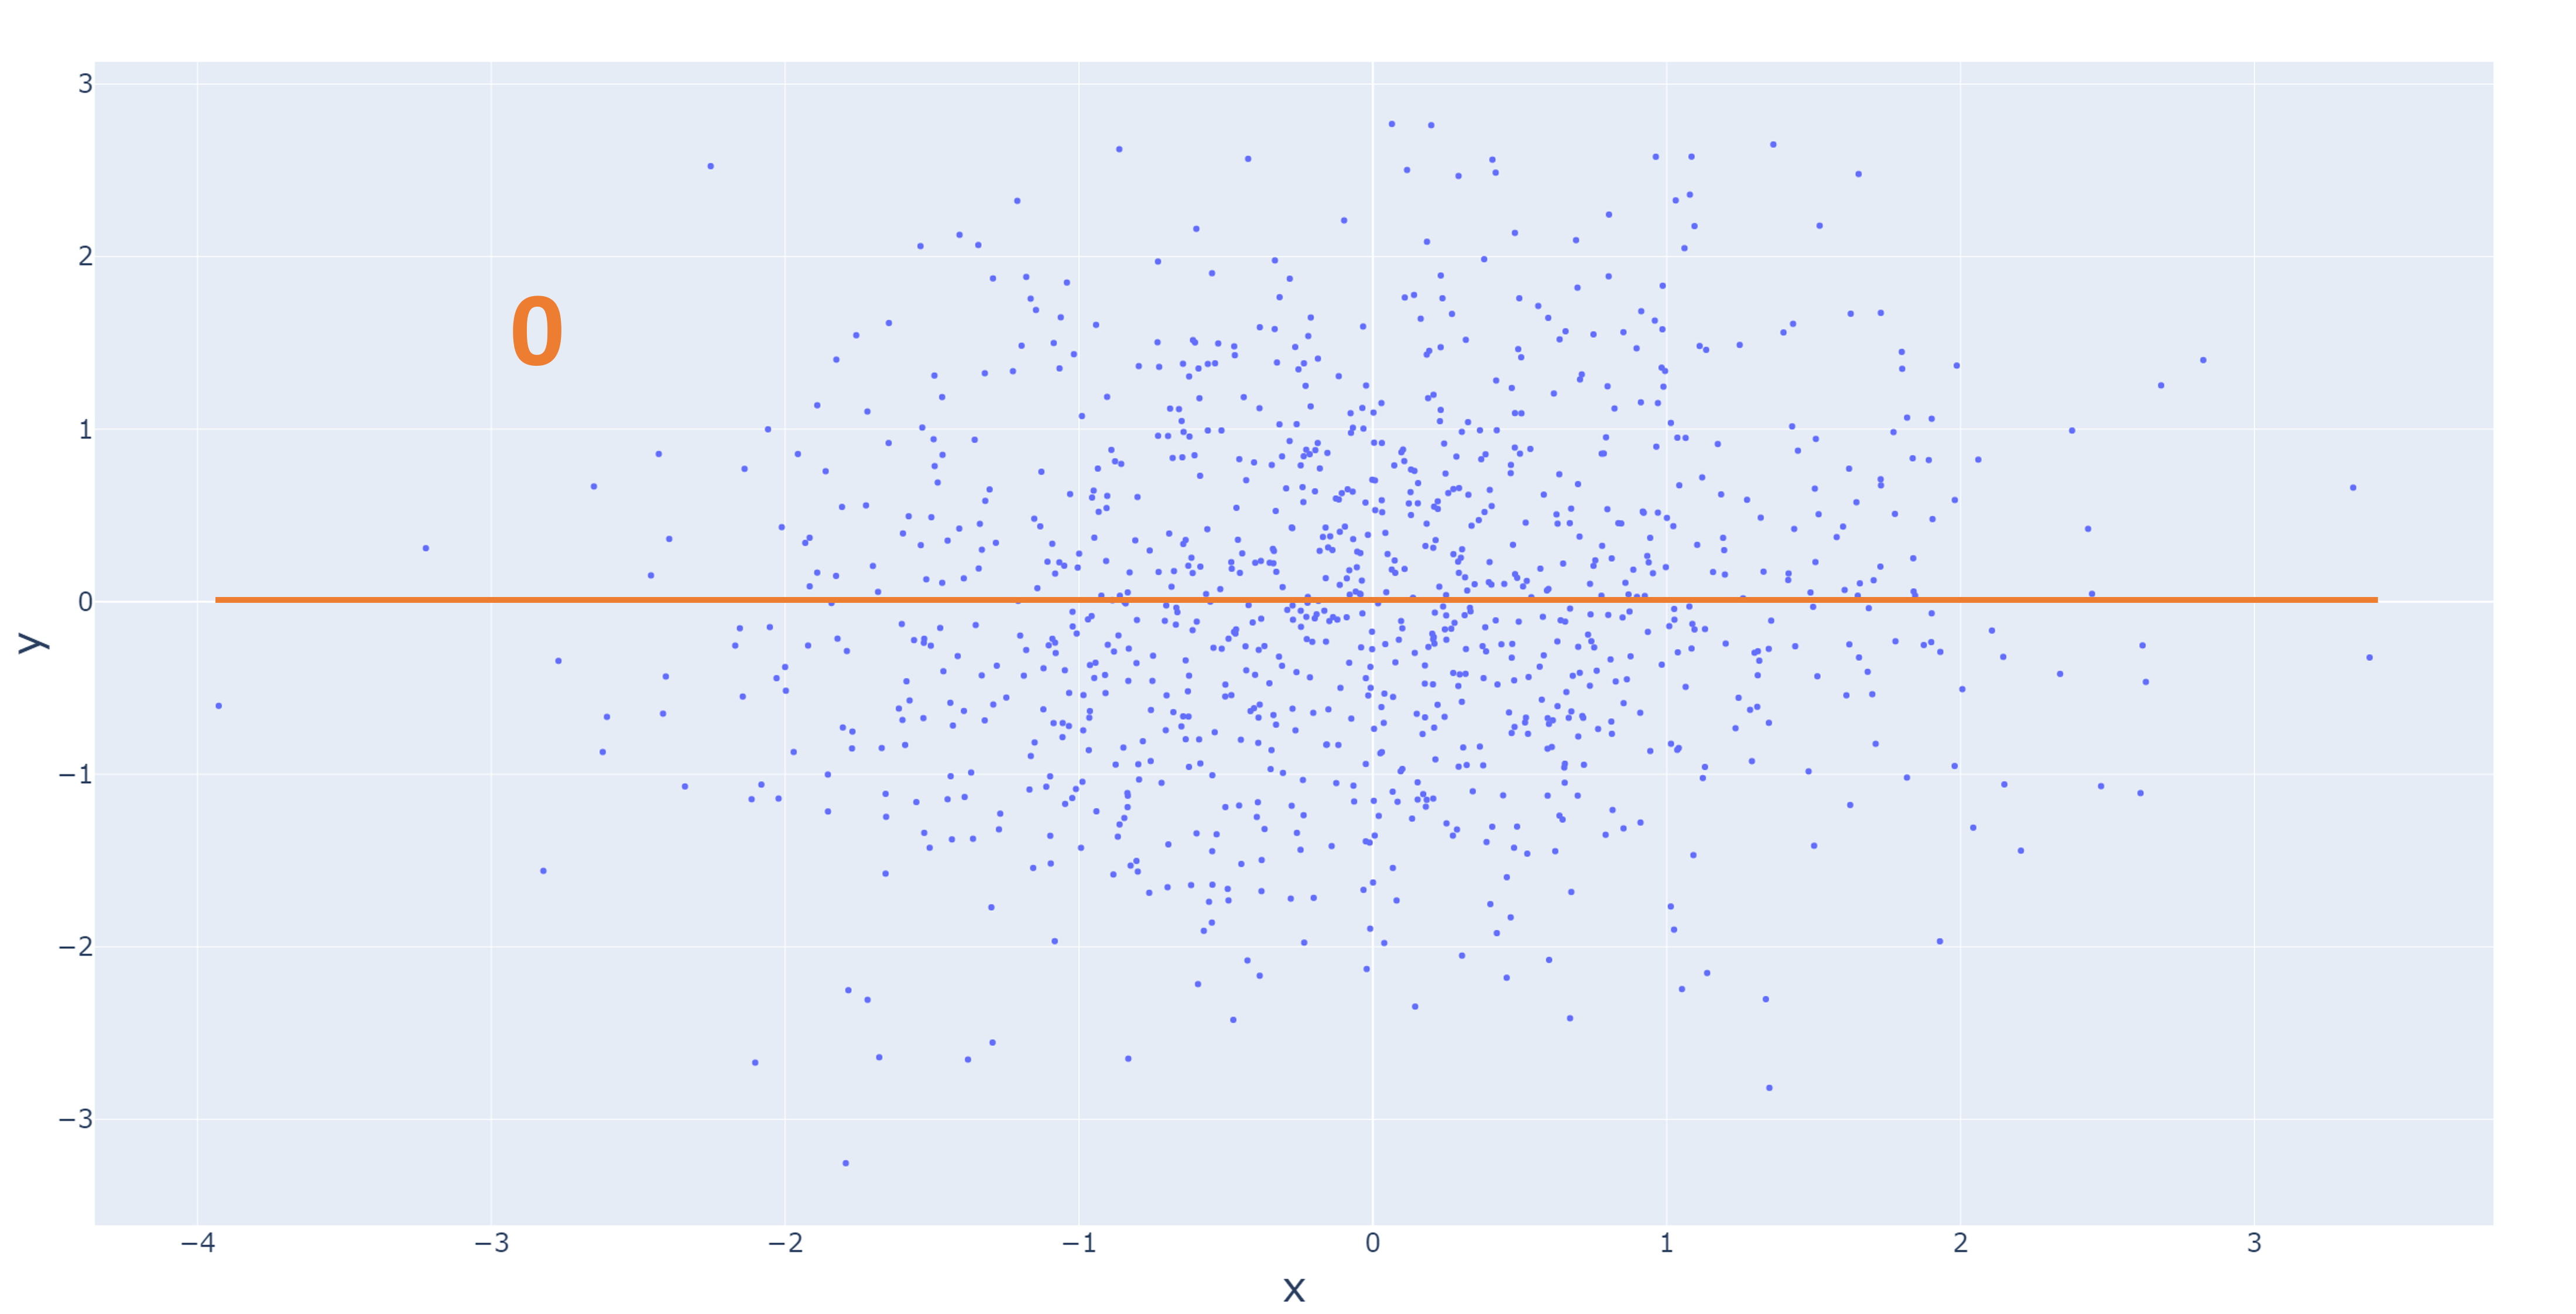
Correlation coefficient example #3

Scatter plot showing two variables with a correlation of 0.

Introducción a Python en Power BI

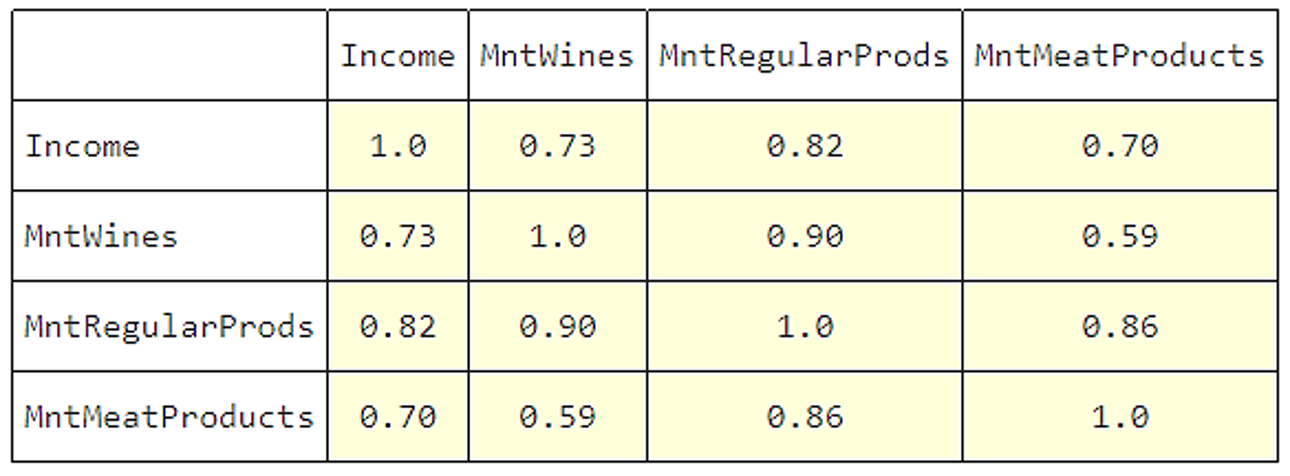
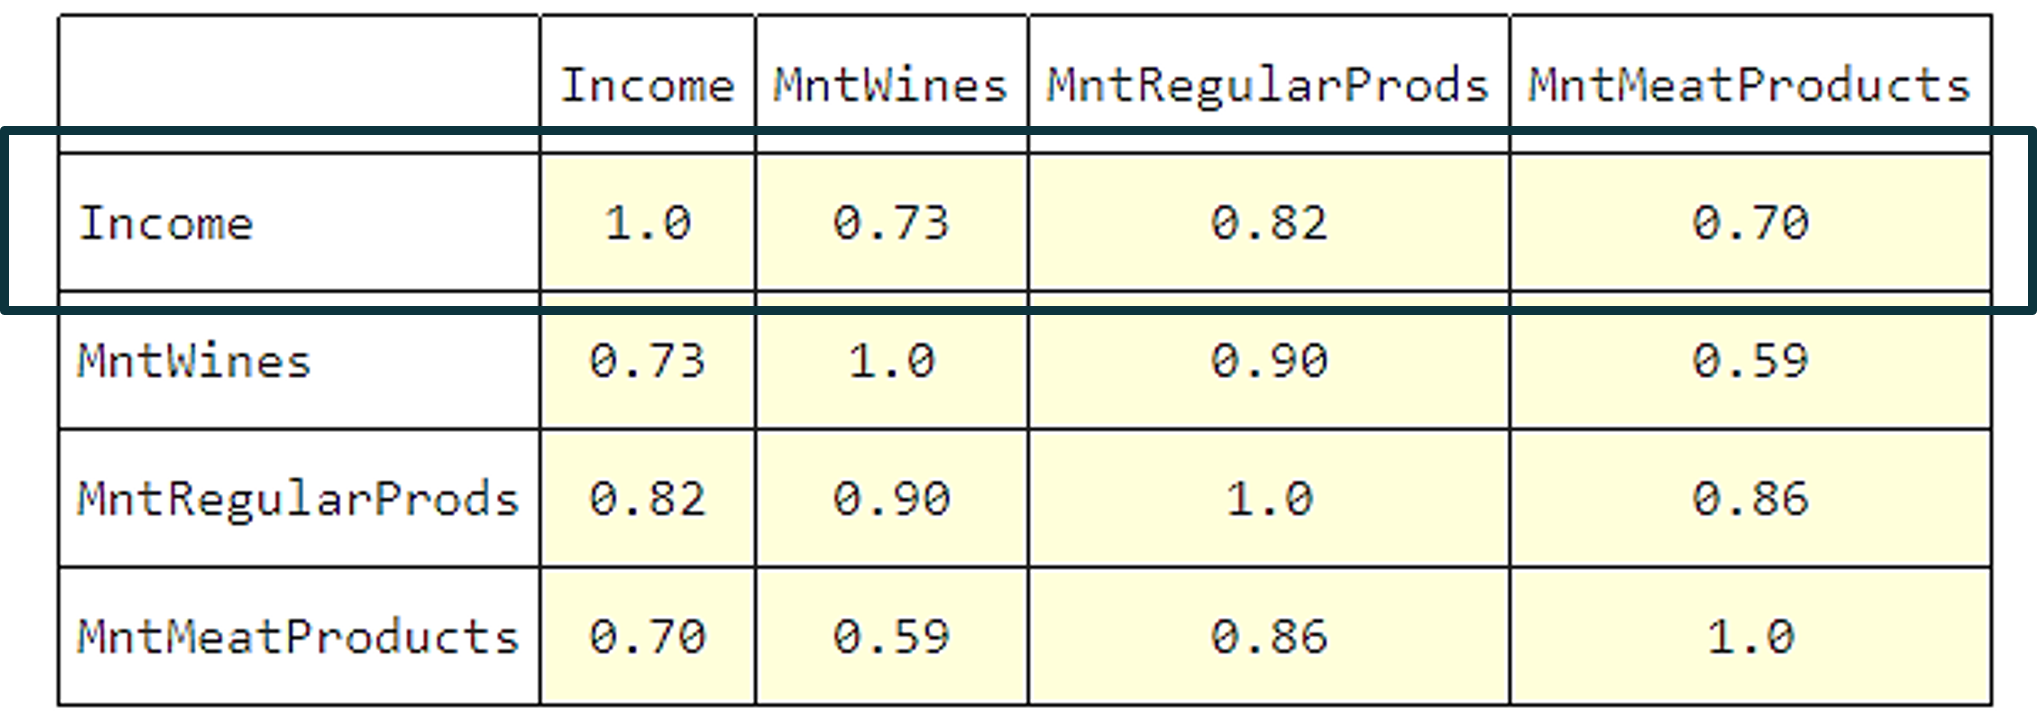
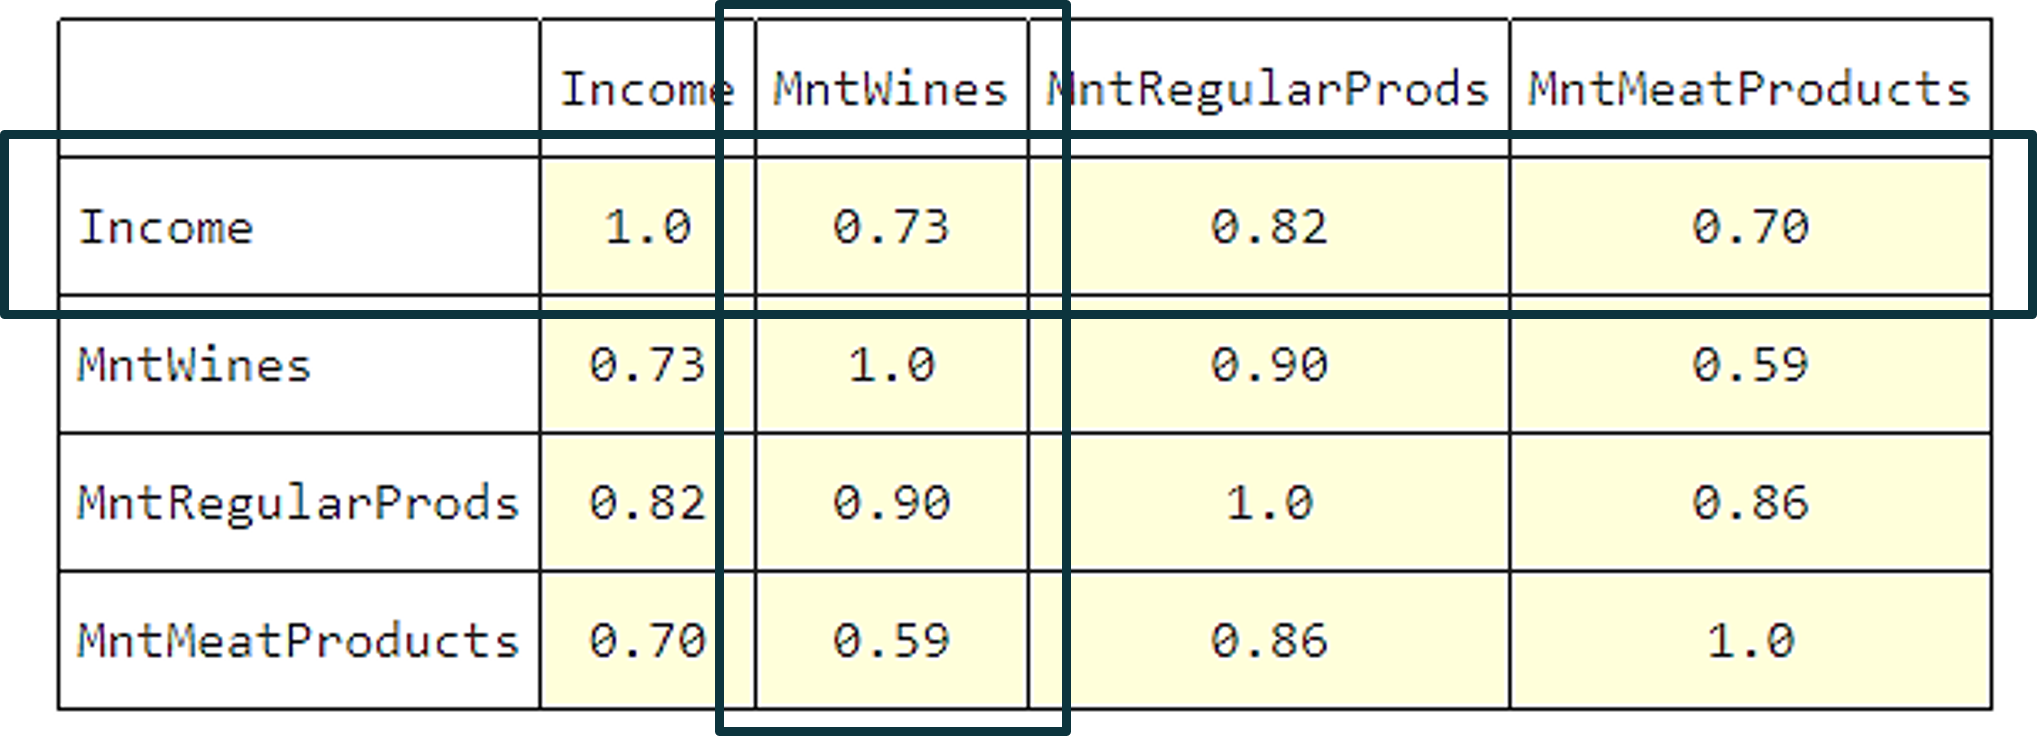
Correlation matrix

A table with the variables of a dataset as rows and columns. The cells are the correlation coefficients between the two variables.

Introducción a Python en Power BI

Correlation matrix

A table with the variables of a dataset as rows and columns. The cells are the correlation coefficients between the two variables. The row for Income is highlighted.

Introducción a Python en Power BI

Correlation matrix

A table with the variables of a dataset as rows and columns. The cells are the correlation coefficients between the two variables. The correlation for Income vs. MntWines is highlighted.

Introducción a Python en Power BI

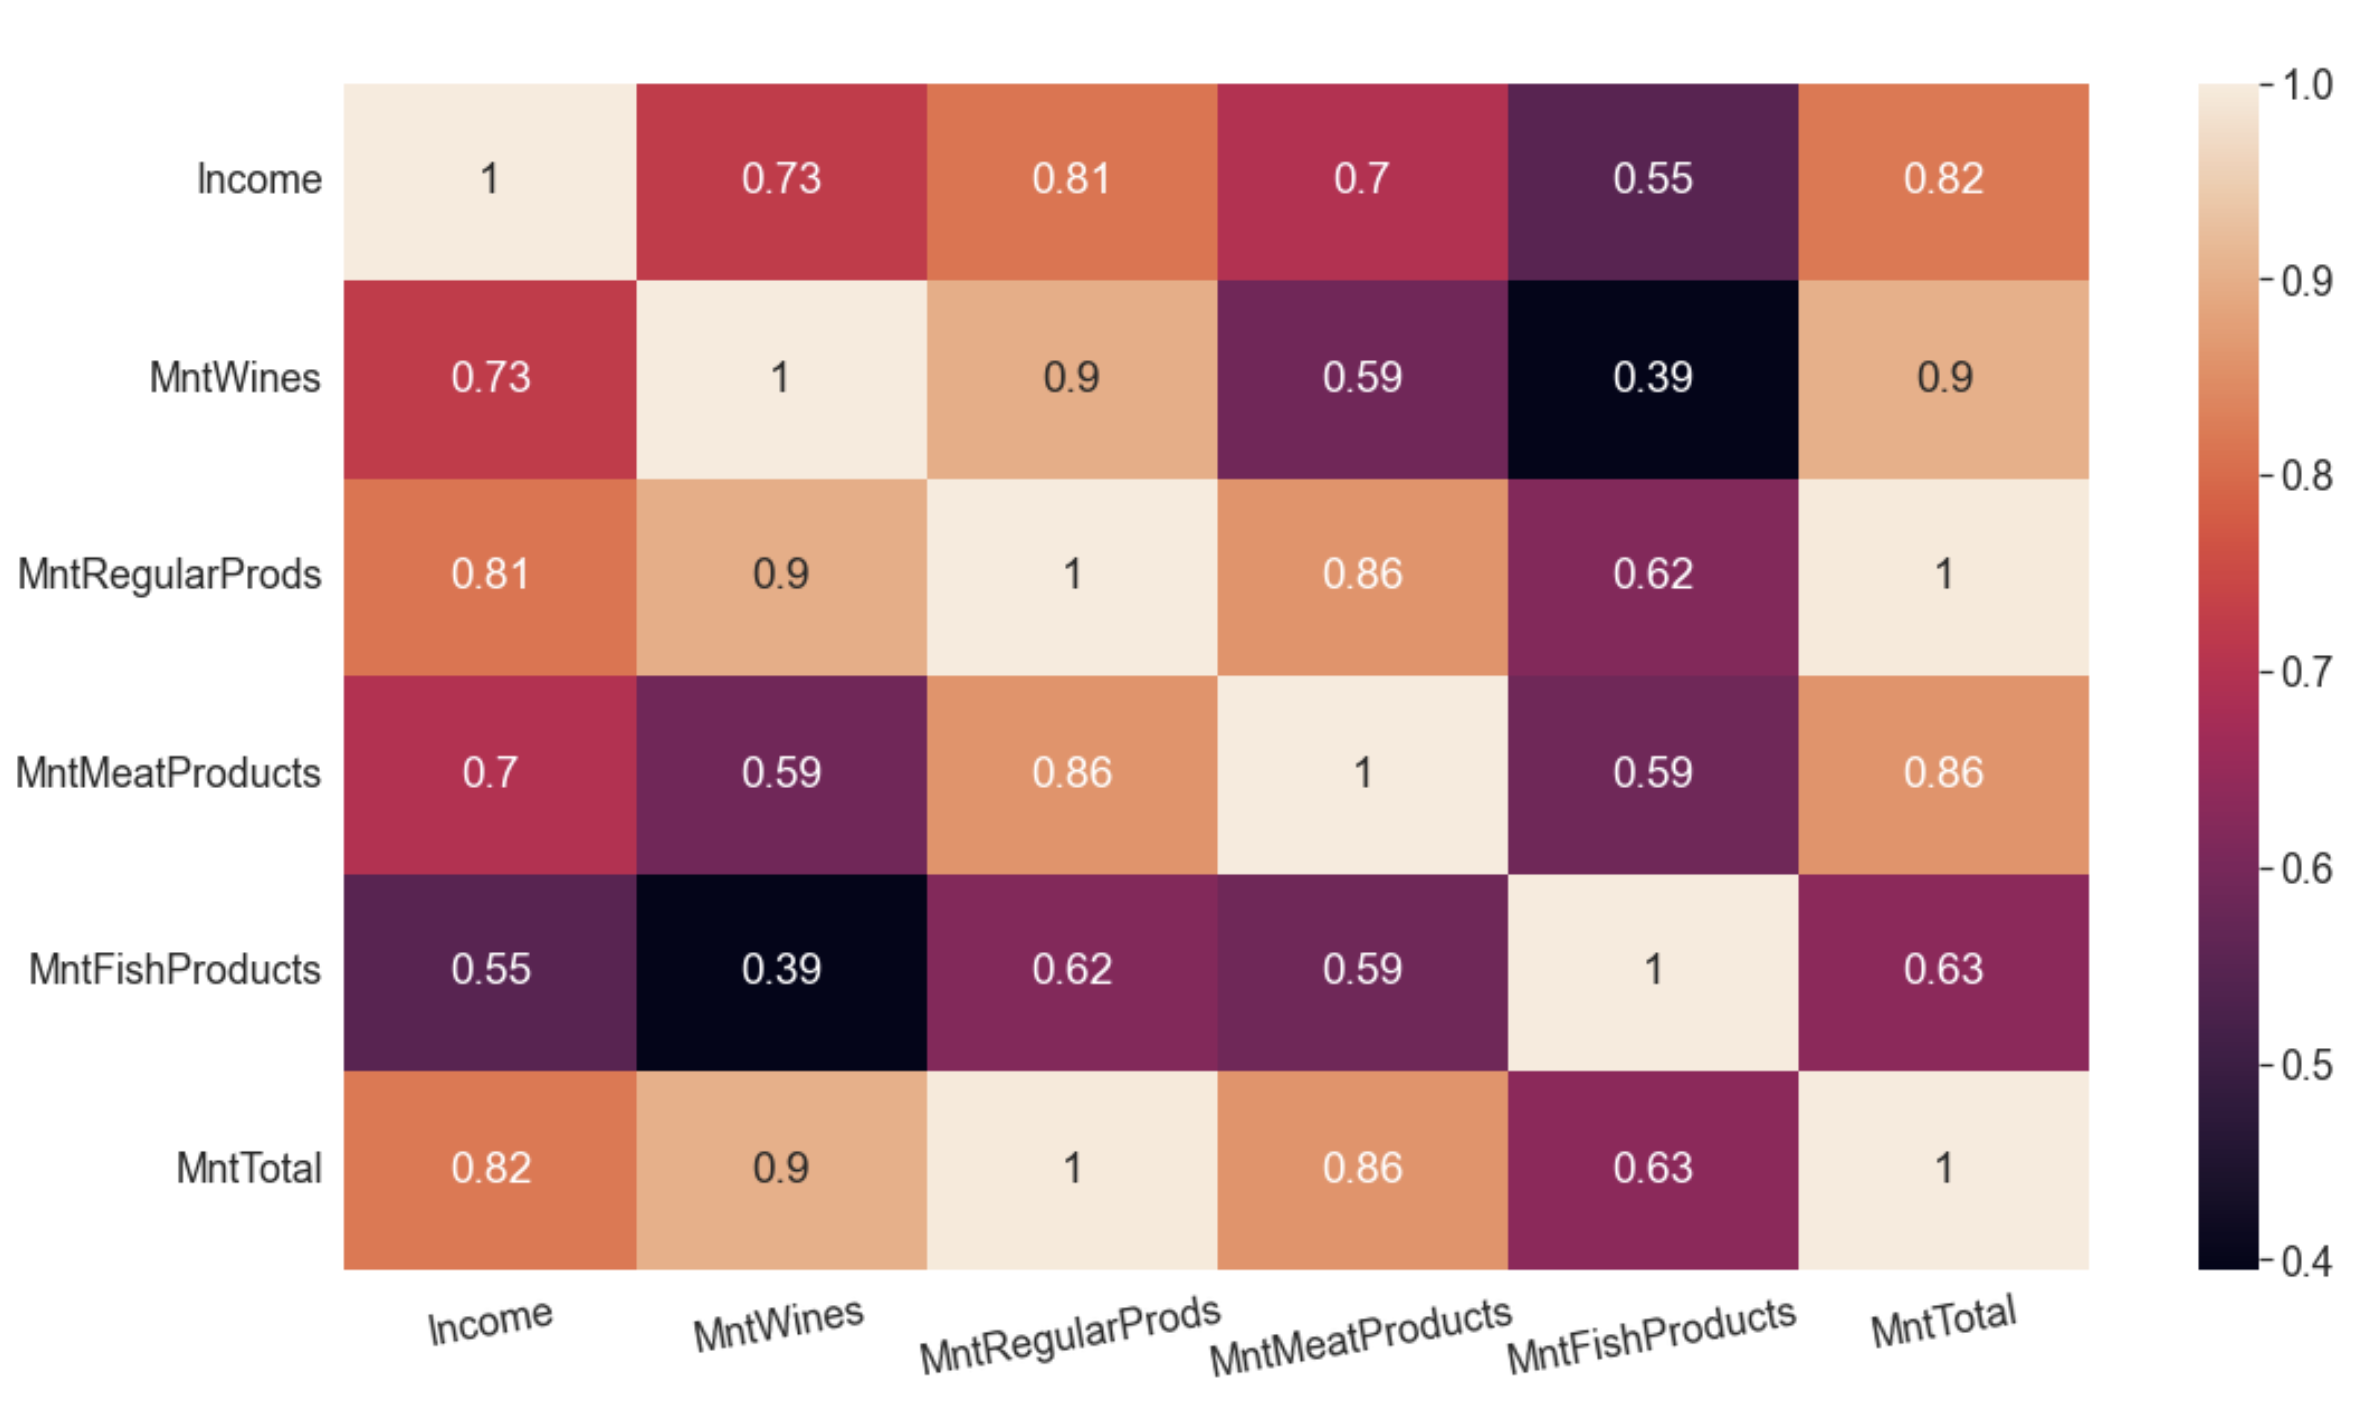
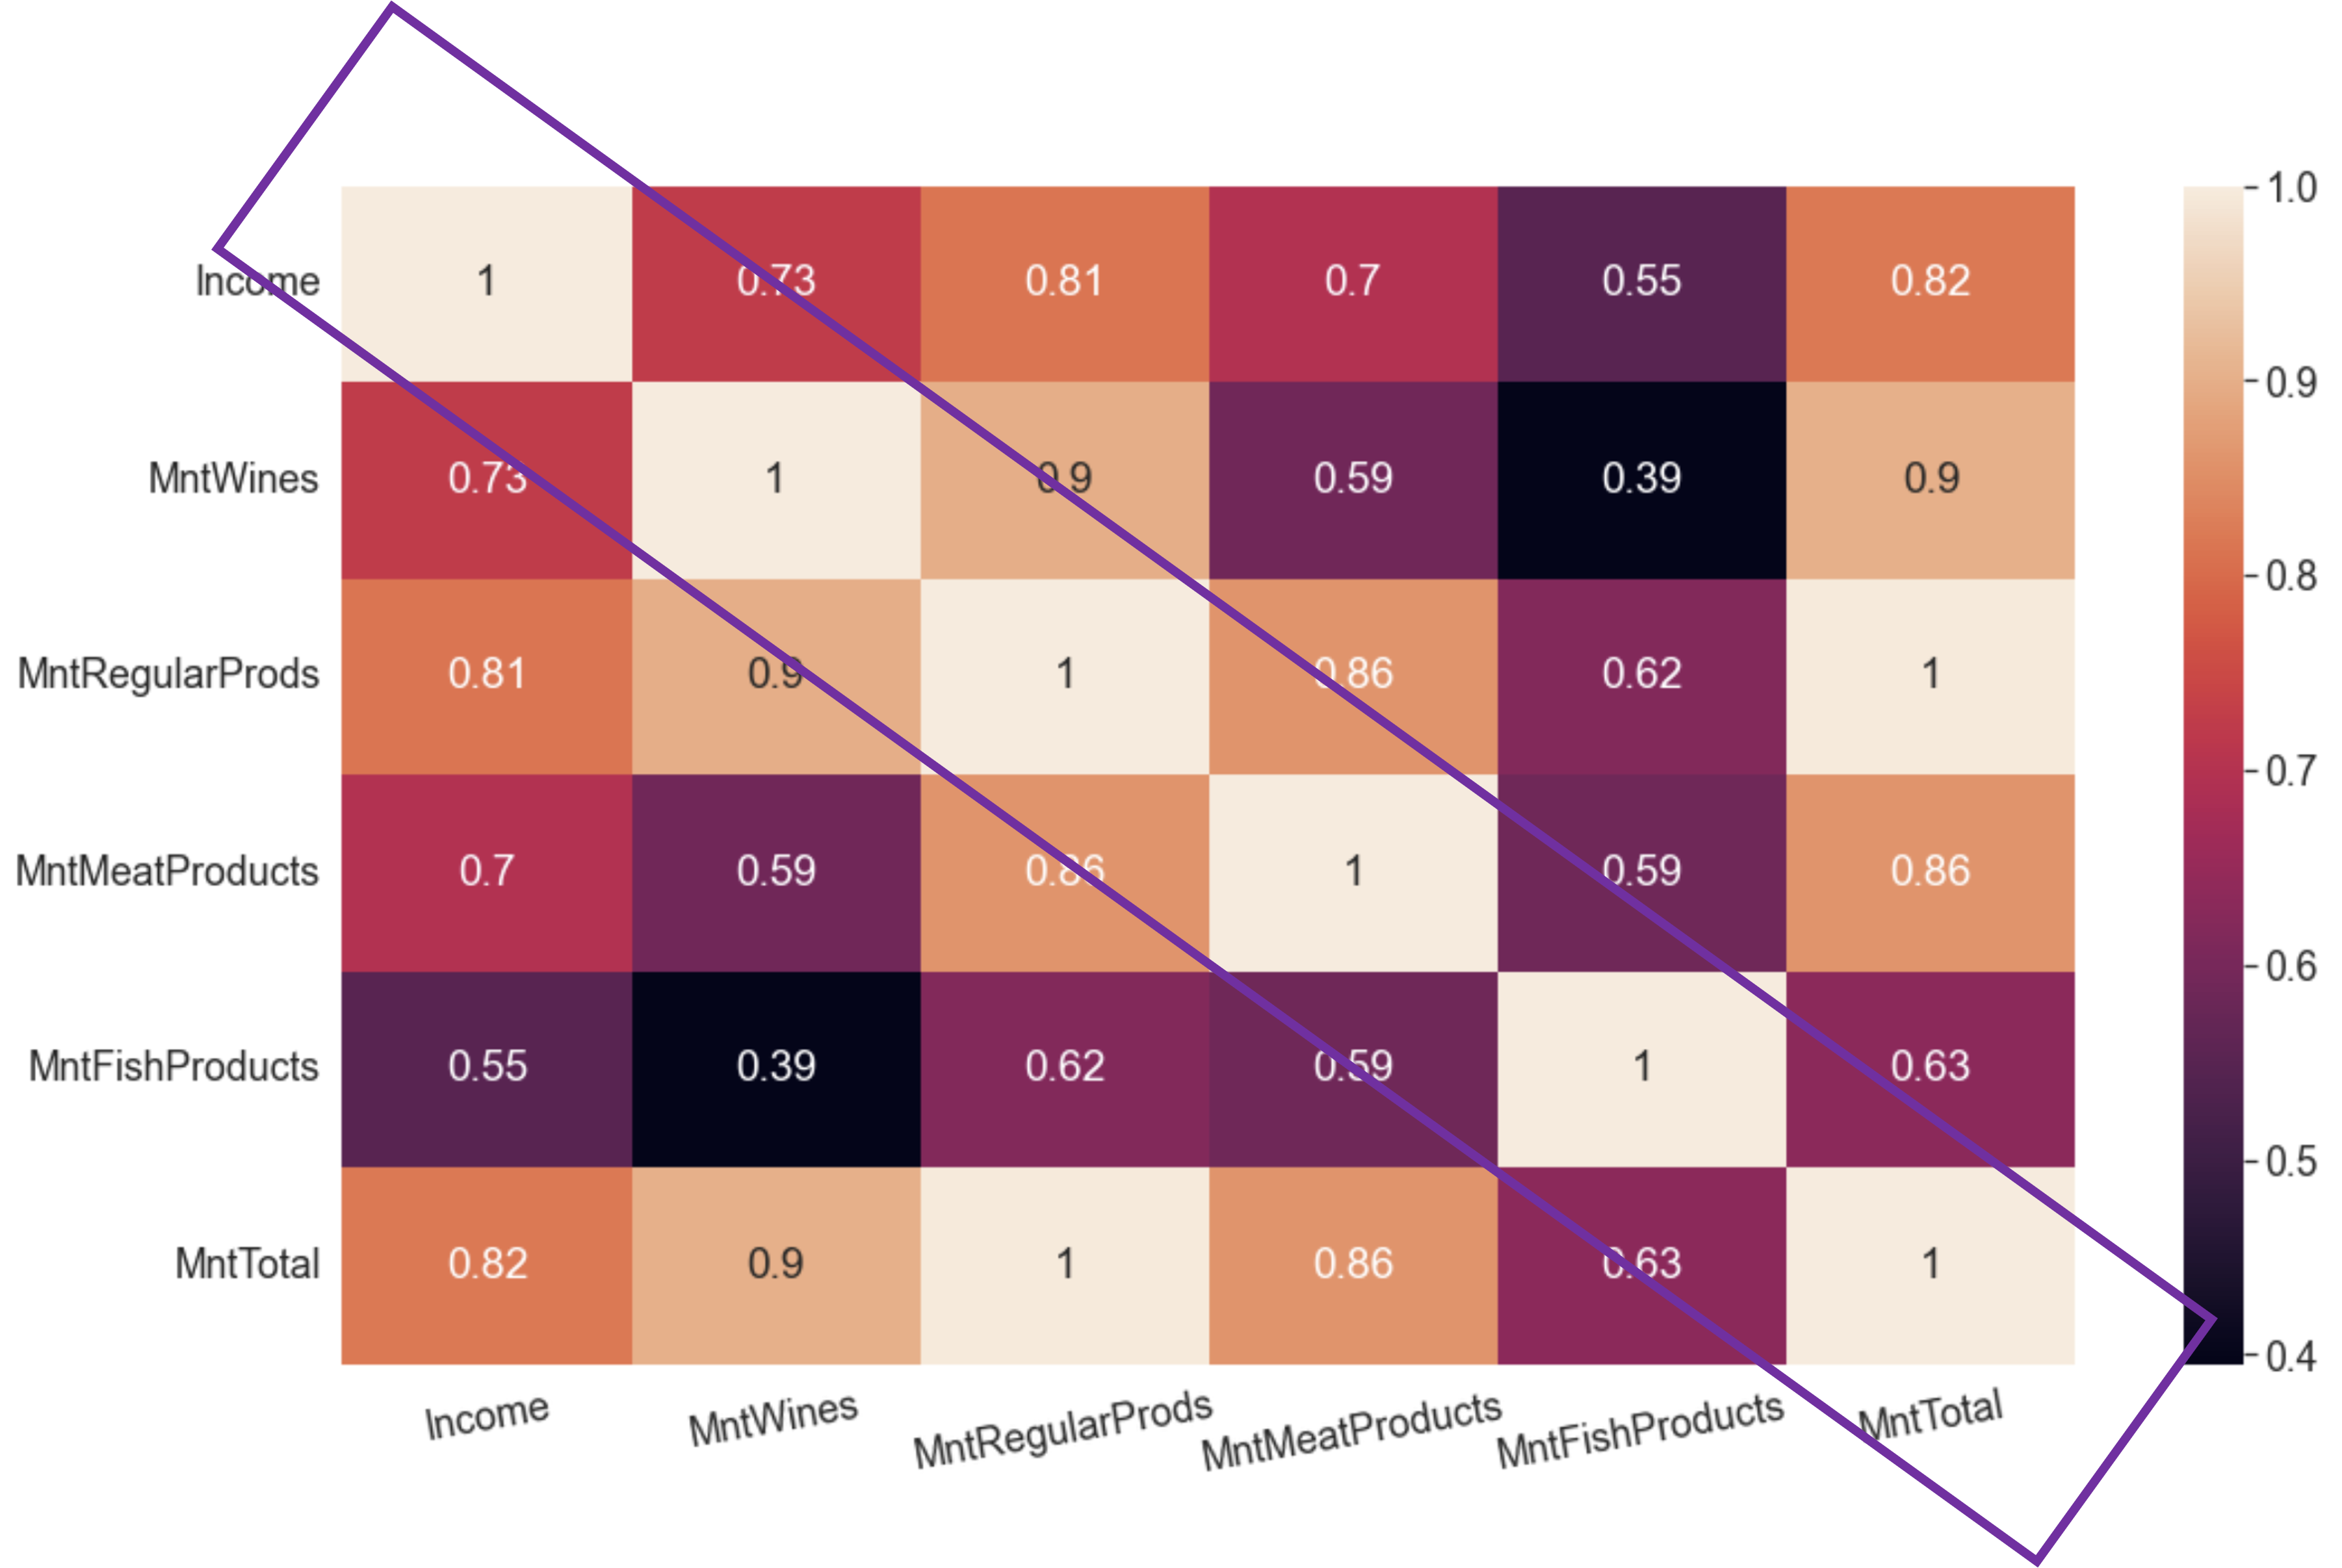
Correlation heatmap

import seaborn as sns

corrMatrix = dataset.corr()

sns.heatmap(
    corrMatrix, 
    annot=True
    )

Example of a heatmap

Introducción a Python en Power BI

Correlation heatmap example

Example of a heatmap

Introducción a Python en Power BI

Correlation heatmap example

Example of a heatmap

Introducción a Python en Power BI

Correlation does not mean causation

  • Strong correlative relationship <> One caused the other

  • Causal relationship typically requires experimentation
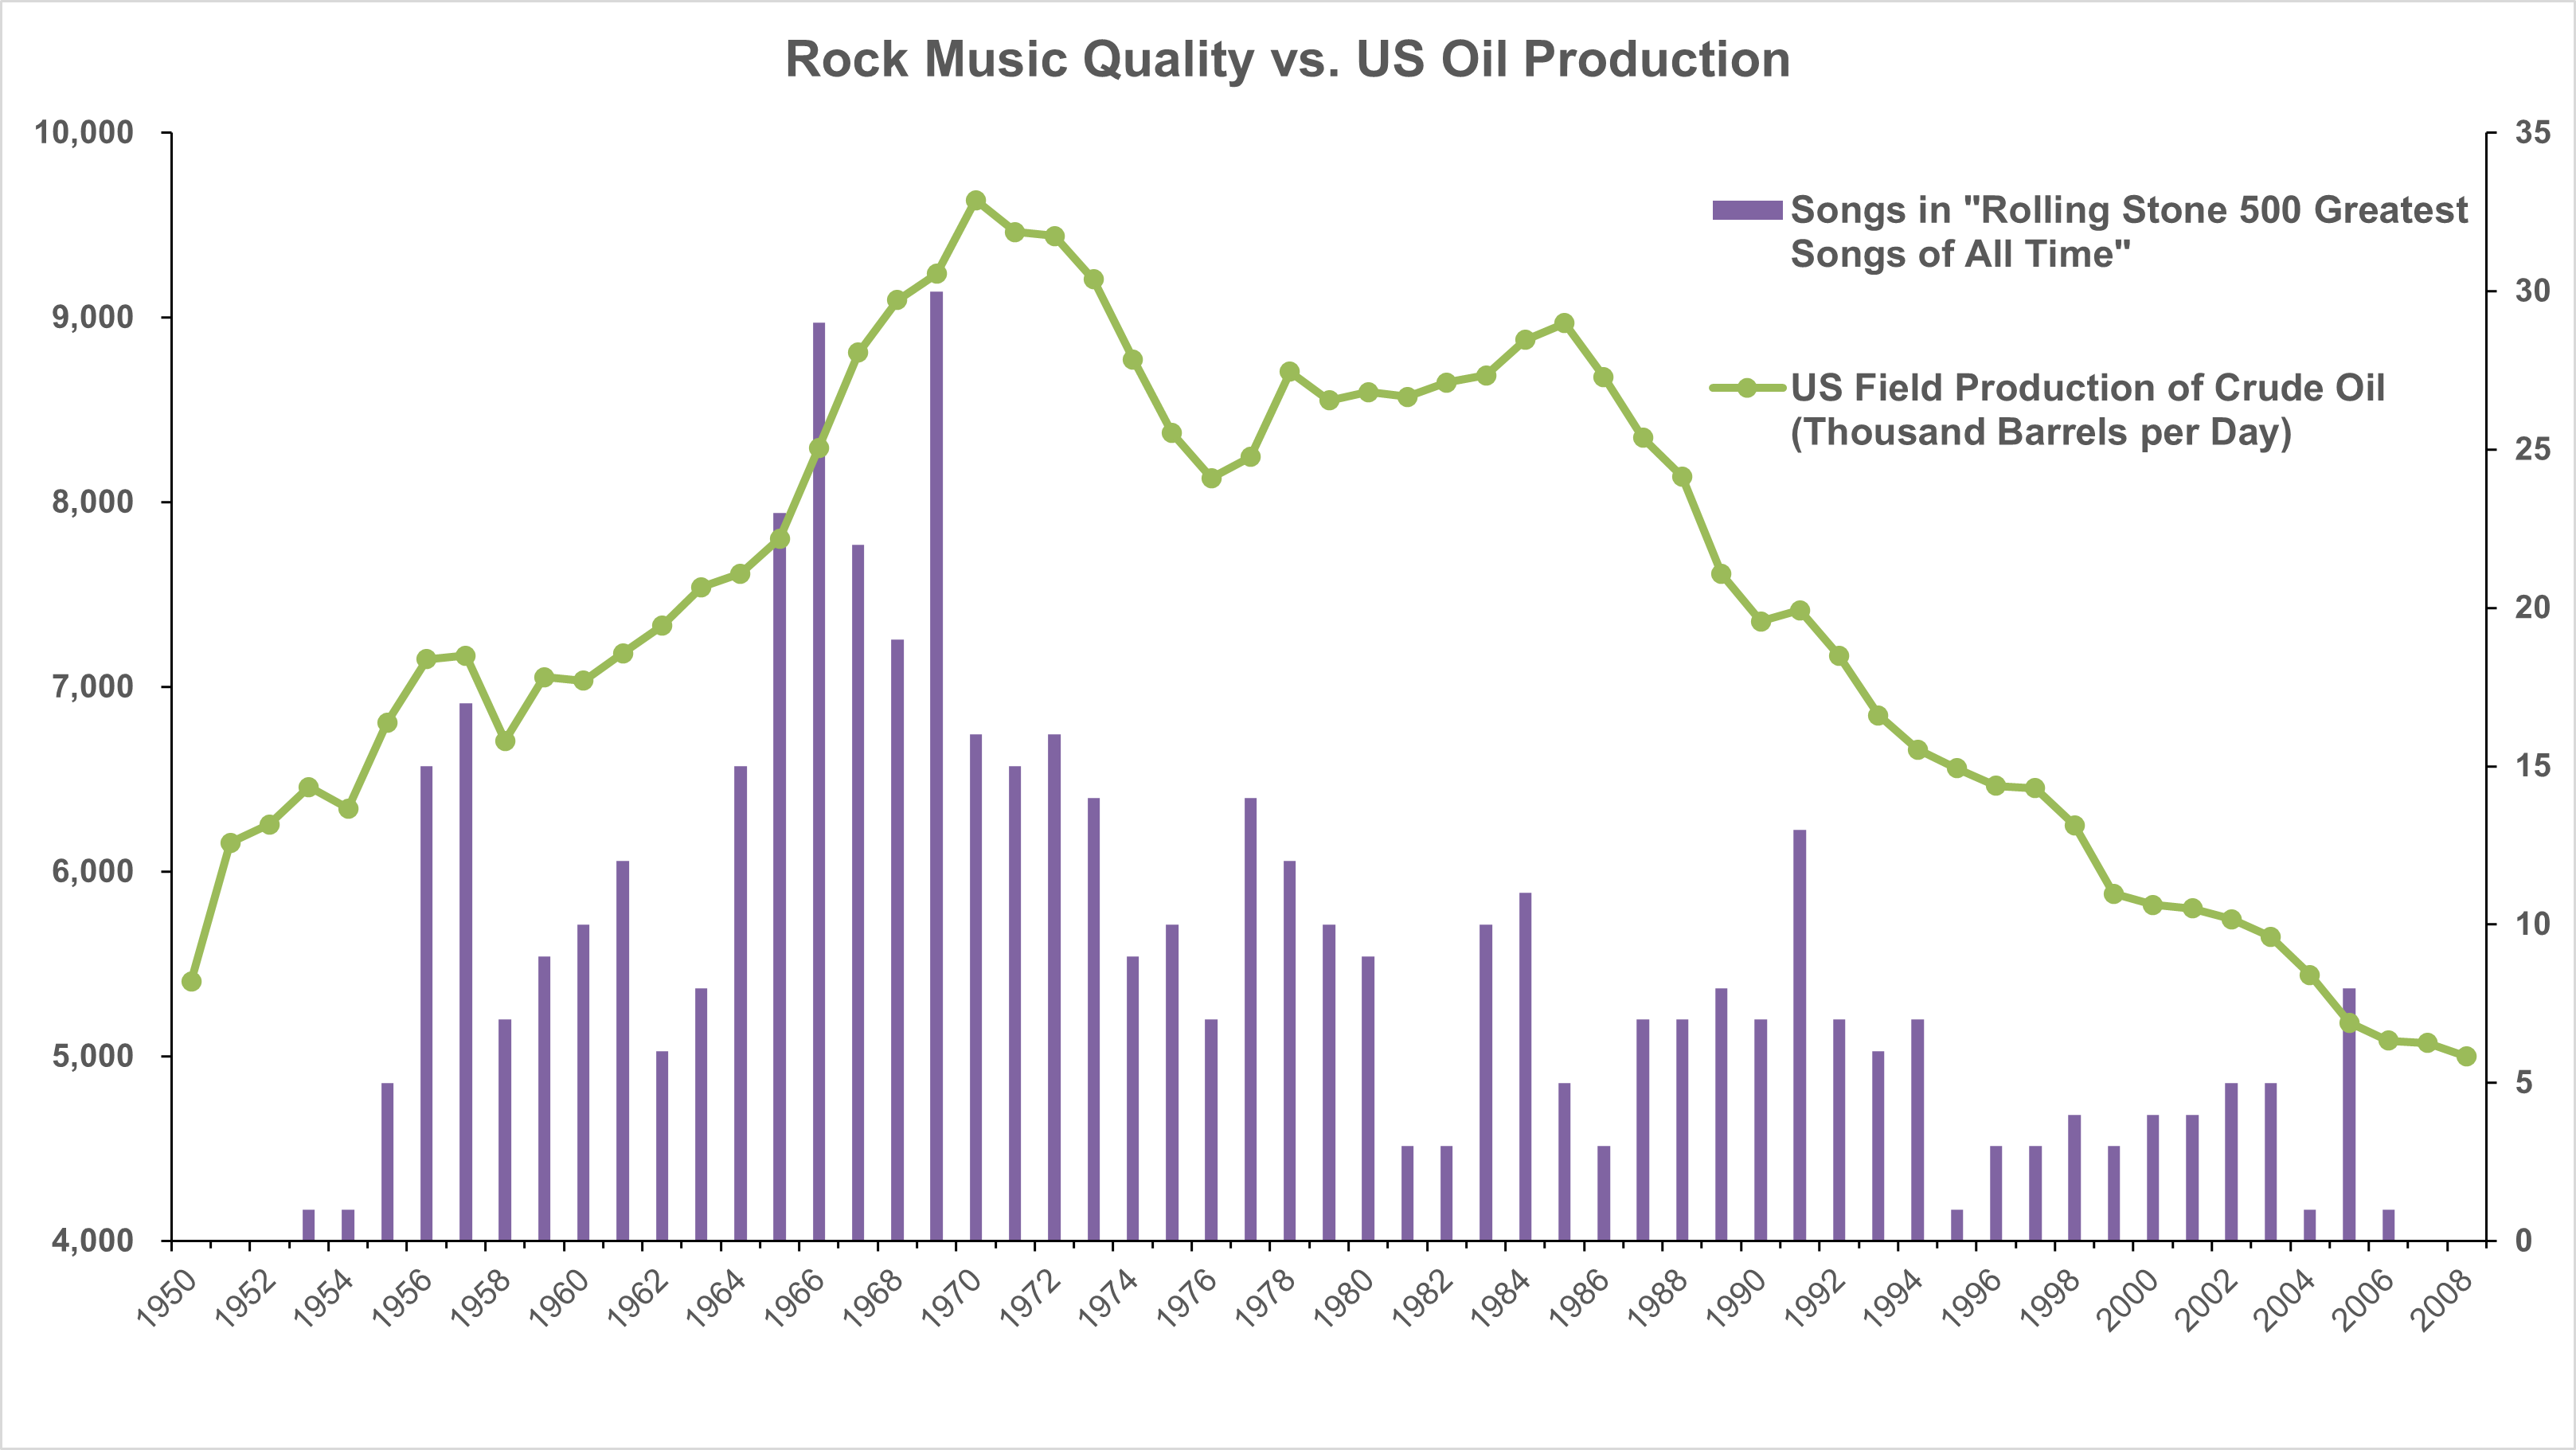
Rock music quality vs US oil production

Introducción a Python en Power BI

Let's practice!

Introducción a Python en Power BI

Preparing Video For Download...