Penyesuaian
Python Tingkat Menengah

Hugo Bowne-Anderson
Data Scientist at DataCamp
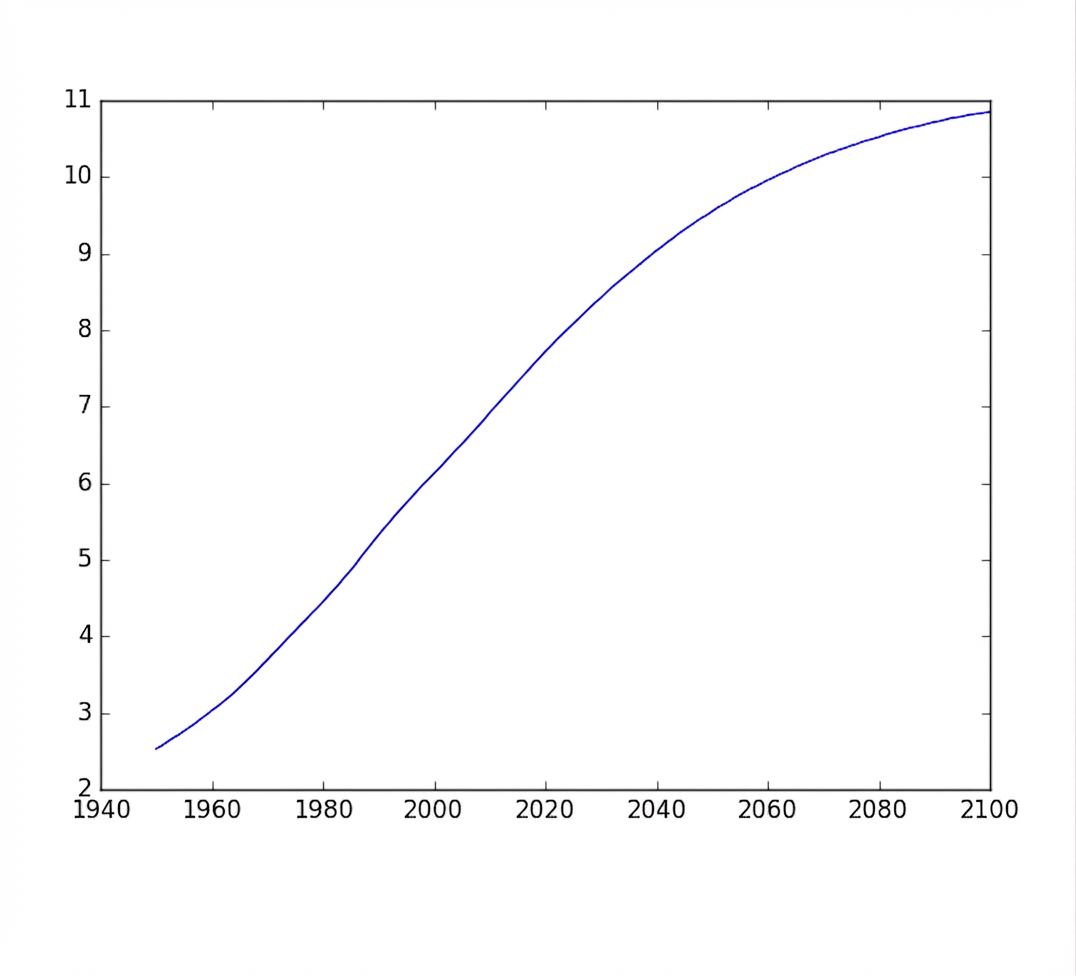
Alur cerita dasar
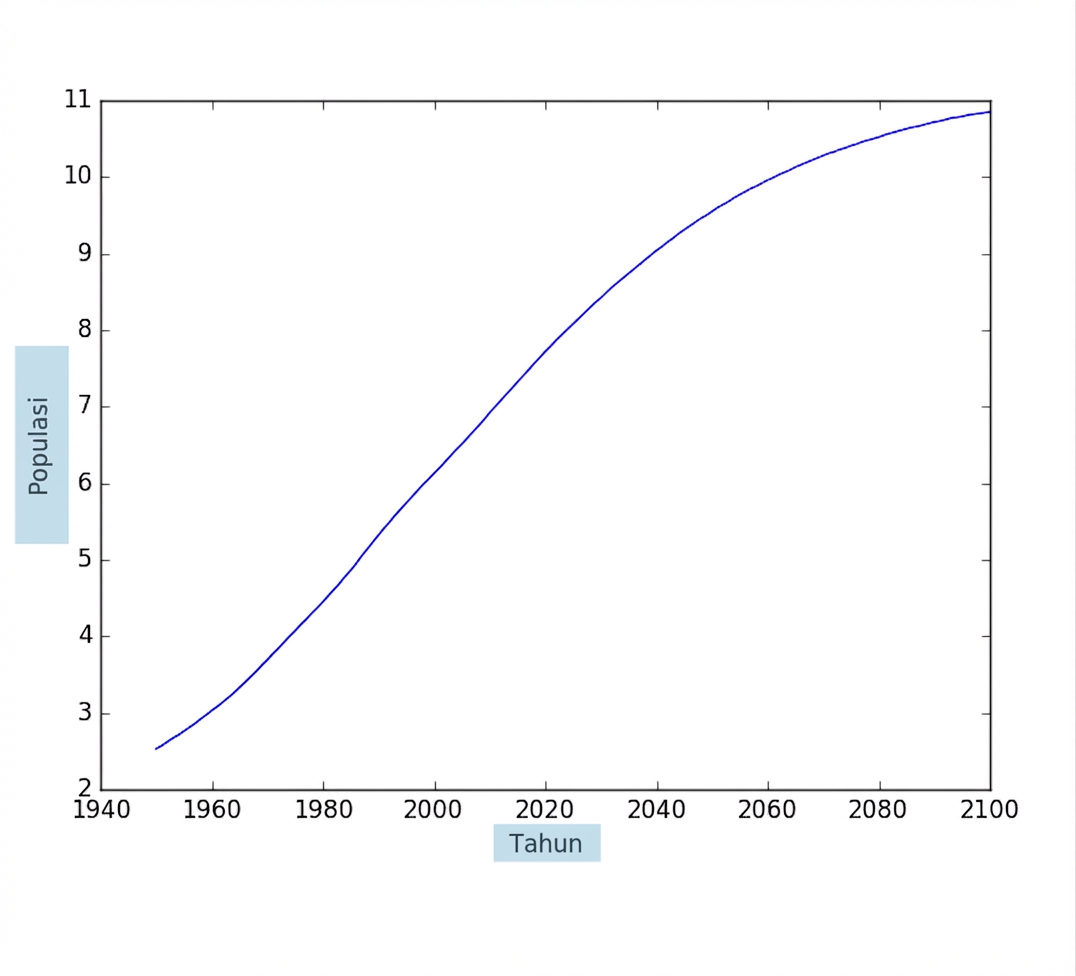
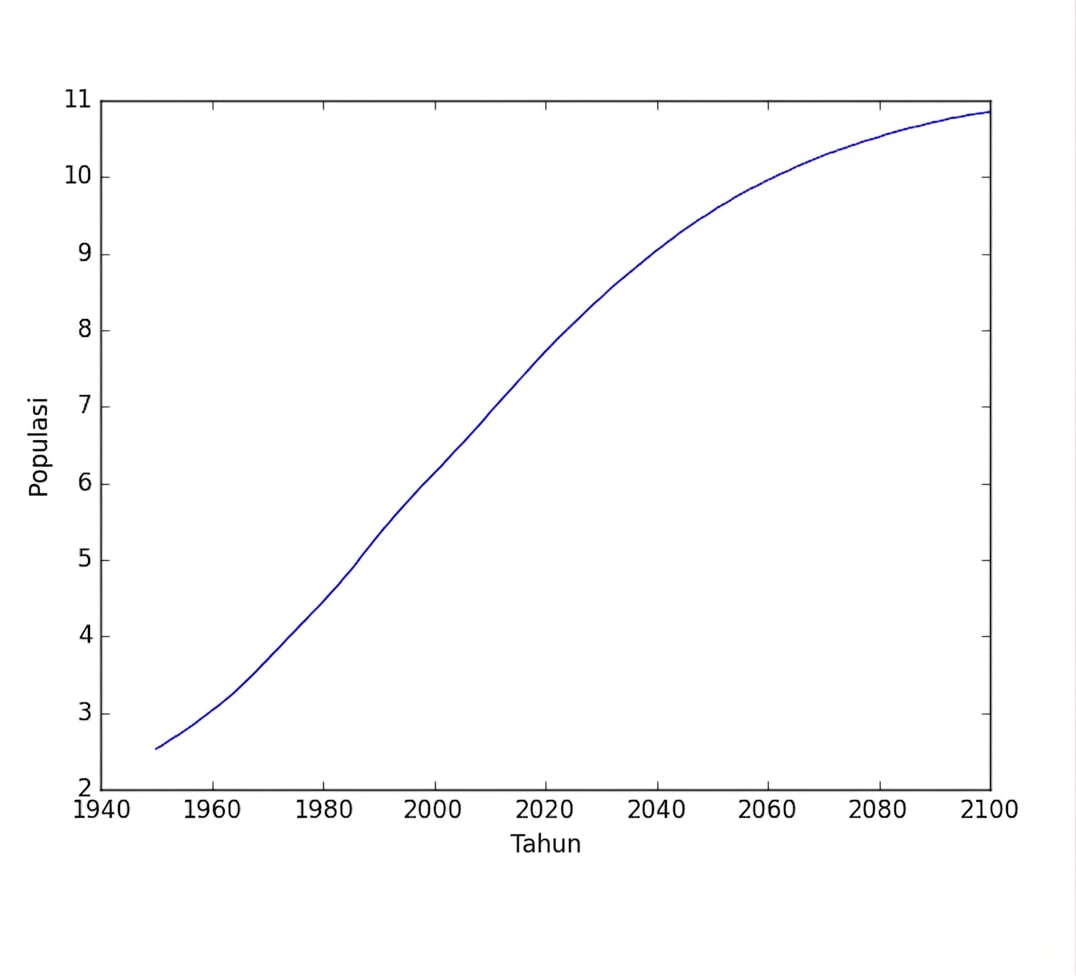
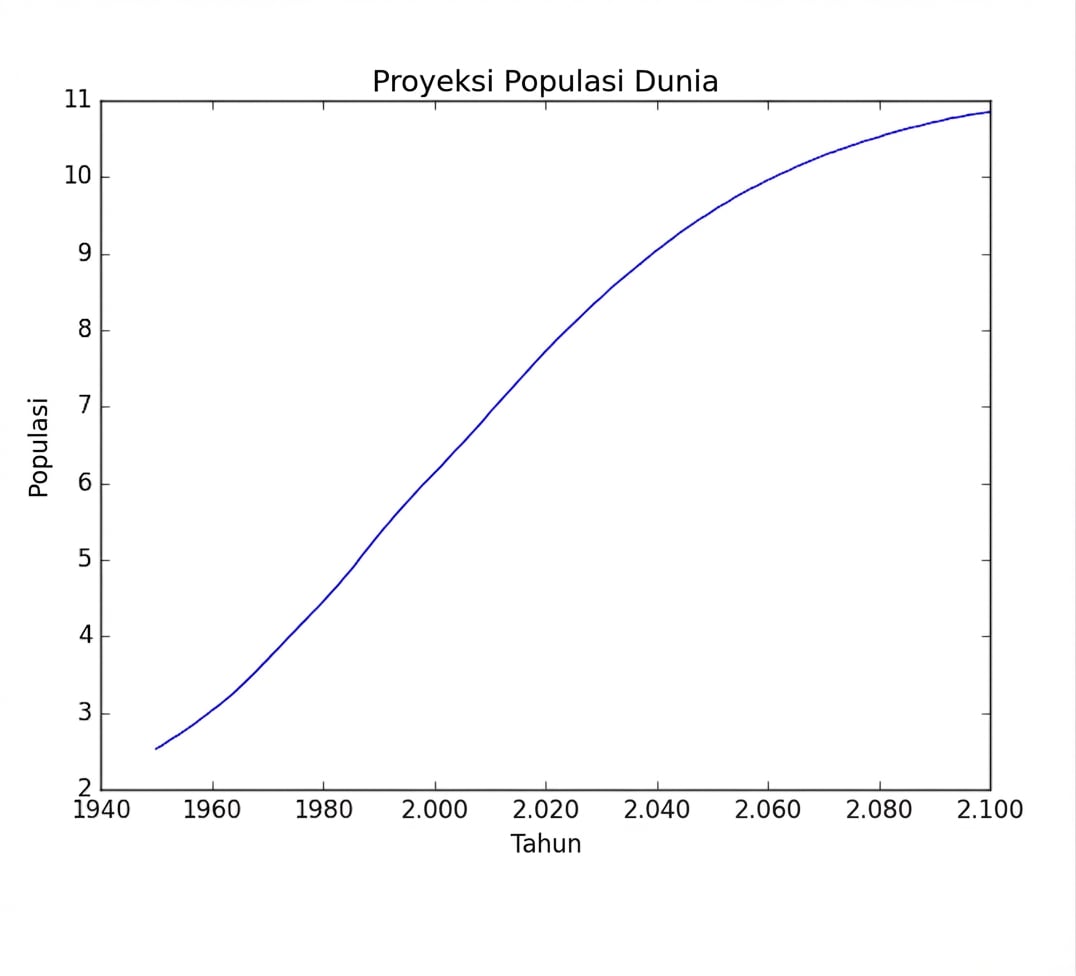
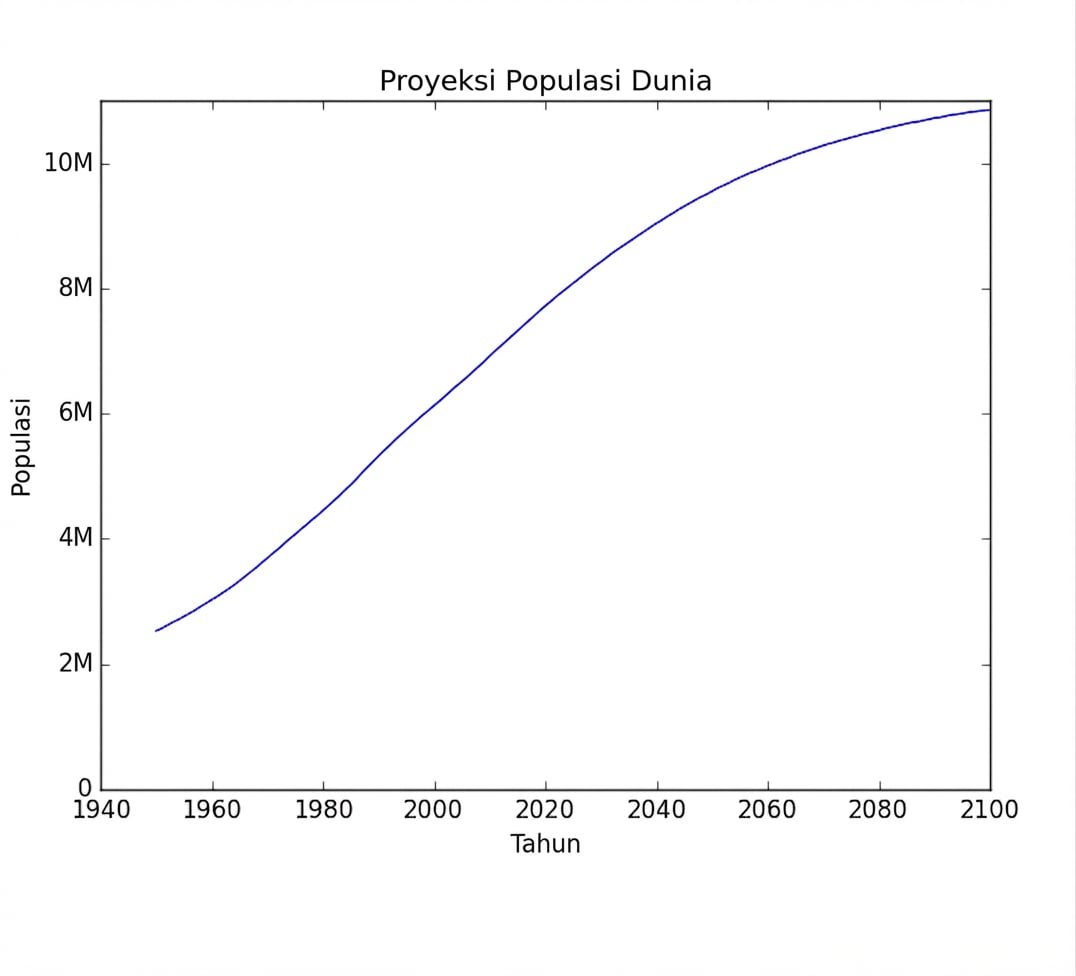
Label sumbu
Label sumbu
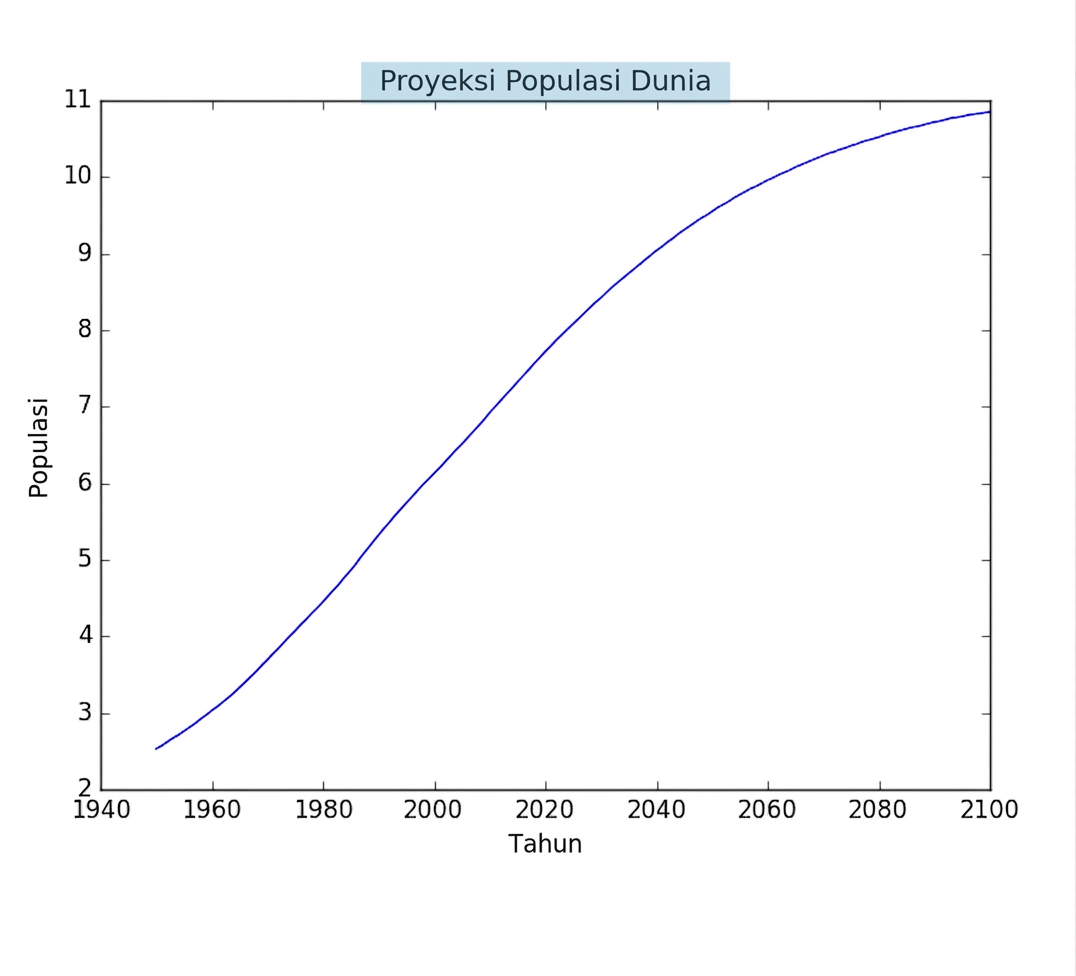
Judul
Judul
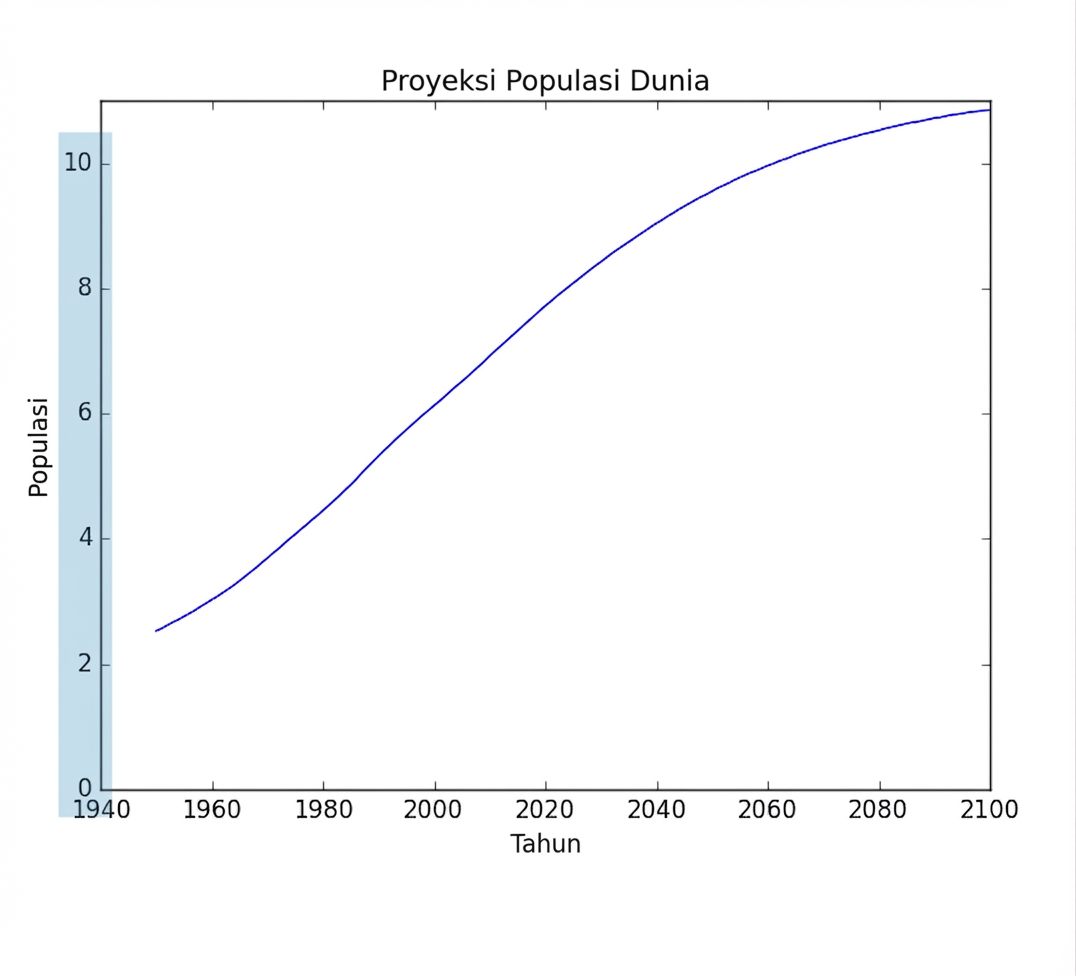
Kutu
Kutu
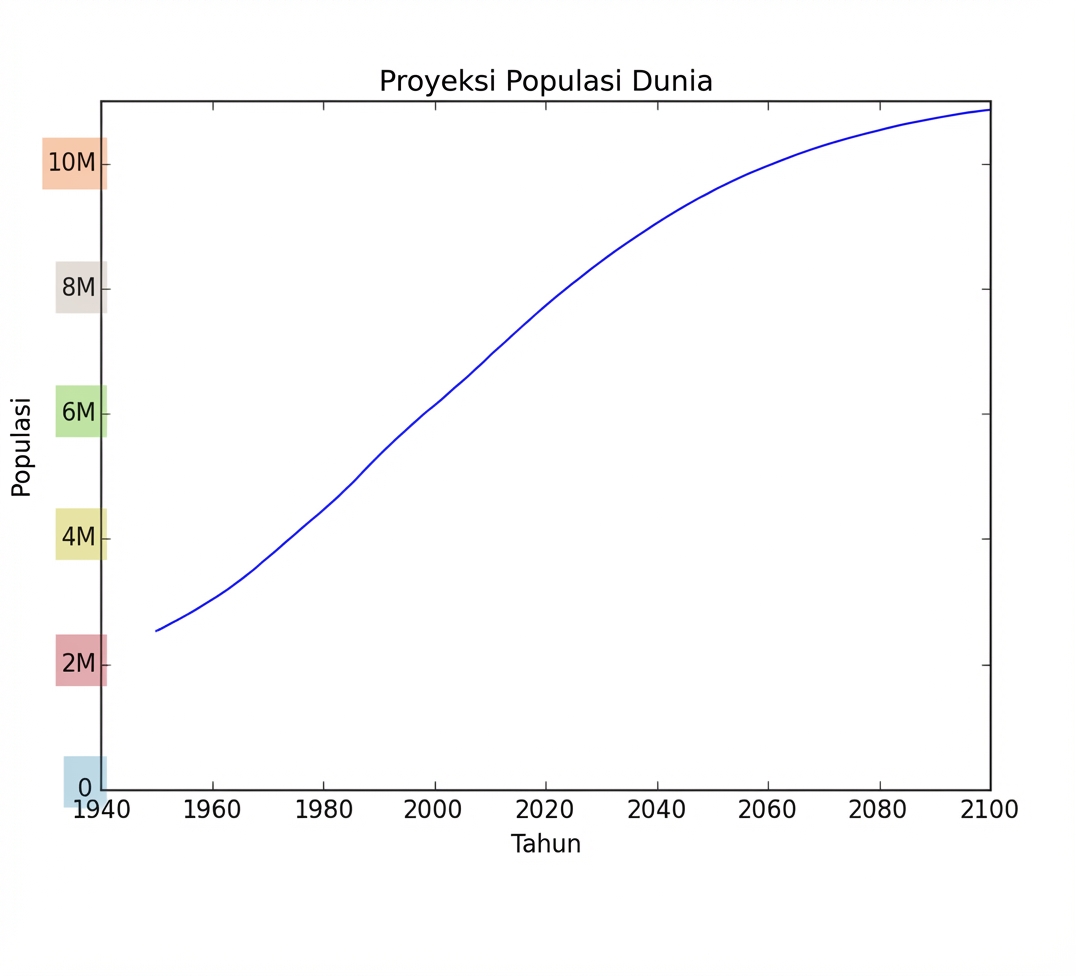
Kutu (2)
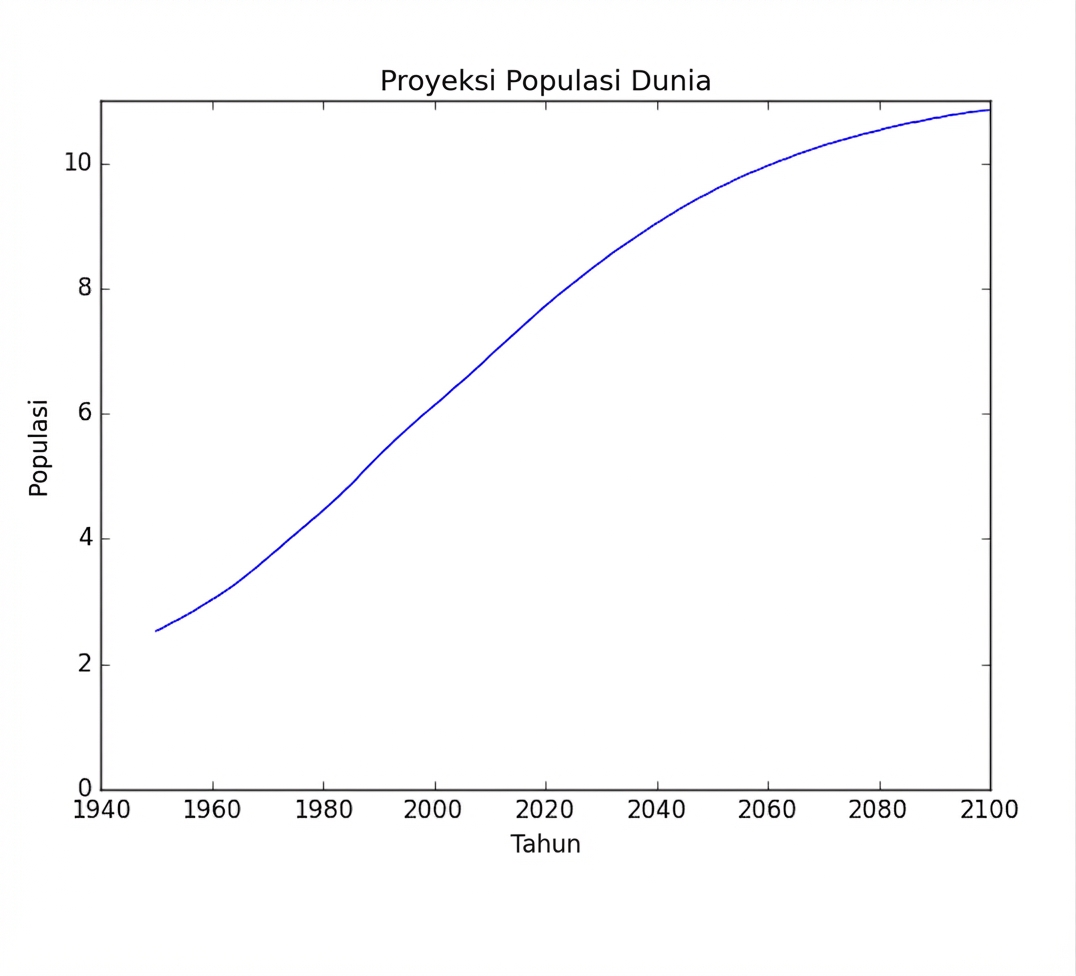
Kutu (2)
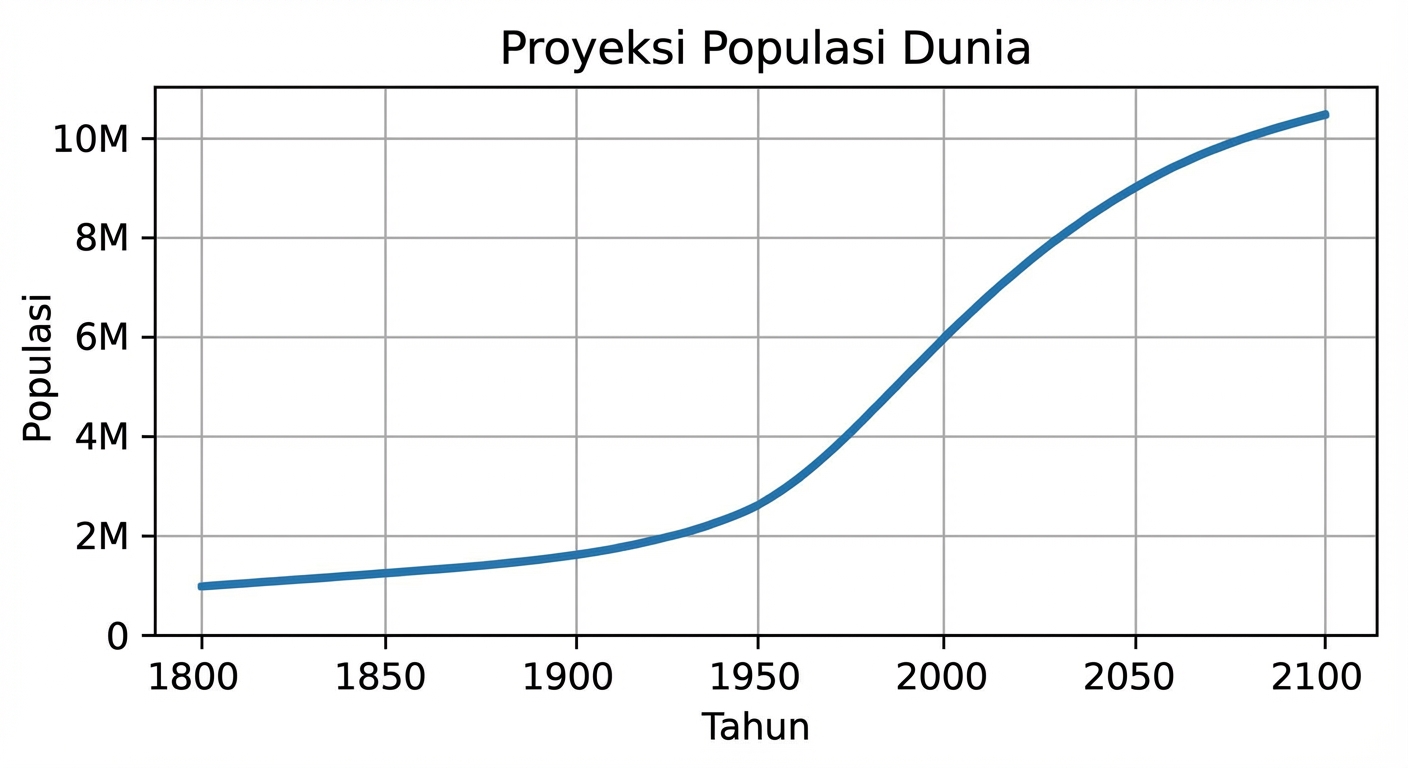
Tambahkan data historis
Tambahkan data historis
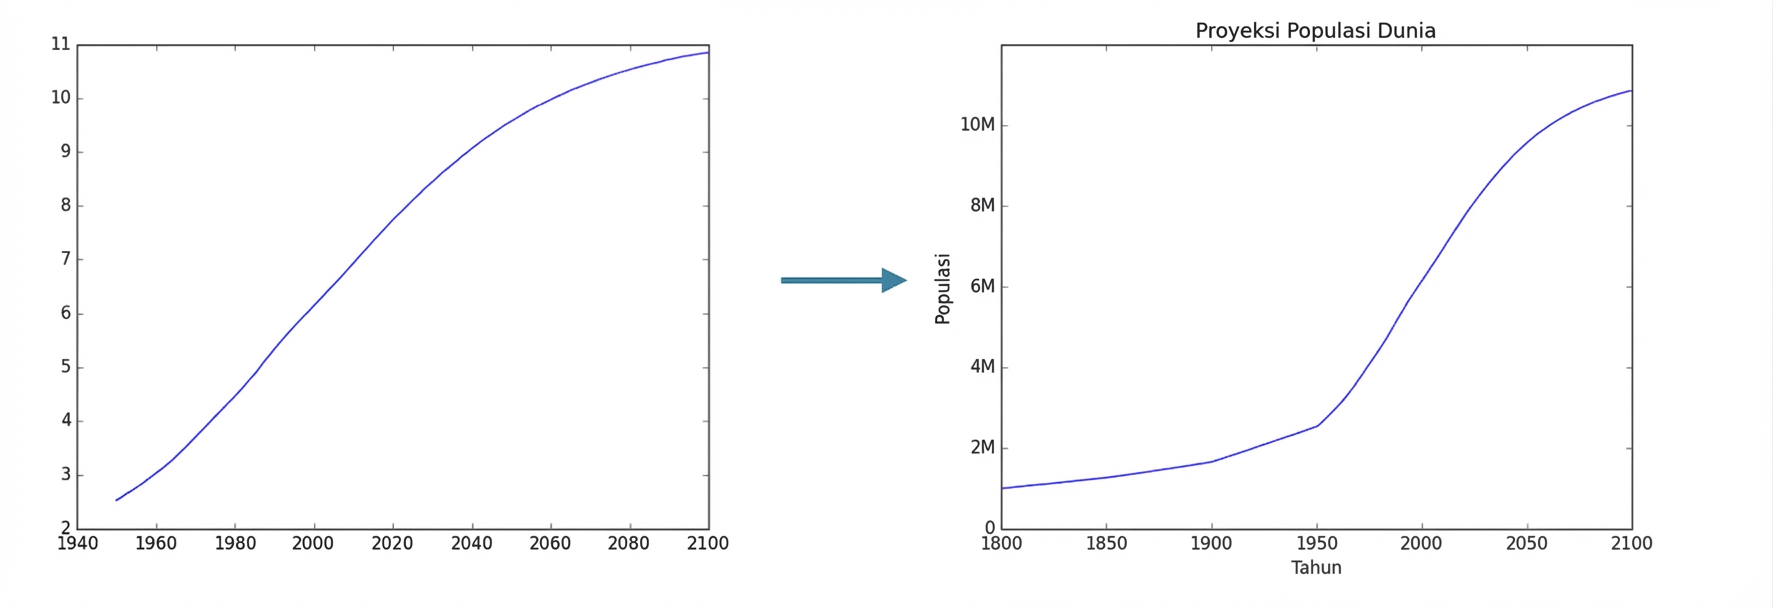
Sebelum vs. setelah
Python Tingkat Menengah
Hugo Bowne-Anderson
Data Scientist at DataCamp

