Stats avec les geoms
Visualisation de données intermédiaire avec ggplot2

Rick Scavetta
Founder, Scavetta Academy
geom_ <-> stat_
geom_ <-> stat_
geom_ <-> stat_
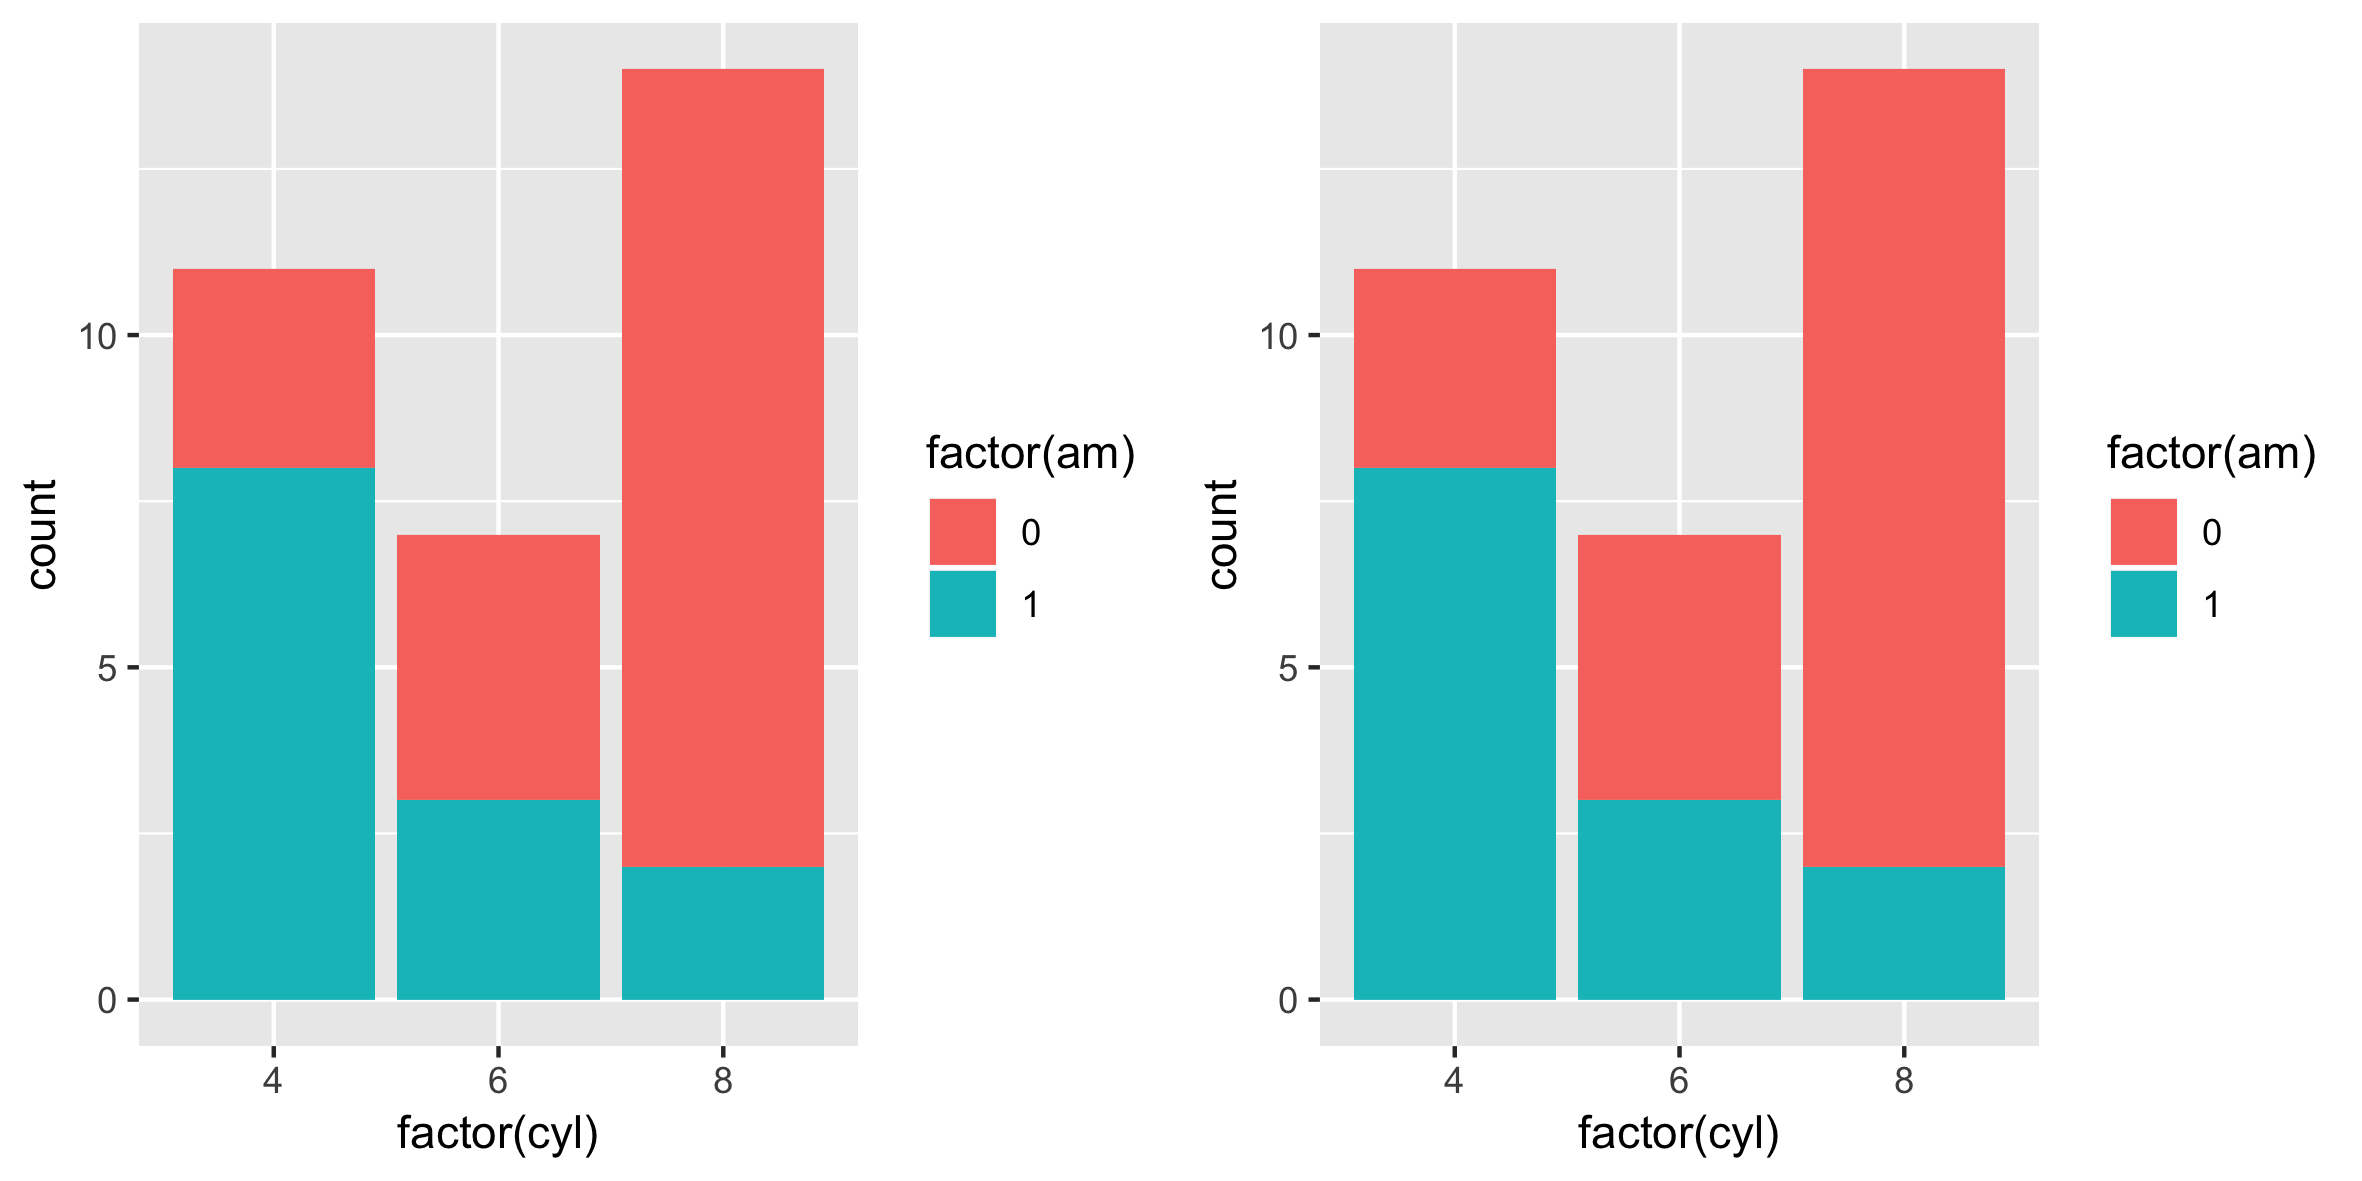
p <- ggplot(mtcars, aes(x = factor(cyl),  fill = factor(am)))
p + geom_bar()
p + stat_count()
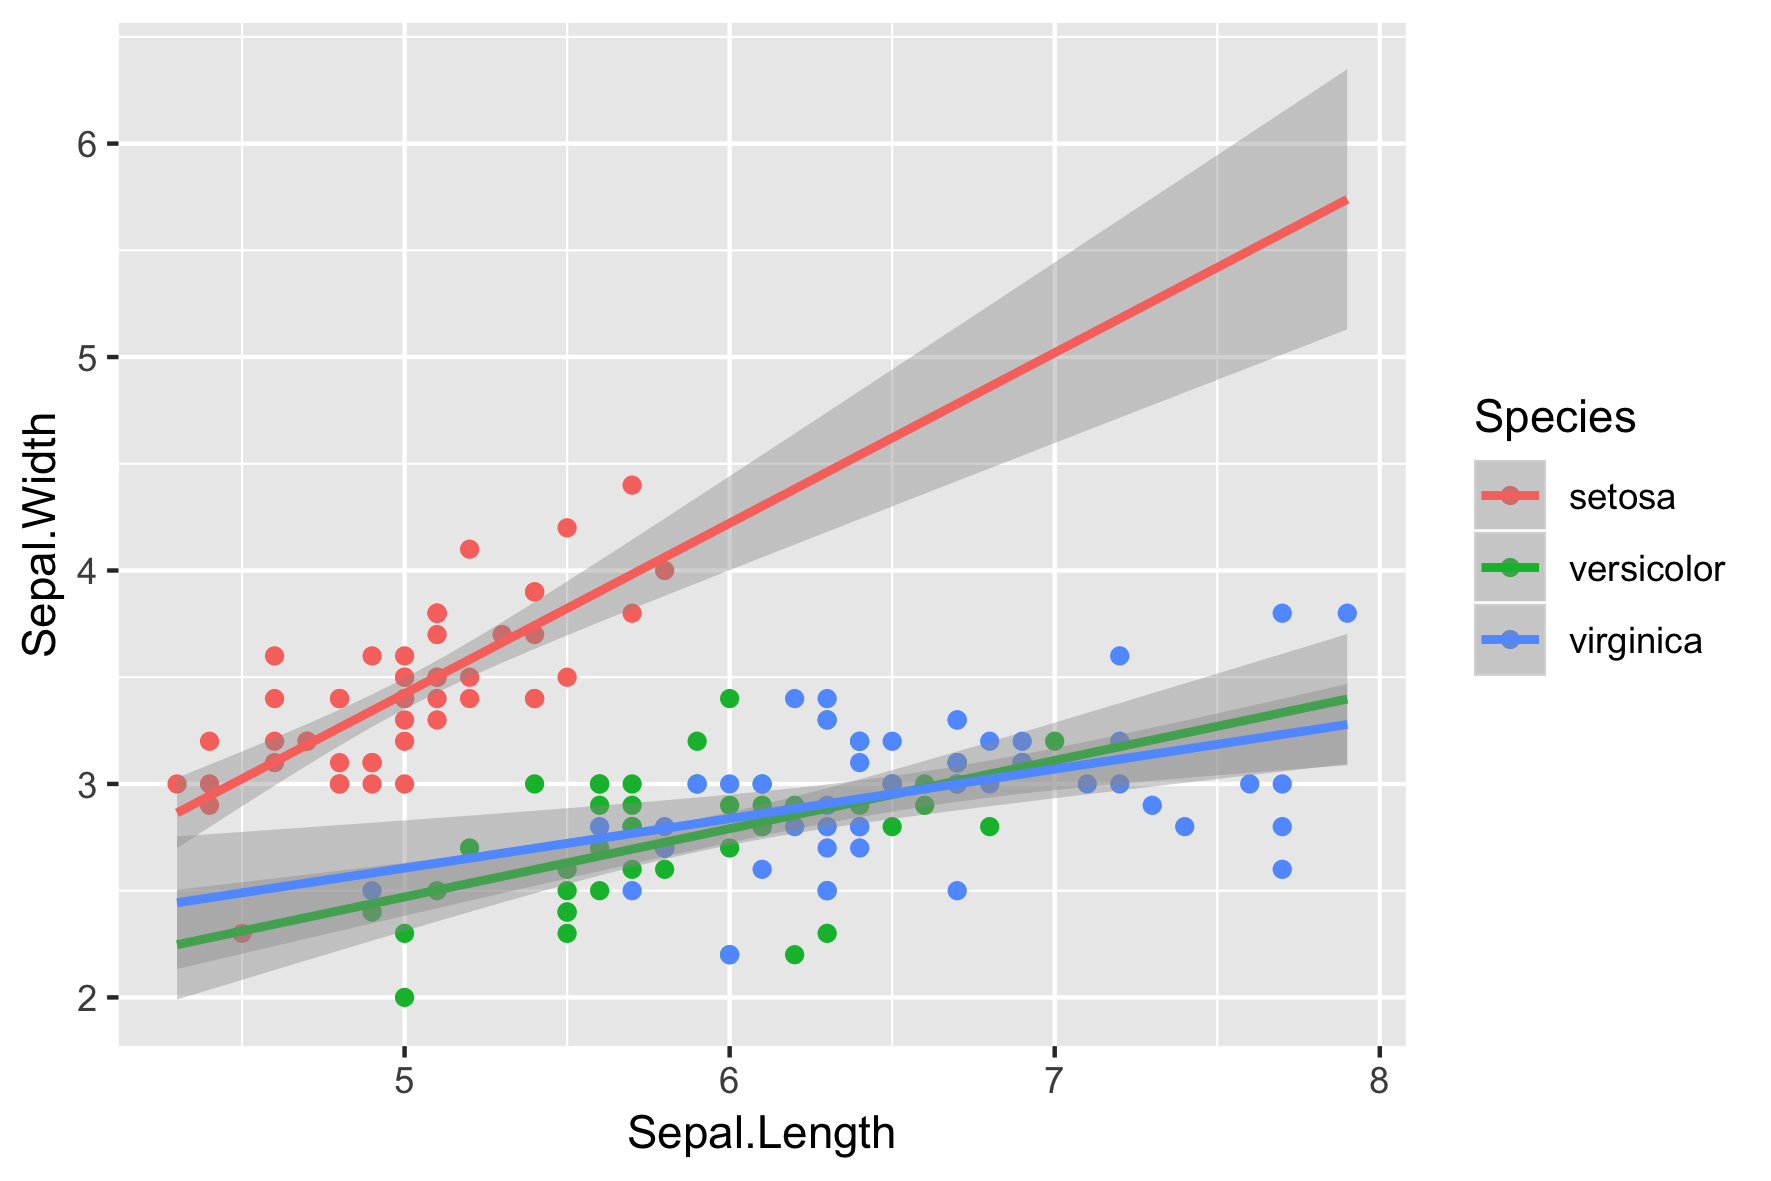
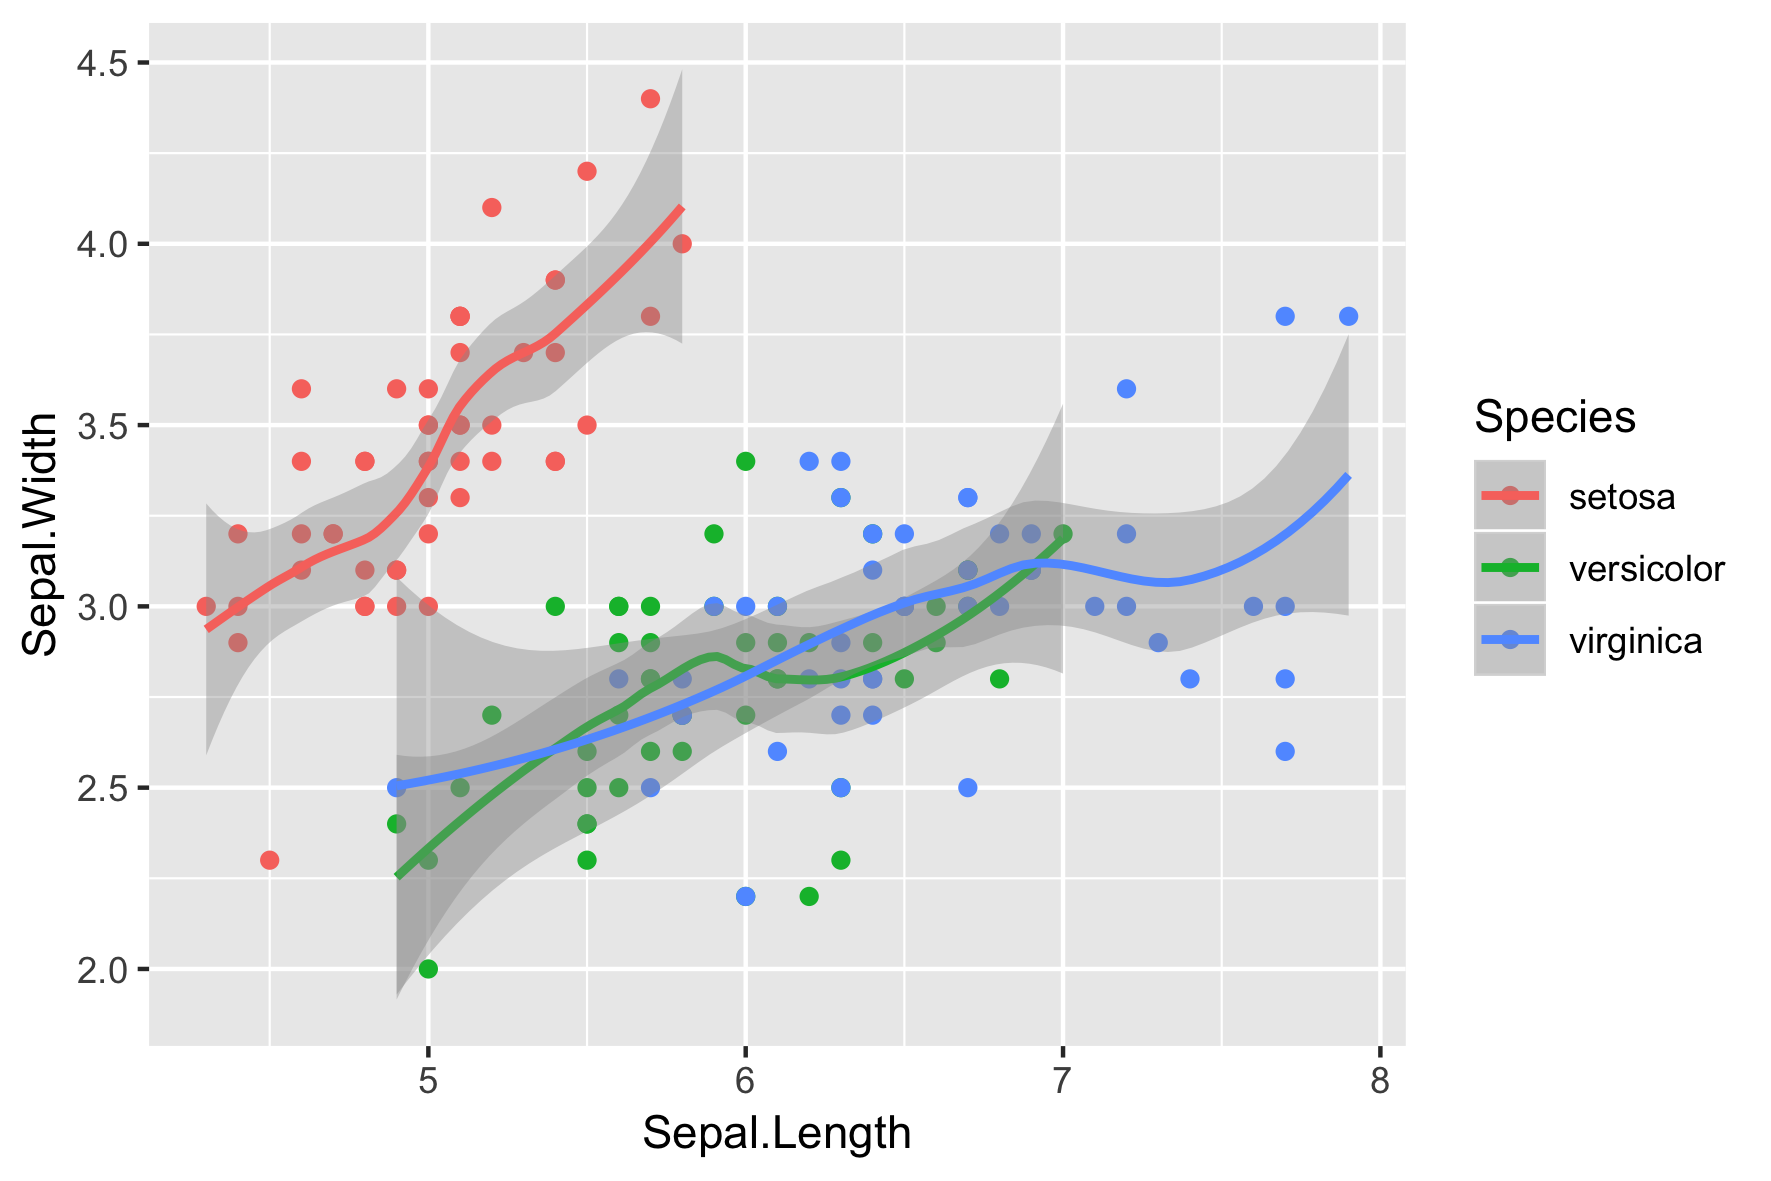
stat_smooth()
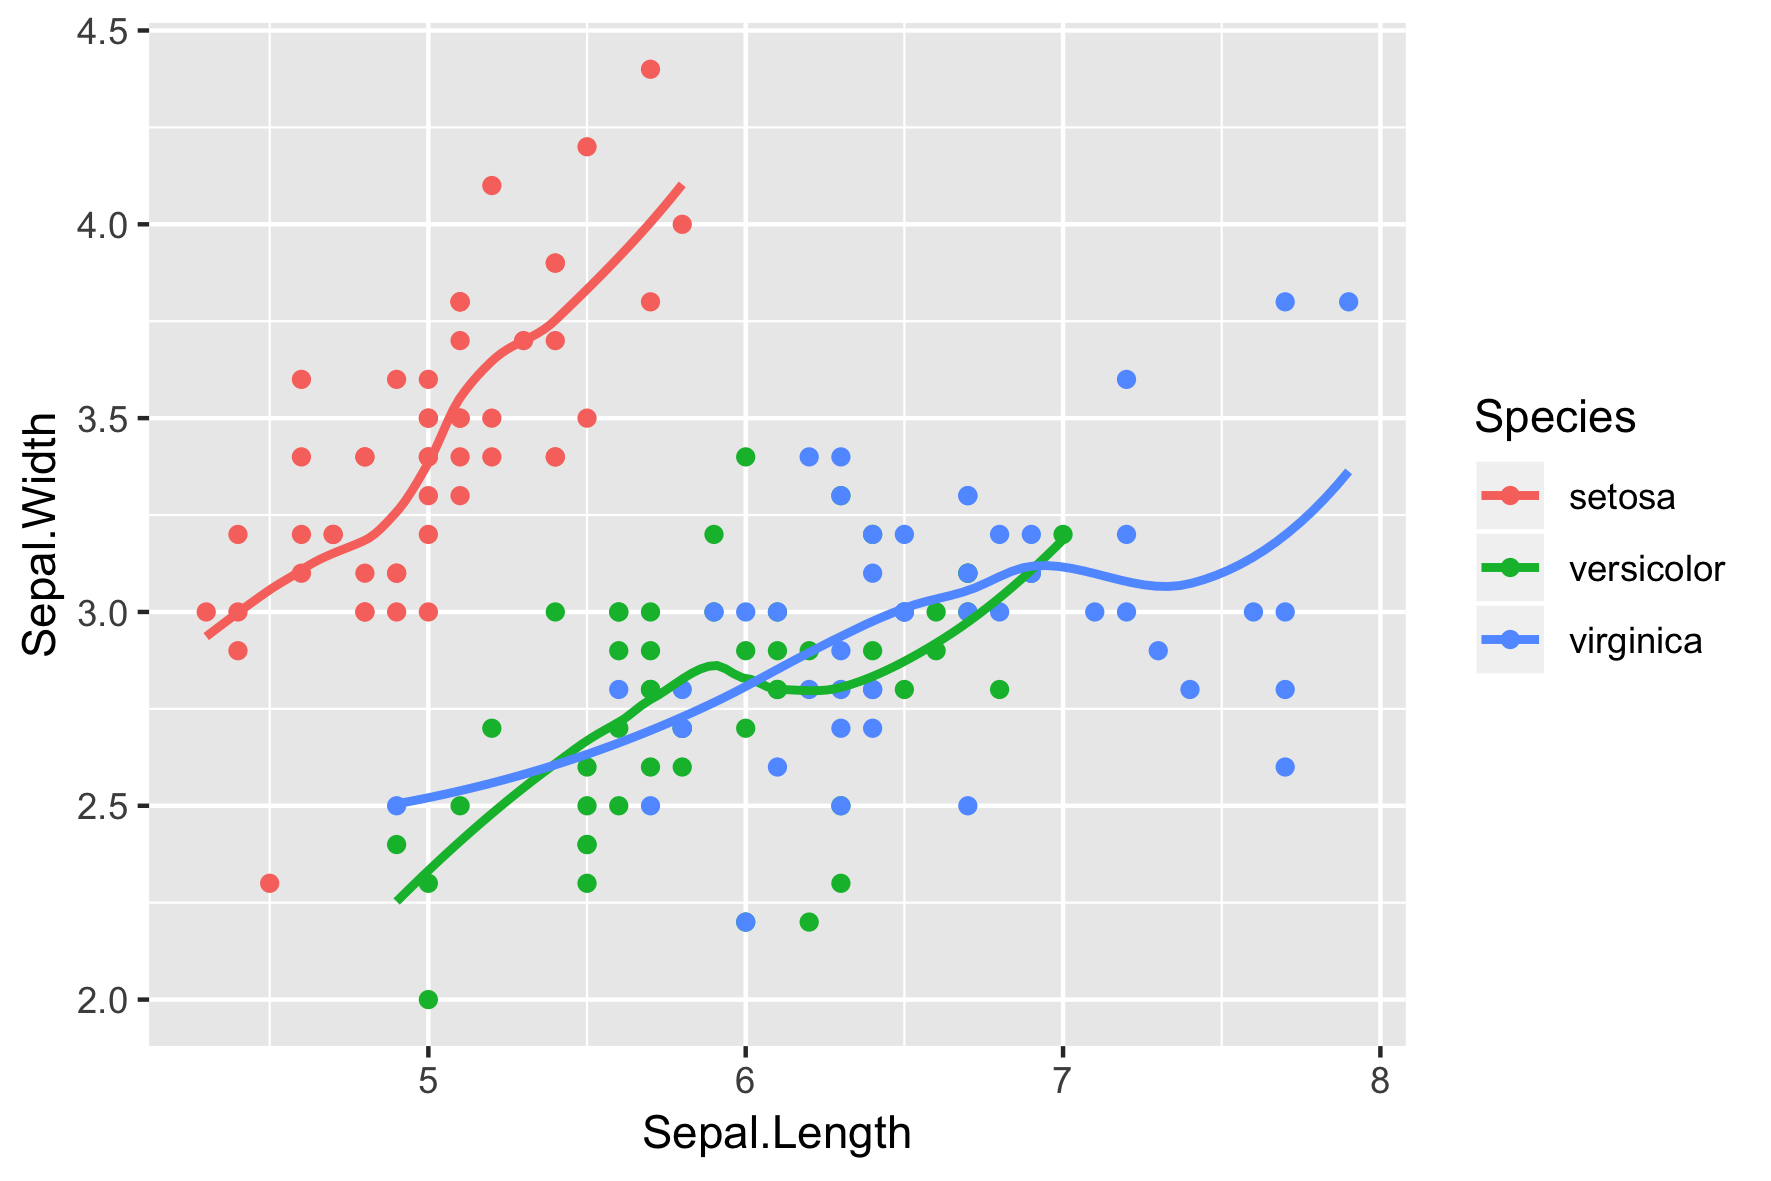
stat_smooth(se = FALSE)
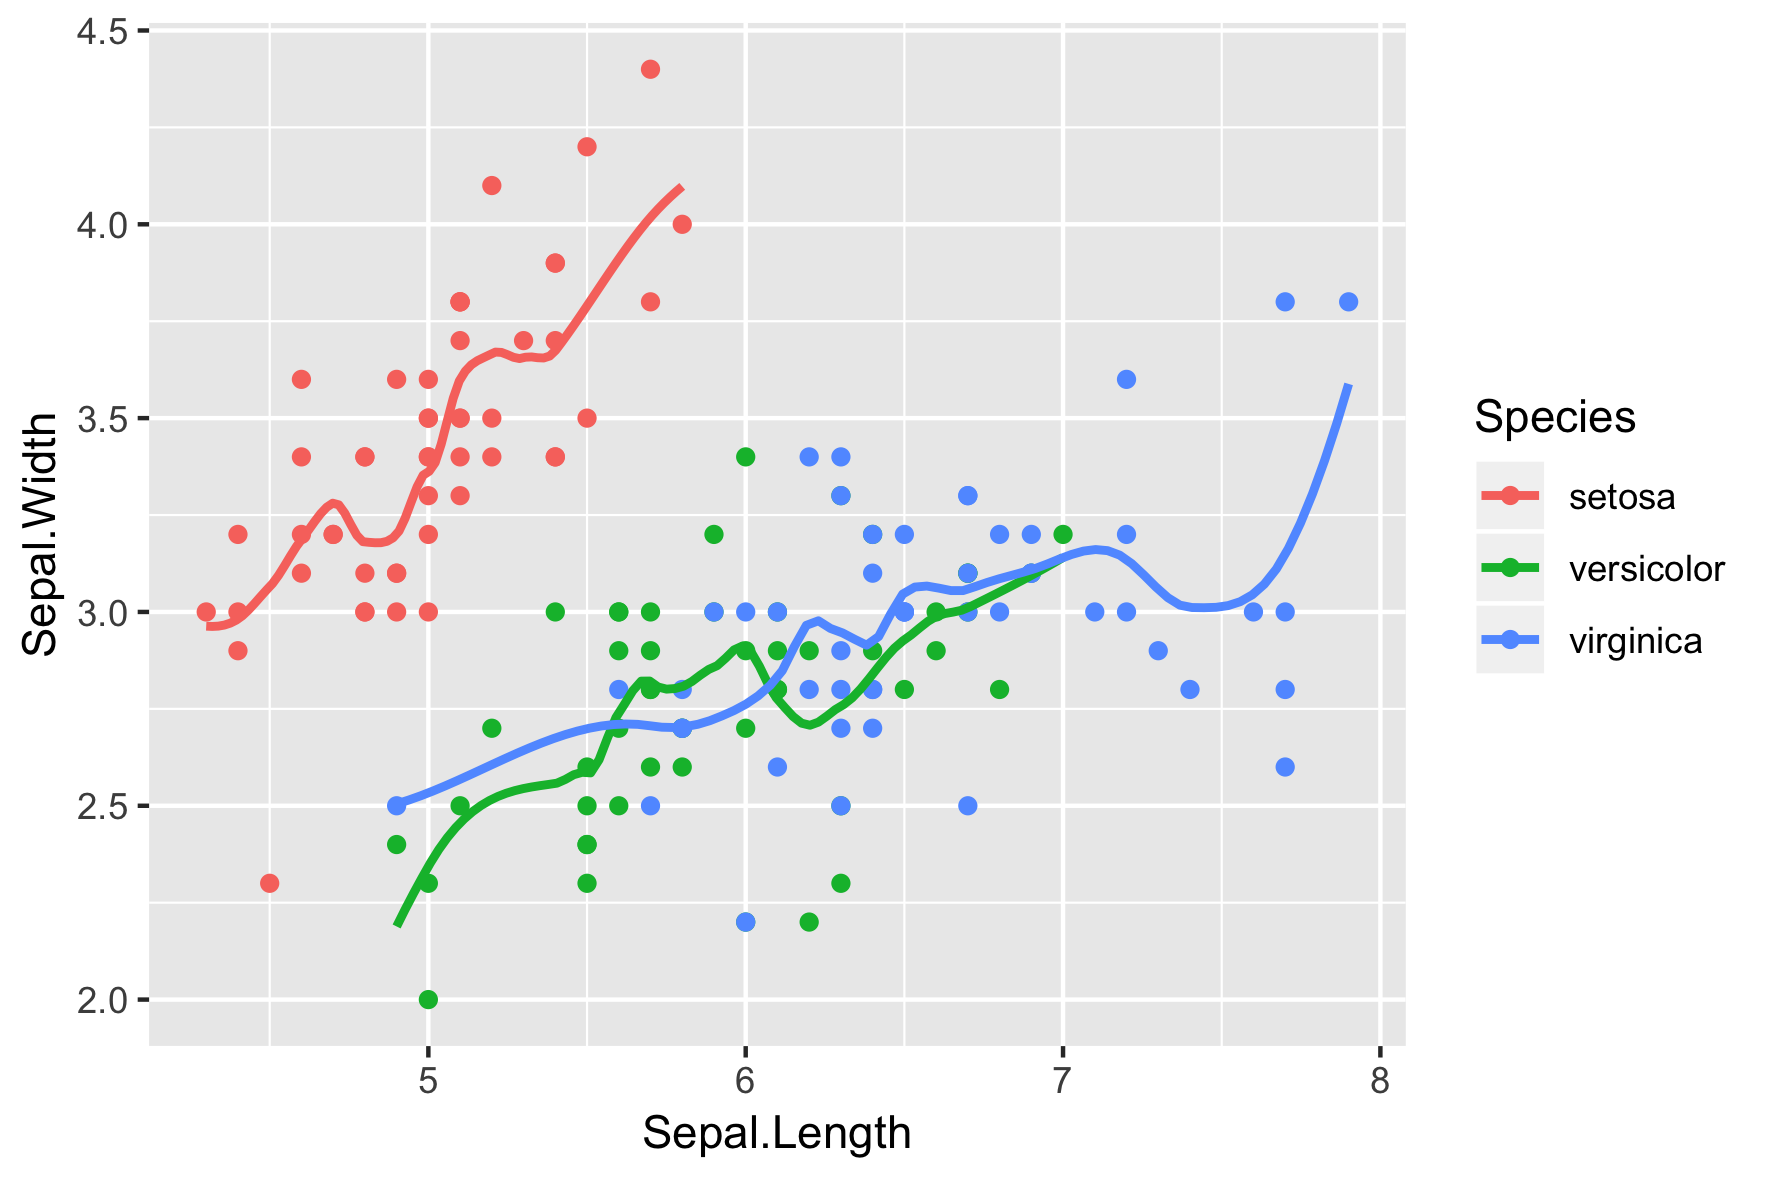
geom_smooth(span = 0.4)
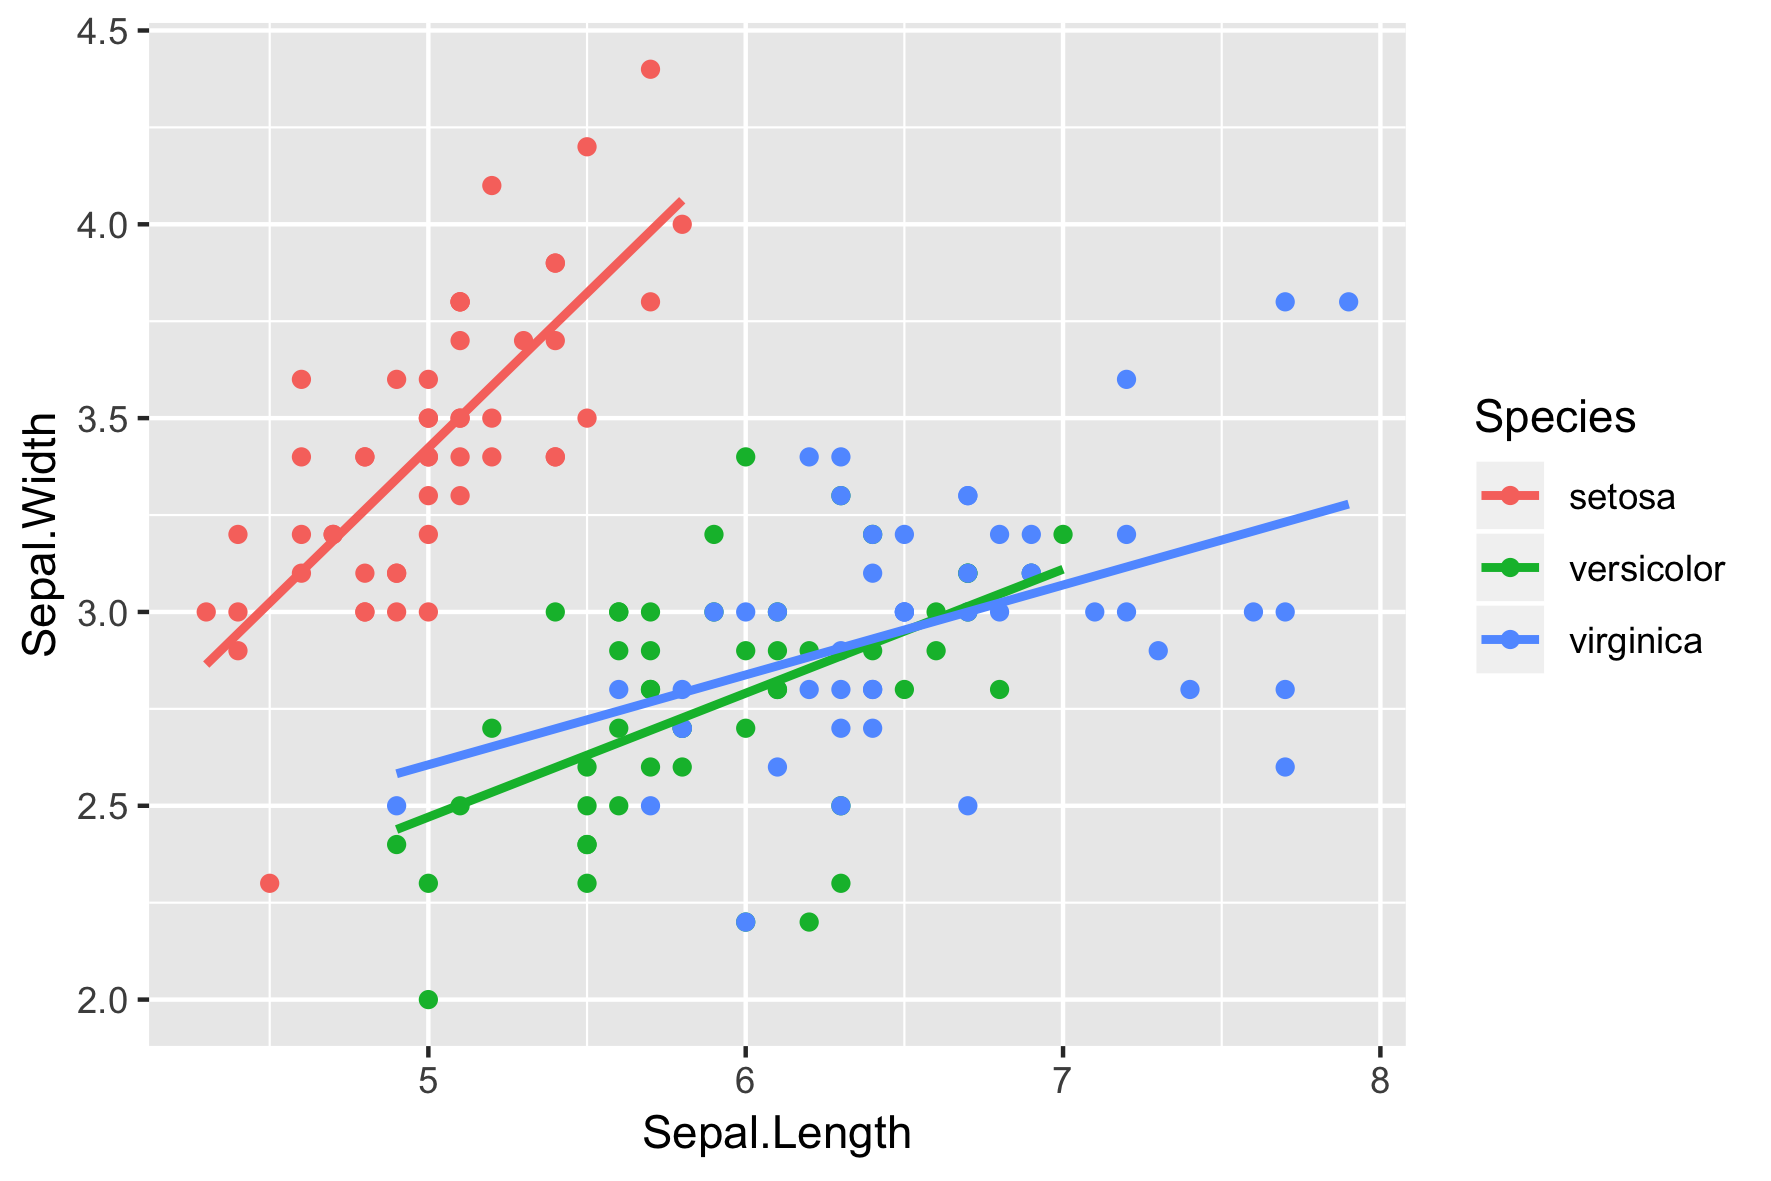
geom_smooth(method = "lm")
geom_smooth(fullrange = TRUE)