Échantillonnage de commodité

Échantillonnage en R

Richie Cotton

Data Evangelist at DataCamp

La prédiction électorale du Literary Digest
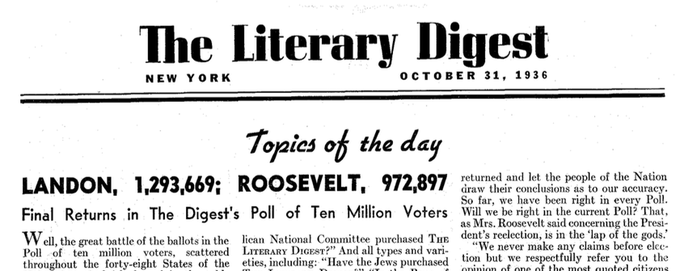
Une une du Literary Digest de 1936 annonçant des prédictions électorales. Landon devait obtenir 1,3 million de voix et Roosevelt un peu moins d'un million.

  • Prédiction : Landon 57 %; Roosevelt 43 %
  • Résultats réels : Landon 38 %; Roosevelt 62 %
  • Échantillon non représentatif de la population : biais d'échantillonnage.
  • Collecter des données par la méthode la plus simple s'appelle échantillonnage de commodité.
Échantillonnage en R

Trouver l'âge moyen des Français

Une photo de Disneyland Paris.

  • Interroger 10 personnes à Disneyland Paris.
  • Leur âge moyen est de 24,6 ans.
  • Est-ce une bonne estimation pour toute la France ?
1 Image par Sean MacEntee
Échantillonnage en R

Quelle précision pour cette enquête ?

Année Âge moyen en France
1975 31,6
1985 33,6
1995 36,2
2005 38,9
2015 41,2
  • 24,6 ans est une mauvaise estimation.
  • Les visiteurs de Disneyland ne représentent pas l'ensemble de la population.
Échantillonnage en R

Échantillonnage de commodité : notes de café

coffee_ratings %>% 
  summarize(mean_cup_points = mean(total_cup_points))
  mean_cup_points
1           82.09
coffee_ratings_first10 <- coffee_ratings %>% 
  slice_head(n = 10)
coffee_ratings_first10 %>% 
  summarize(mean_cup_points = mean(total_cup_points))
  mean_cup_points
1            89.1
Échantillonnage en R

Visualiser le biais de sélection

coffee_ratings %>%
  ggplot(aes(x = total_cup_points)) +
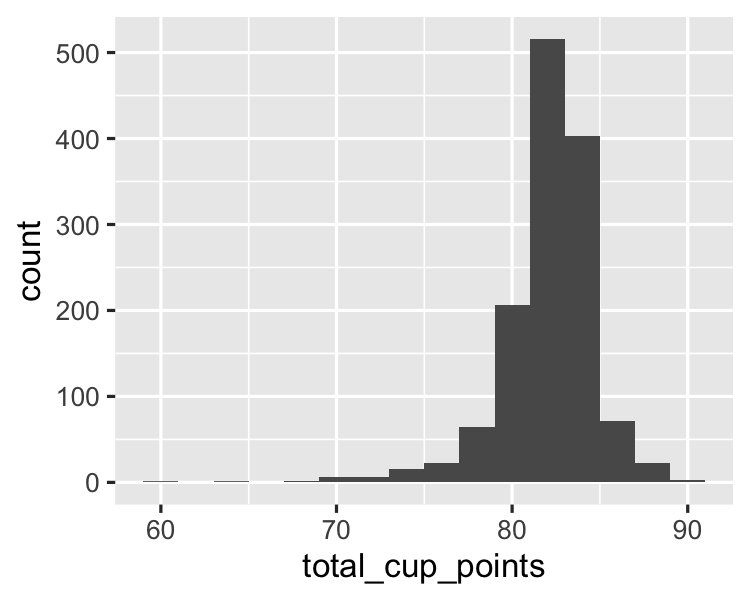
  geom_histogram(binwidth = 2)

Un histogramme des points de tasse pour la population.

coffee_ratings_first10 %>%
  ggplot(aes(x = total_cup_points)) +
  geom_histogram(binwidth = 2) +
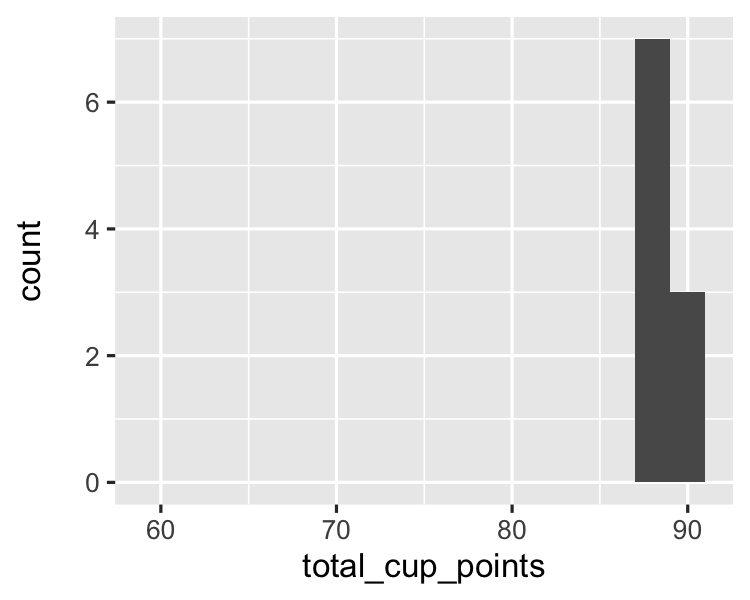
  xlim(59, 91)

Un histogramme des points de tasse pour l'échantillon.

Échantillonnage en R

Visualiser le biais de sélection 2

coffee_ratings %>%
  ggplot(aes(x = total_cup_points)) +
  geom_histogram(binwidth = 2) 

Un histogramme des points de tasse pour la population.

coffee_ratings %>%
  slice_sample(n = 10) %>% 
  ggplot(aes(x = total_cup_points)) +
  geom_histogram(binwidth = 2) +
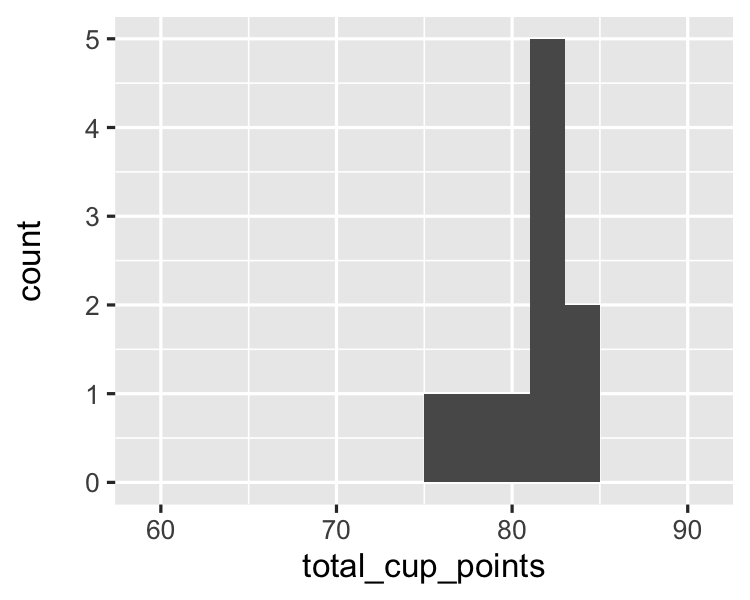
  xlim(59, 91)

Un histogramme des points de tasse pour un échantillon aléatoire.

Échantillonnage en R

Passons à la pratique !

Échantillonnage en R

Preparing Video For Download...