Formulation d'hypothèses et distributions

A/B Testing en Python

Moe Lotfy, PhD

Principal Data Science Manager

Définir des hypothèses

  • Une hypothèse est :

    • une affirmation expliquant un phénomène
    • un point de départ pour approfondir l'analyse
    • une idée à tester
  • Une hypothèse solide :

    • est testable, déclarative, concise et logique
    • permet une itération systématique
    • se généralise plus facilement et confirme la compréhension
    • aboutit à des recommandations concrètes et ciblées
A/B Testing en Python

Format d'hypothèse

  • Structure générale :

    • Sur la base de X, nous pensons que si nous faisons Y
    • Alors Z se produira
    • Mesuré par le(s) indicateur(s) M
  • Exemple d'hypothèse alternative :

    • Sur la base de recherches UX, nous pensons que si nous mettons à jour le design de la page de paiement
    • Alors le pourcentage de clients acheteurs augmentera
    • Mesuré par le taux d'achat
  • Hypothèse nulle : …le pourcentage de clients acheteurs ne changera pas…
A/B Testing en Python

Calculer des statistiques d'échantillon

# Calculate the number of users in groups A and B
n_A = checkout[checkout['checkout_page'] == 'A']['purchased'].count()
n_B = checkout[checkout['checkout_page'] == 'B']['purchased'].count()
print('Group A users:',n_A)
print('Group B users:',n_B)
Group A users: 3000
Group B users: 3000
# Calculate the mean purchase rates of groups A and B
p_A = checkout[checkout['checkout_page'] == 'A']['purchased'].mean()
p_B = checkout[checkout['checkout_page'] == 'B']['purchased'].mean()
print('Group A mean purchase rate:',p_A)
print('Group B mean purchase rate:',p_B)
Group A mean purchase rate: 0.820
Group B mean purchase rate: 0.847
A/B Testing en Python

Simuler et tracer des distributions

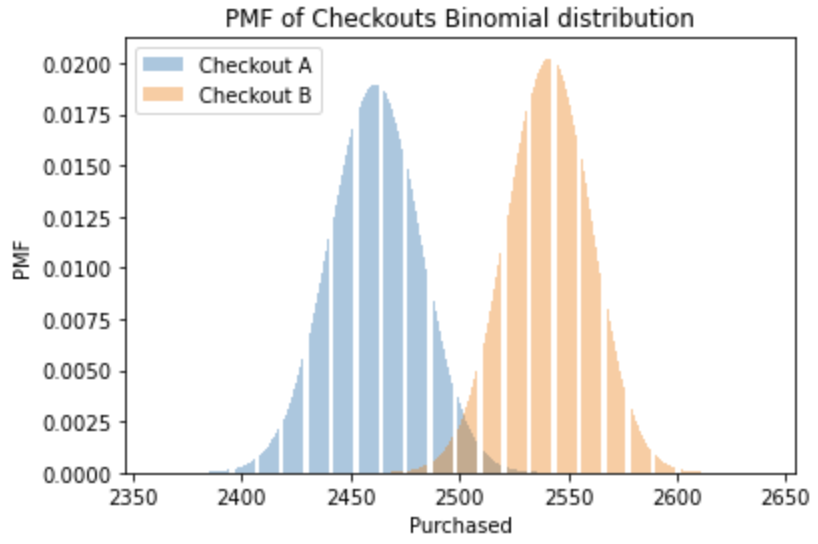
Le nombre d'acheteurs sur n essais avec une probabilité d'achat p suit une loi binomiale.

# Import binom from scipy library 
from scipy.stats import binom 
# Create x-axis range and Binomial distributions A and B
x = np.arange(n_A*p_A - 100, n_B*p_B + 100) 
binom_a = binom.pmf(x, n_A, p_A)
binom_b = binom.pmf(x, n_B, p_B) 
# Plot Binomial distributions A and B
plt.bar(x, binom_a, alpha=0.4, label='Checkout A')
plt.bar(x, binom_b, alpha=0.4, label='Checkout B')
plt.xlabel('Purchased')
plt.ylabel('PMF')
plt.title('PMF of Checkouts Binomial distribution')
plt.show()

Distribution binomiale des groupes de paiement A et B

A/B Testing en Python

Théorème central limite

Pour un échantillon suffisamment grand, la distribution des moyennes d'échantillon, p, sera

  • normale autour de la vraie moyenne de population
  • avec un écart type = erreur standard de la moyenne
  • quel que soit le profil de la distribution sous-jacente
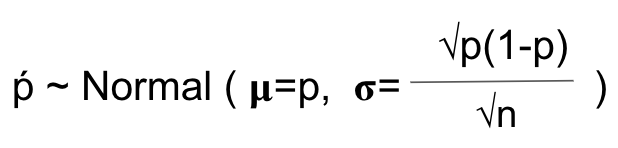
Formule du théorème central limite pour des proportions

A/B Testing en Python

Théorème central limite en Python

# Set random seed for repeatability 
np.random.seed(47)
# Create an empty list to hold means
sampled_means = []
# Create loop to simulate 1000 sample means
for i in range(1000):
    # Take a sample of n=100
    sample = checkout['purchased'].sample(100,replace=True)
    # Get the sample mean and append to list
    sample_mean = np.mean(sample)
    sampled_means.append(sample_mean)
# Plot distribution
sns.displot(sampled_means, kde=True)
plt.show()

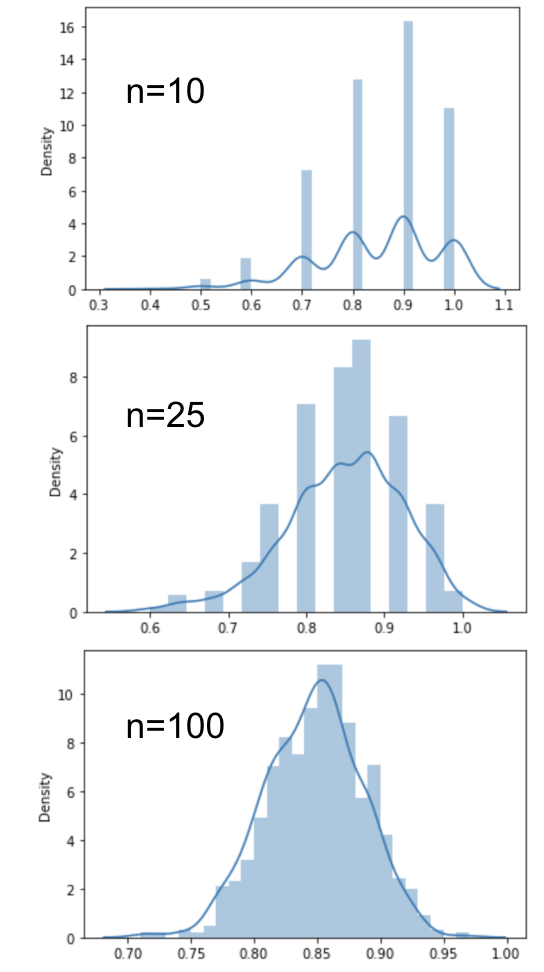
Démonstration Python du théorème central limite. La distribution tend vers une loi normale quand la taille d'échantillon augmente

A/B Testing en Python

Représentation mathématique d'une hypothèse
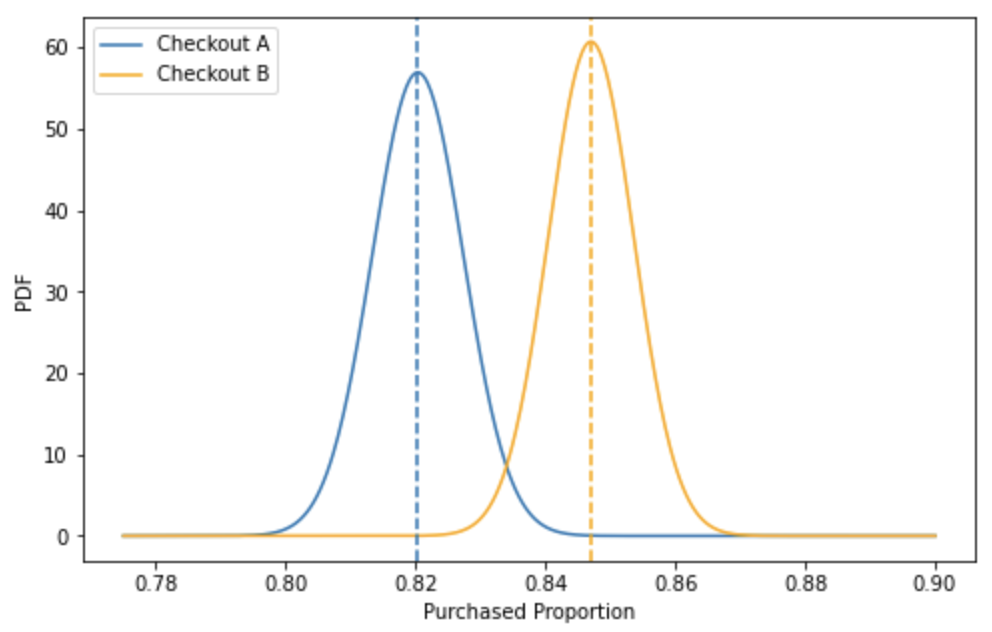
# Import norm from scipy library 
from scipy.stats import norm
# Create x-axis range and normal distributions A and B
x = np.linspace(0.775, 0.9, 500)
norm_a = norm.pdf(x, p_A, np.sqrt(p_A*(1-p_A) / n_A))
norm_b = norm.pdf(x, p_B, np.sqrt(p_B*(1-p_B) / n_B))
# Plot normal distributions A and B
sns.lineplot(x=x, y=norm_a, ax=ax, label='Checkout A')
sns.lineplot(x=x, y=norm_b, color='orange', \
             ax=ax, label= 'Checkout B')
ax.axvline(p_A, linestyle='--')
ax.axvline(p_B, linestyle='--')
plt.xlabel('Purchased Proportion')
plt.ylabel('PDF')
plt.legend(loc="upper left")
plt.show()

Graphiques de différence de moyennes des hypothèses nulle et alternative

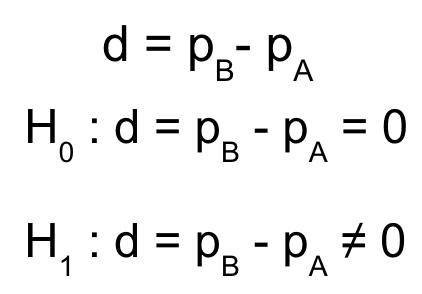
Formulation mathématique des hypothèses nulle et alternative

A/B Testing en Python

Passons à la pratique !

A/B Testing en Python

Preparing Video For Download...