Dash AG Grid interactivity

Créer des tableaux de bord avec Dash et Plotly

Alex Scriven

Data Scientist

Styling all AG Grid cells
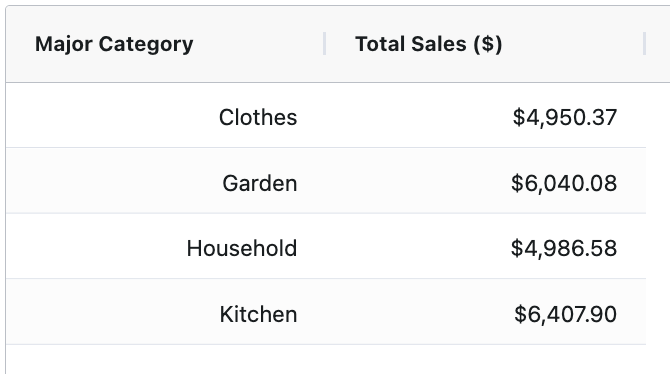
 

  • Can't use style
  • Use cellStyle instead ✅
grid = AgGrid(
defaultColDef={
    "cellStyle": 
    {"textAlign": "right"}}
)


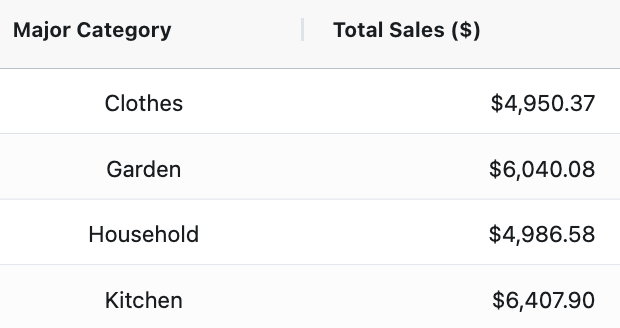
The first two columns of the table from the previous lesson. It has the headers "Major Category" and "Total Sales ($)" with four rows of data. All the data in the cells is aligned to the right.

Créer des tableaux de bord avec Dash et Plotly

Styling some AG Grid cells


column_defs = [
{"field": "Major Category"
, "cellStyle": {"textAlign": "center"}},
{"field": "Total Sales ($)"
, "valueFormatter": money_fmt
, "cellStyle": {"textAlign": "right"}}
]


This is the same table as the previous slide; however, the first column of "Major Category" has text center aligned and the second column "Total Sales ($)" has text right aligned.

Créer des tableaux de bord avec Dash et Plotly

More styling examples


  • Use other CSS for styling ✨
grid = AgGrid(
# Other setup
defaultColDef={
"cellStyle": {
  "backgroundColor": "black",
   "color": "white"}
})


$$

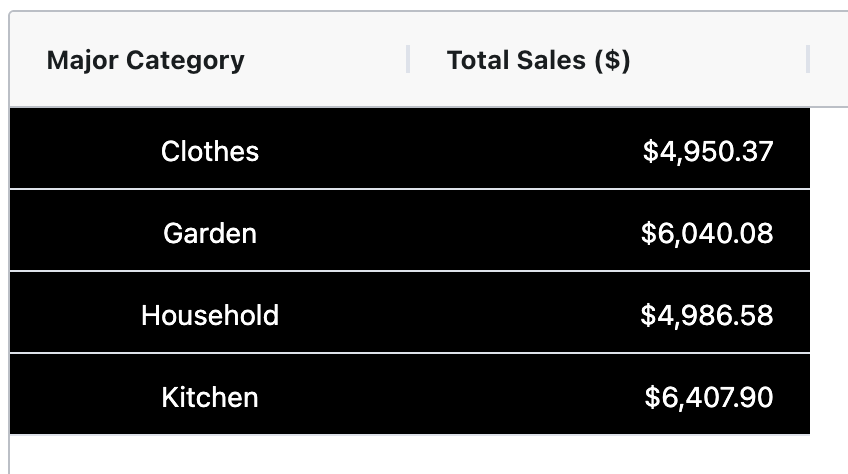
This is the same table as the previous slide; however the cells have a black background color and white text

Créer des tableaux de bord avec Dash et Plotly

Selecting cells

$$

  • Use the cellClicked property
  • Callback to print the clicked-cell information
@callback(
    Output("test_text", "children"),
    Input("my_grid", "cellClicked")
)
def show_cell_info(cell_data):
    return str(cell_data)


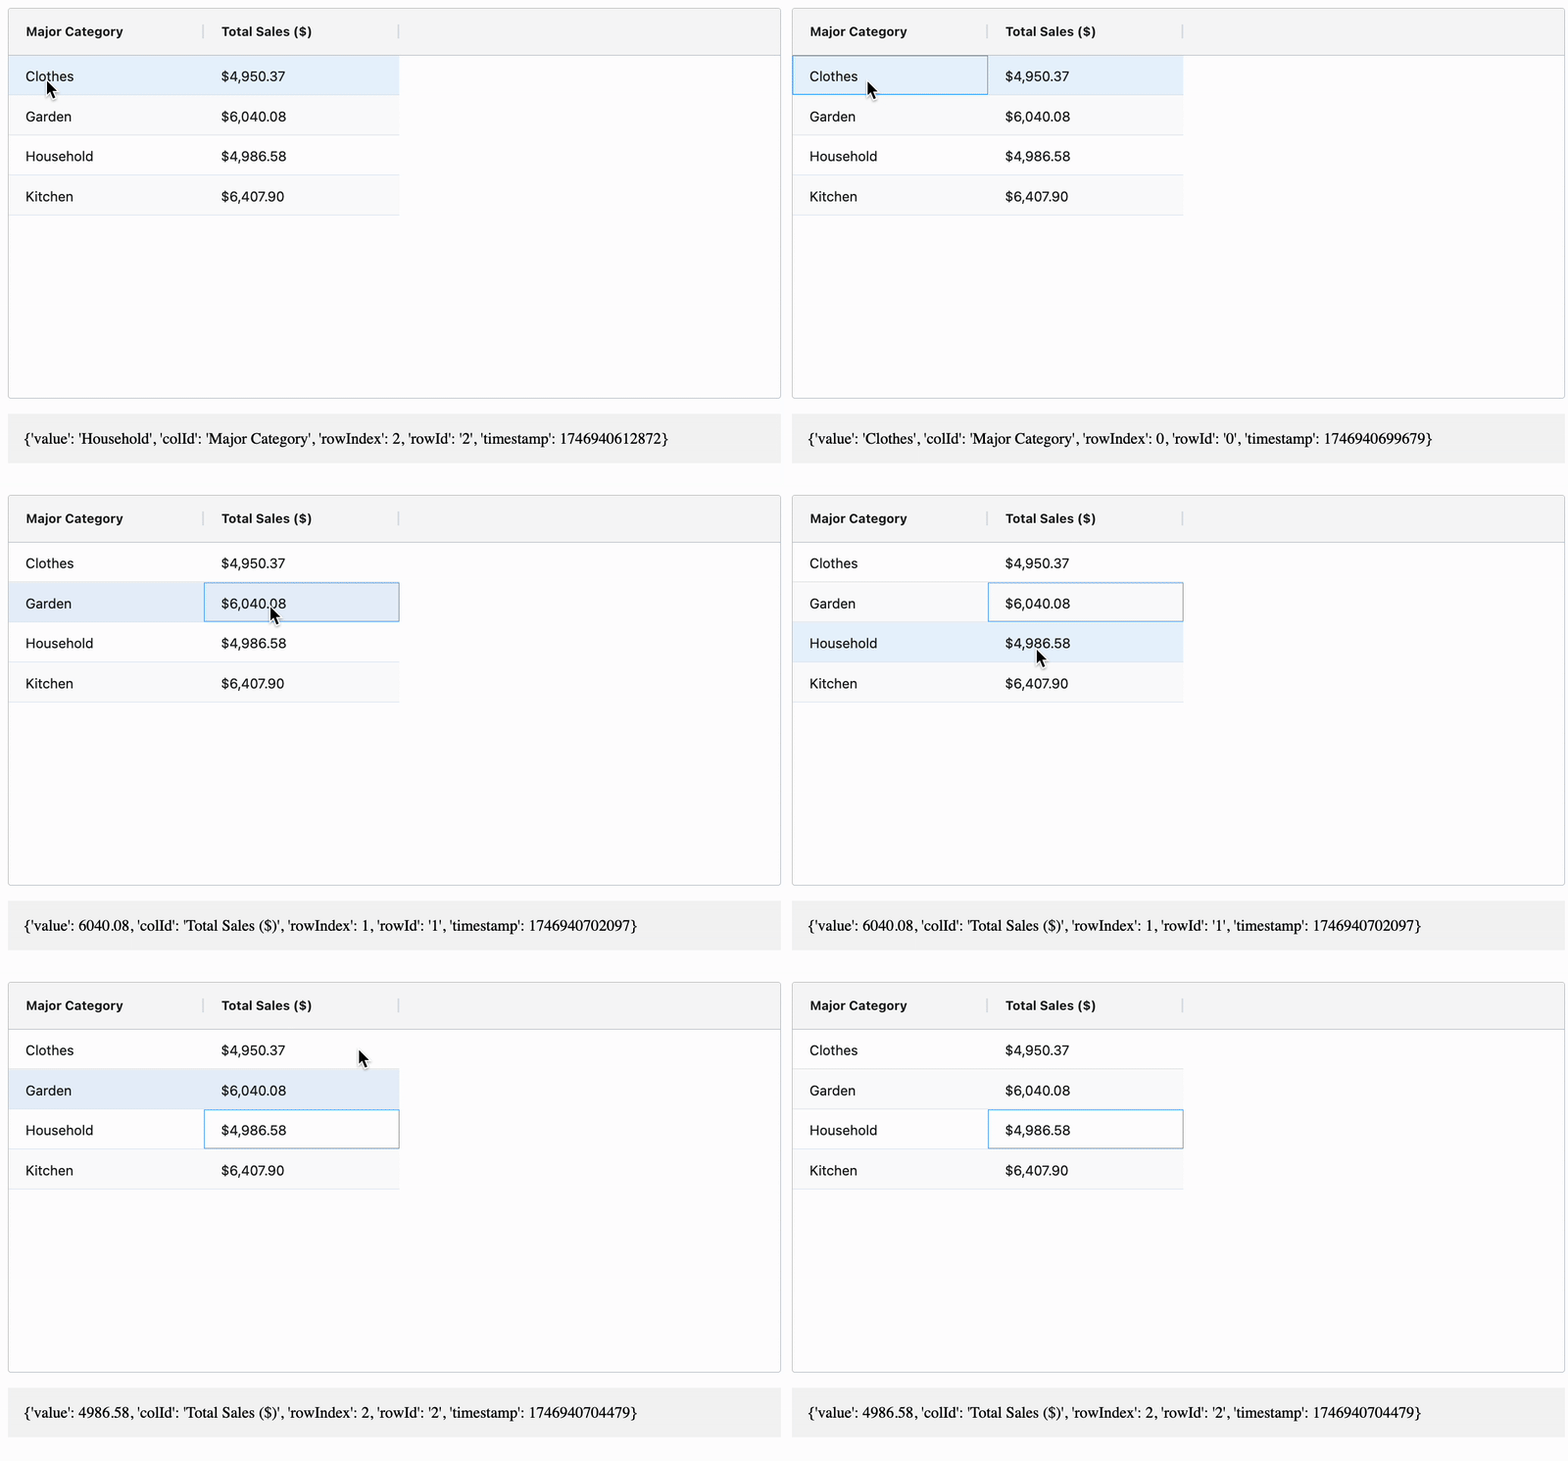
A gif of the same table that has been present in the slideshow so far. Below the table is a dictionary that updates with the details of a cell once clicked.

Créer des tableaux de bord avec Dash et Plotly

Selecting rows

  • Set rowSelection to "single" or "multiple"
grid = AgGrid(
# Other parts
dashGridOptions={
"rowSelection": "single"}
)

@callback( Output("test_text", "children"), Input("my_grid", "selectedRows") )


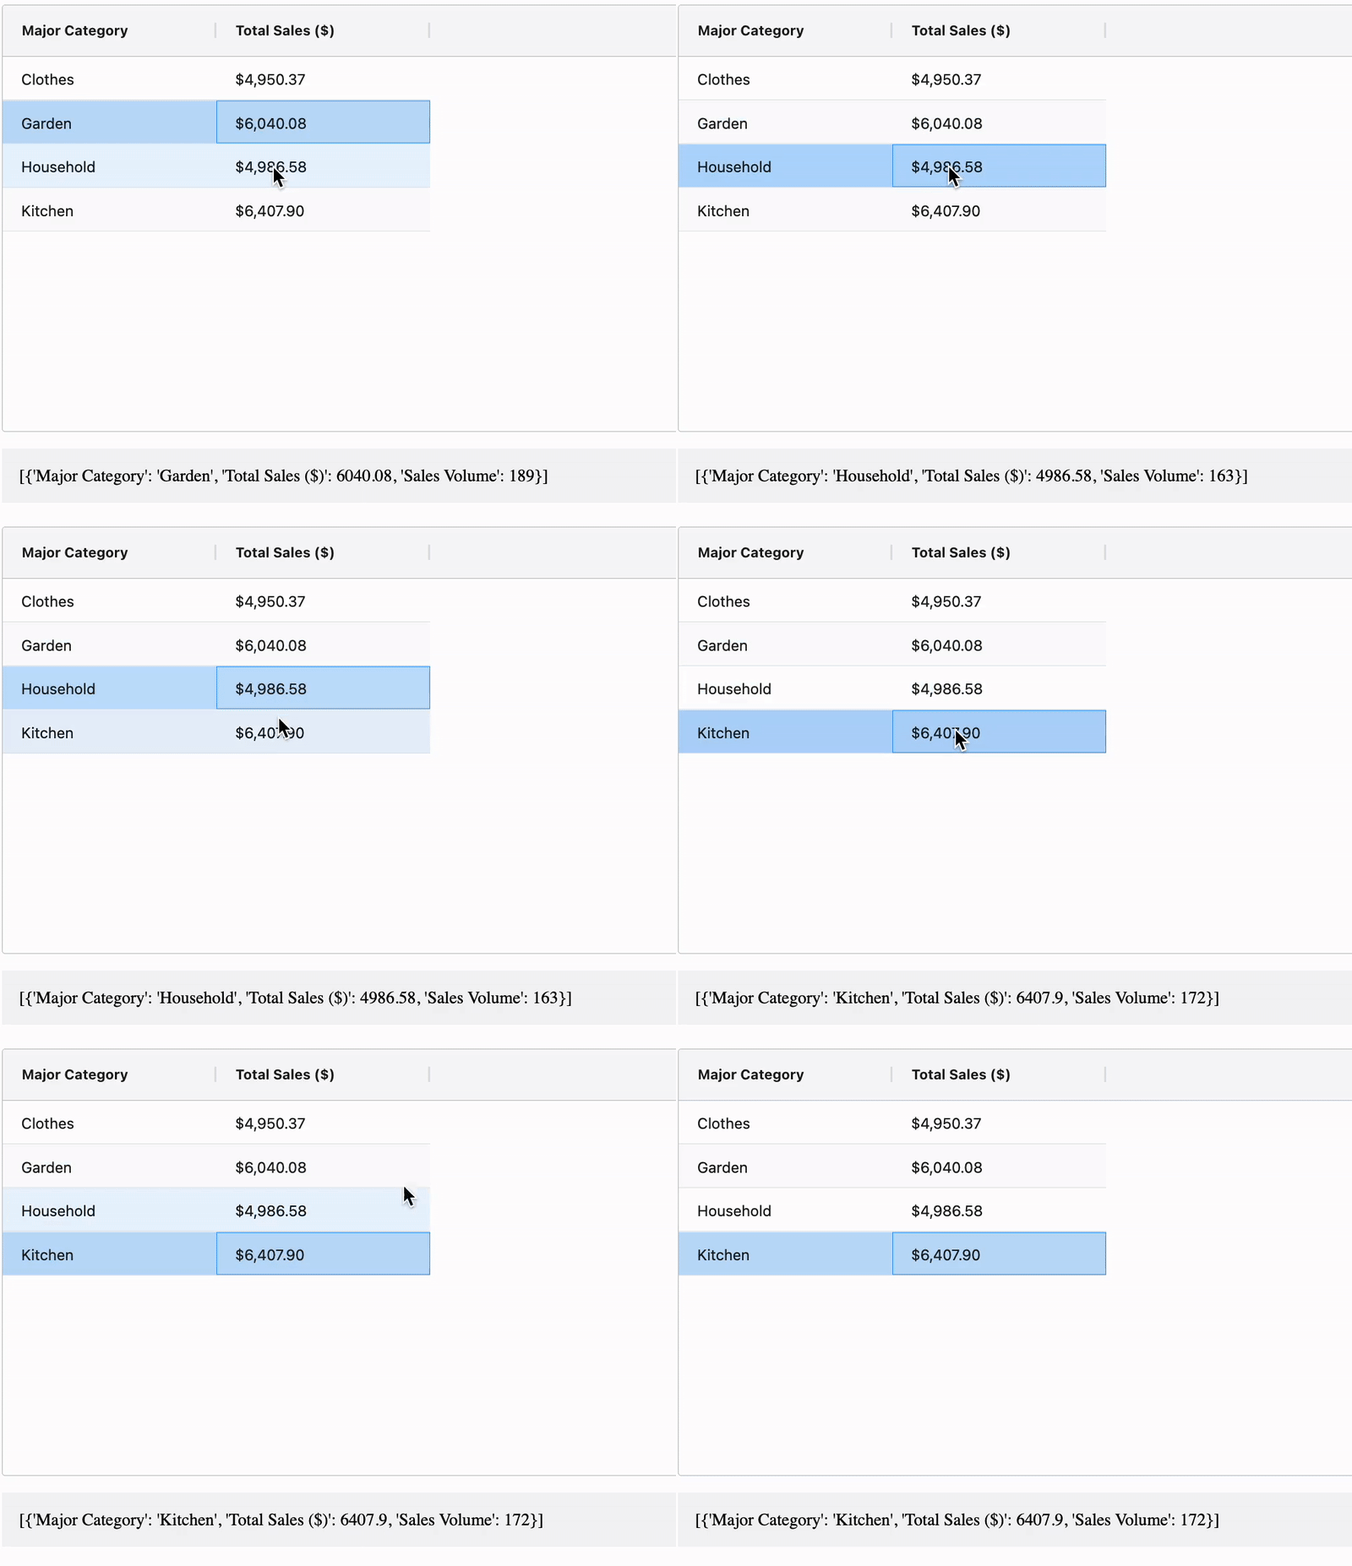
A gif of the same table that has been present in the slideshow so far. Below the table is a grey text area that updates with a dictionary of an entire row when selected

Créer des tableaux de bord avec Dash et Plotly

Let's practice!

Créer des tableaux de bord avec Dash et Plotly

Preparing Video For Download...