HTML in Dash

Créer des tableaux de bord avec Dash et Plotly

Alex Scriven

Data Scientist

HTML Revisited


  • HTML = language for structuring web content
    • Uses 'tags' like Div, H1>H6
  • Dash uses dash.html components
    • H1 tag is .H1()
    • Div tag is .Div()
<div>
  <div style=
       "background-color: red; 
        width:250; height:250;">
  </div>
  <div style=
       "background-color: lightblue; 
        width:250; height:250;">
    <h1>This box</h1>
  </div>
</div>
Créer des tableaux de bord avec Dash et Plotly

Structuring tags


  • List of available HTML tags - documentation
  • Important structuring tags:
    • .Br() = New line break
    • .Img() = Insert an image
Créer des tableaux de bord avec Dash et Plotly

Lists in HTML Dash


  • .Ul() \ .Ol() & .Li() = Create lists
    • .Ul() for unordered list (bullet-points, like these!)
    • .Ol() for ordered list (numbered-points)
    • .Li() for each list element
Créer des tableaux de bord avec Dash et Plotly

Inserting a company logo


app.layout = [

html.Img(src='www.website.com/logo.png'), html.H1("Our Sales Dashboard")
]


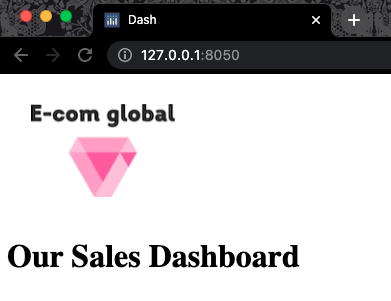
A screenshot of the top left of a chrome browser where the URL has the server address in it. The browser has an image of a company logo, a ping diamond that notes E-com global. Below this is a title noting 'Our Sales Dashboard'

Créer des tableaux de bord avec Dash et Plotly

Text tags


Set and format text content

  • .P() or .Span() = Insert plain text
    • Accept a children argument (list of text, .P() or .Span())
  • .B() = Bold some text
  • .I() = Italicize some text
Créer des tableaux de bord avec Dash et Plotly

HTML text tags in Dash


Some complex formatting:

app.layout = [
   html.H1("Our Sales Dashboard"),

html.Span(children=[
f"Prepared: {datetime.now().date()}",
" by ", html.B("Jessie Parker, "),
html.I("Data Scientist")
])
]


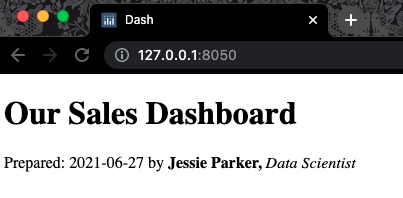
A screenshot of the top left of a chrome window where the server address is visible in the URL bar. There is a large title noting 'our sales dashboard', below this is a line noting "Prepared: 2021-06-27 by Jessie Parker, data scientist" Jessie Parker, is in bold and data scientist is in italics

Créer des tableaux de bord avec Dash et Plotly

Breaking up the text

$$

app.layout = [
   html.H1("Our Sales Dashboard"),
   html.Span(children=[
   f"Prepared: {datetime.now().date()}", 
   html.Br(),
   " by ", html.B("Jessie Parker, "),
   html.Br(),
   html.I("Data Scientist")])
    ]

 

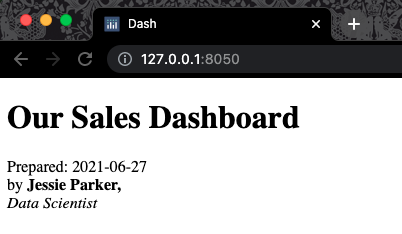
A screenshot of the same dashboard as the last slide. A screenshot of the top left of a chrome window where the server address is visible in the URL bar. There is a large title noting 'our sales dashboard'; below this is a line noting "Prepared: 2021-06-27 by Jessie Parker, data scientist" Jessie Parker is in bold, and data scientist is in italics. However, there are now line breaks after the date and the name.

Créer des tableaux de bord avec Dash et Plotly

Let's practice!

Créer des tableaux de bord avec Dash et Plotly

Preparing Video For Download...