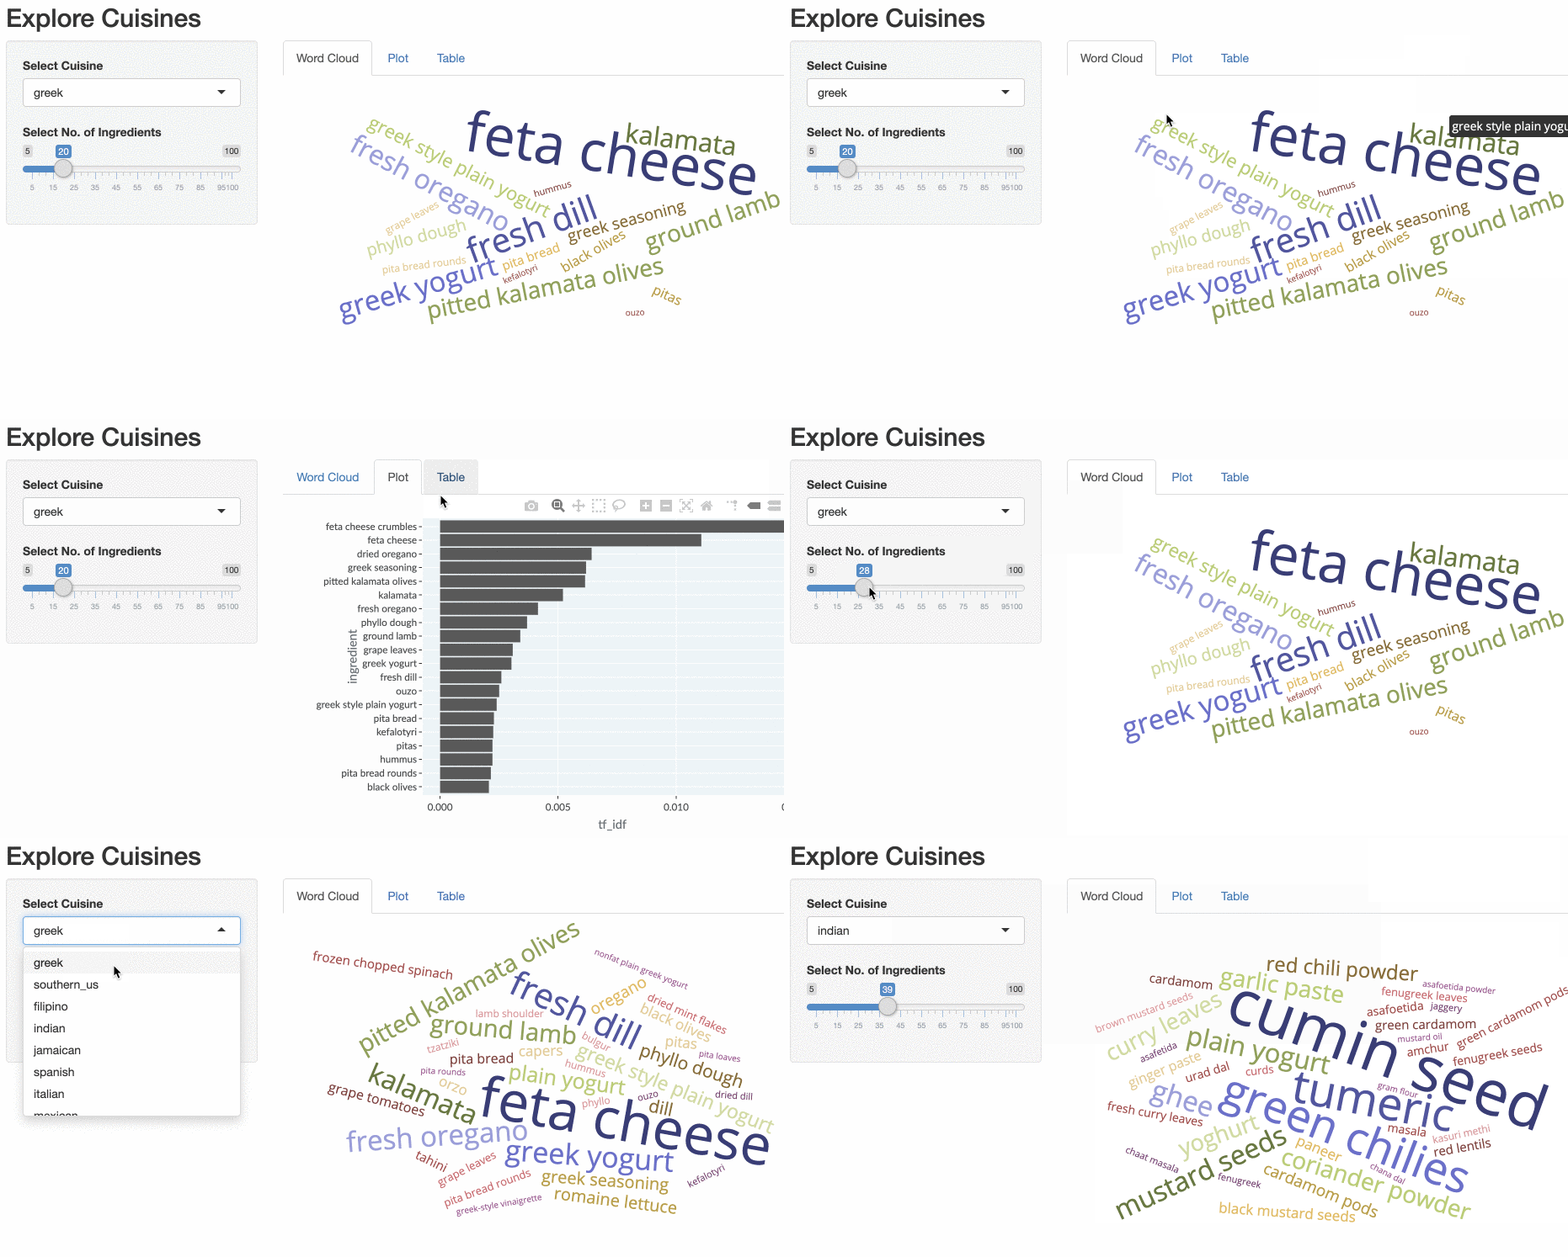
Explorer les cuisines

Créer des applications web avec Shiny en R

Ramnath Vaidyanathan

VP of Product Research

Explorer les données
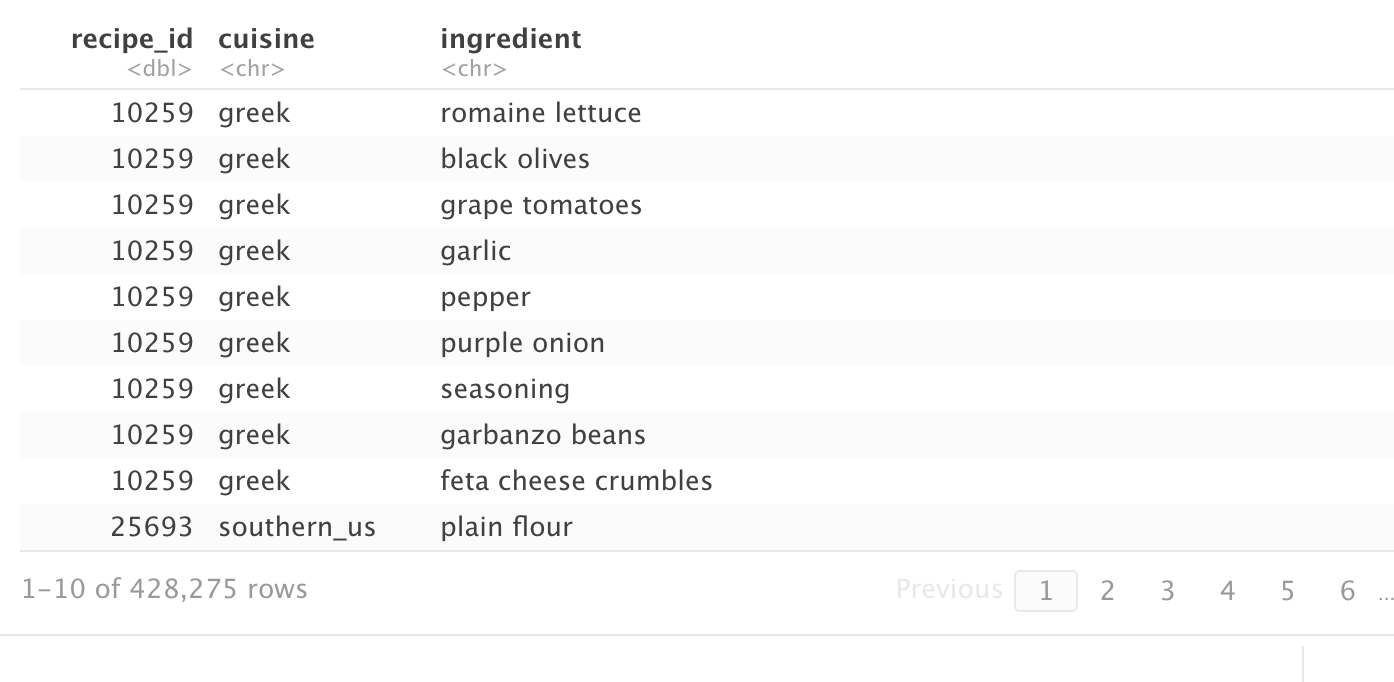
Un tableau affichant les 10 premières lignes du jeu de données des cuisines

Créer des applications web avec Shiny en R

explore-cuisine-app-gif.gif

Créer des applications web avec Shiny en R
ui <- fluidPage(
  titlePanel('Explore Cuisines'),
  sidebarLayout(
    sidebarPanel(

selectInput('cuisine', 'Select Cuisine', unique(recipes$cuisine)),
sliderInput('nb_ingredients', 'Select No. of Ingredients', 5, 100, 20),
), mainPanel( tabsetPanel(
tabPanel('Word Cloud', d3wordcloudOutput('wc_ingredients')),
tabPanel('Plot', plotly::plotlyOutput('plot_top_ingredients')),
tabPanel('Table', DT::DTOutput('dt_top_ingredients'))
) ) ) )
Créer des applications web avec Shiny en R

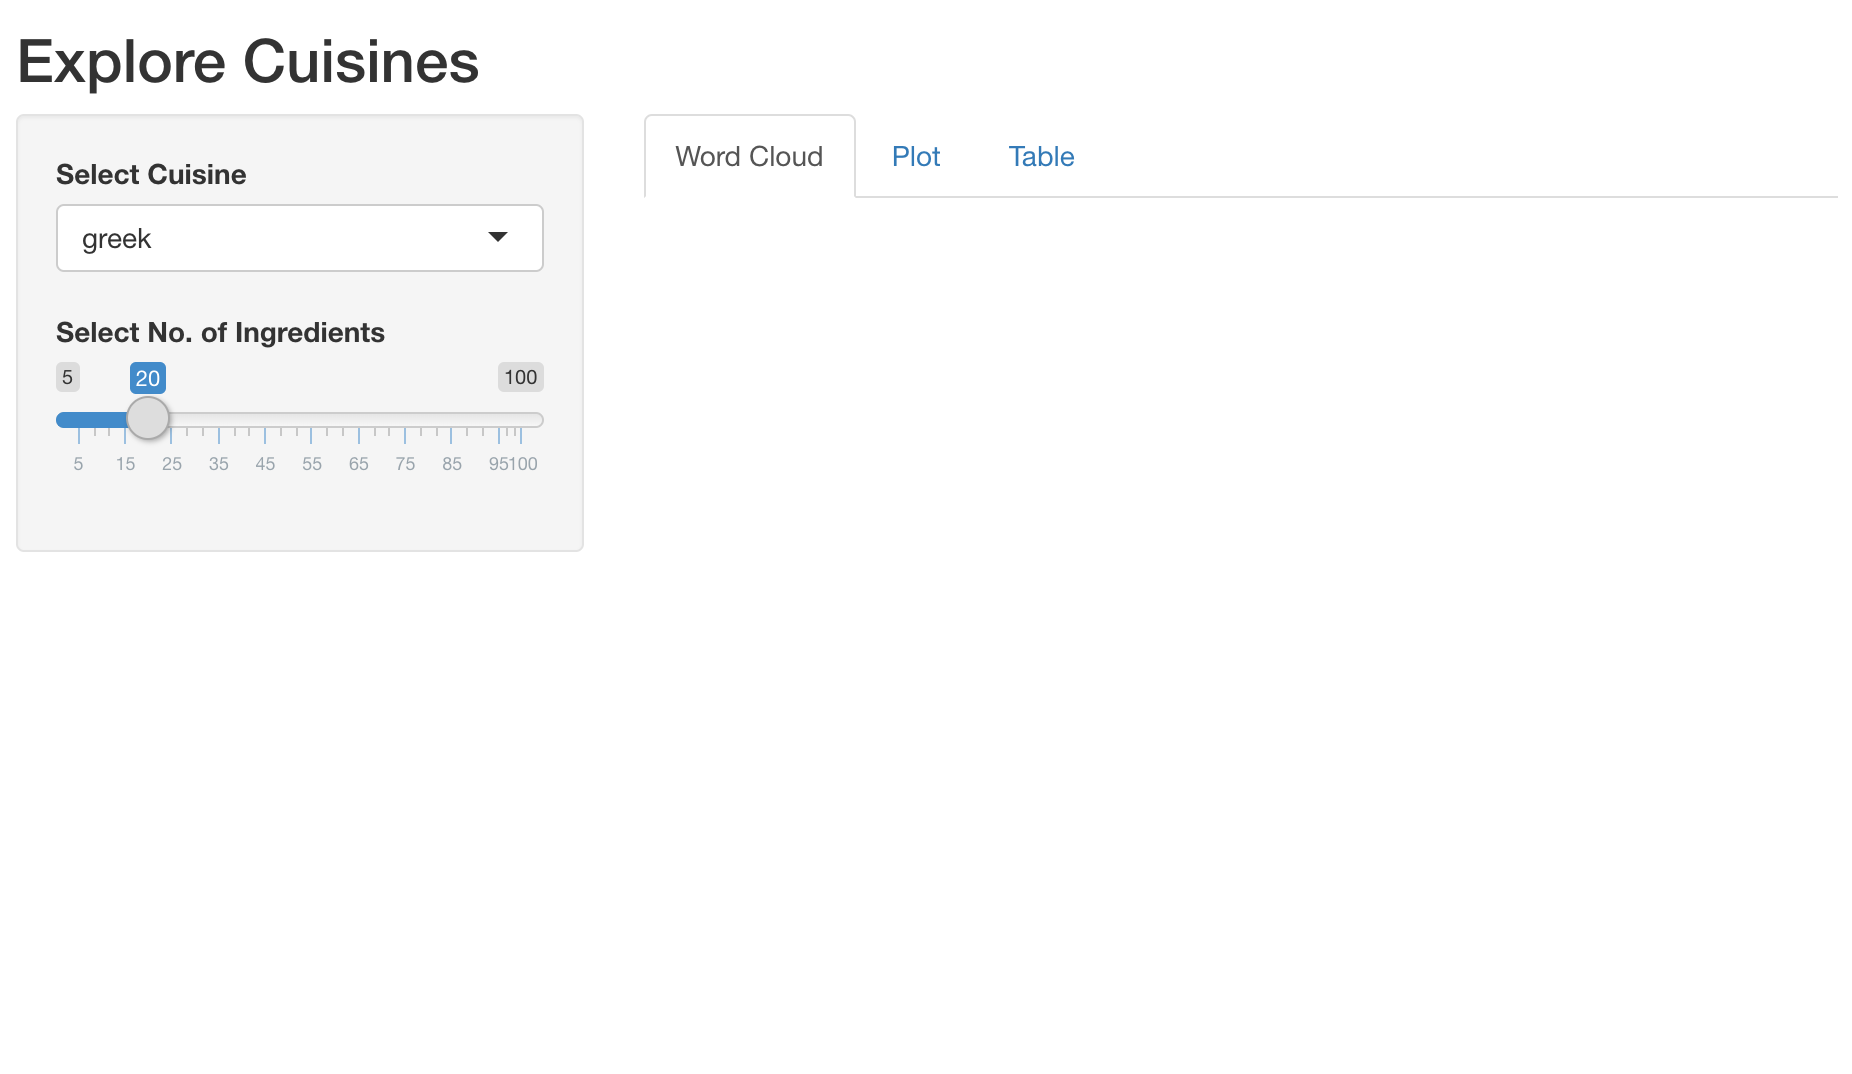
Une appli avec une liste déroulante pour choisir la cuisine et un curseur pour le nombre d'ingrédients, ainsi que des onglets pour les résultats

Créer des applications web avec Shiny en R

Ajouter une sortie : tableau interactif

output$dt_top_ingredients <- DT::renderDT({

recipes %>%
filter(cuisine == input$cuisine) %>%
count(ingredient, name = 'nb_recipes') %>%
arrange(desc(nb_recipes)) %>%
head(input$nb_ingredients)
})
Créer des applications web avec Shiny en R

Calculer le TFIDF

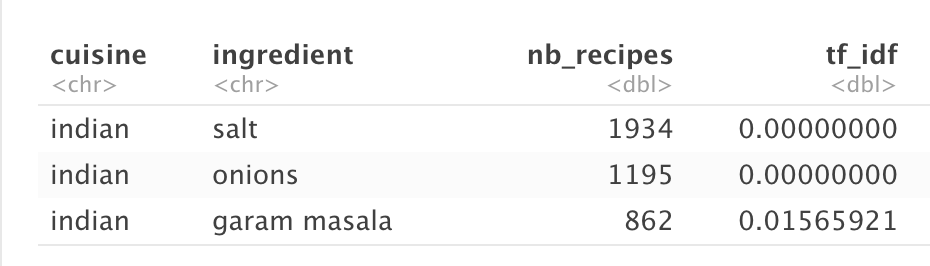
Un tableau affichant les 3 principaux ingrédients de la cuisine indienne, selon le nombre de recettes où ils sont utilisés

recipes_enriched <- recipes %>%

count(cuisine, ingredient, name = 'nb_recipes') %>%
tidytext::bind_tf_idf(ingredient, cuisine, nb_recipes)
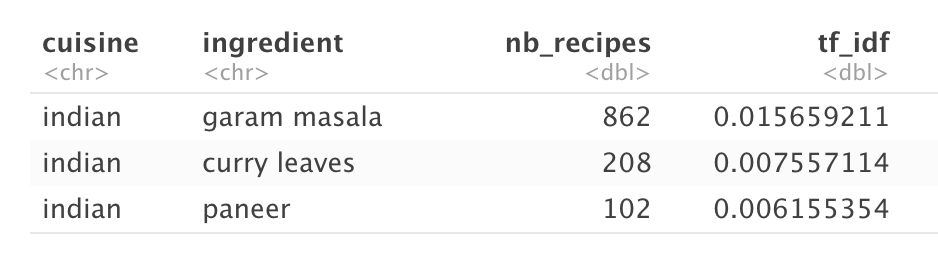
Un tableau affichant les 3 principaux ingrédients de la cuisine indienne, selon le TFIDF

Créer des applications web avec Shiny en R

Ajouter une expression réactive

  rval_top_ingredients <- reactive({

recipes_enriched %>%
filter(cuisine == input$cuisine) %>%
arrange(desc(tf_idf)) %>%
head(input$nb_ingredients) %>%
mutate(ingredient = forcats::fct_reorder(ingredient, tf_idf))
})
Créer des applications web avec Shiny en R

Ajouter des sorties : graphique interactif et nuage de mots

output$plot_top_ingredients <- plotly::renderPlotly({
  rval_top_ingredients() %>%
    ggplot(aes(x = ingredient, y = tf_idf)) +
    geom_col() +
    coord_flip()
})
output$wc_ingredients <- d3wordcloud::renderD3wordcloud({
  d <- rval_top_ingredients()
  d3wordcloud(d$ingredient, d$nb_recipes, tooltip = TRUE)
})
Créer des applications web avec Shiny en R

explore-cuisine-app-gif.gif

Créer des applications web avec Shiny en R

Passons à la pratique !

Créer des applications web avec Shiny en R

Preparing Video For Download...