Créer des applications

Créer des applications web avec Shiny en R

Kaelen Medeiros

Data Scientist

Explorer l'espérance de vie vs. le PIB par habitant
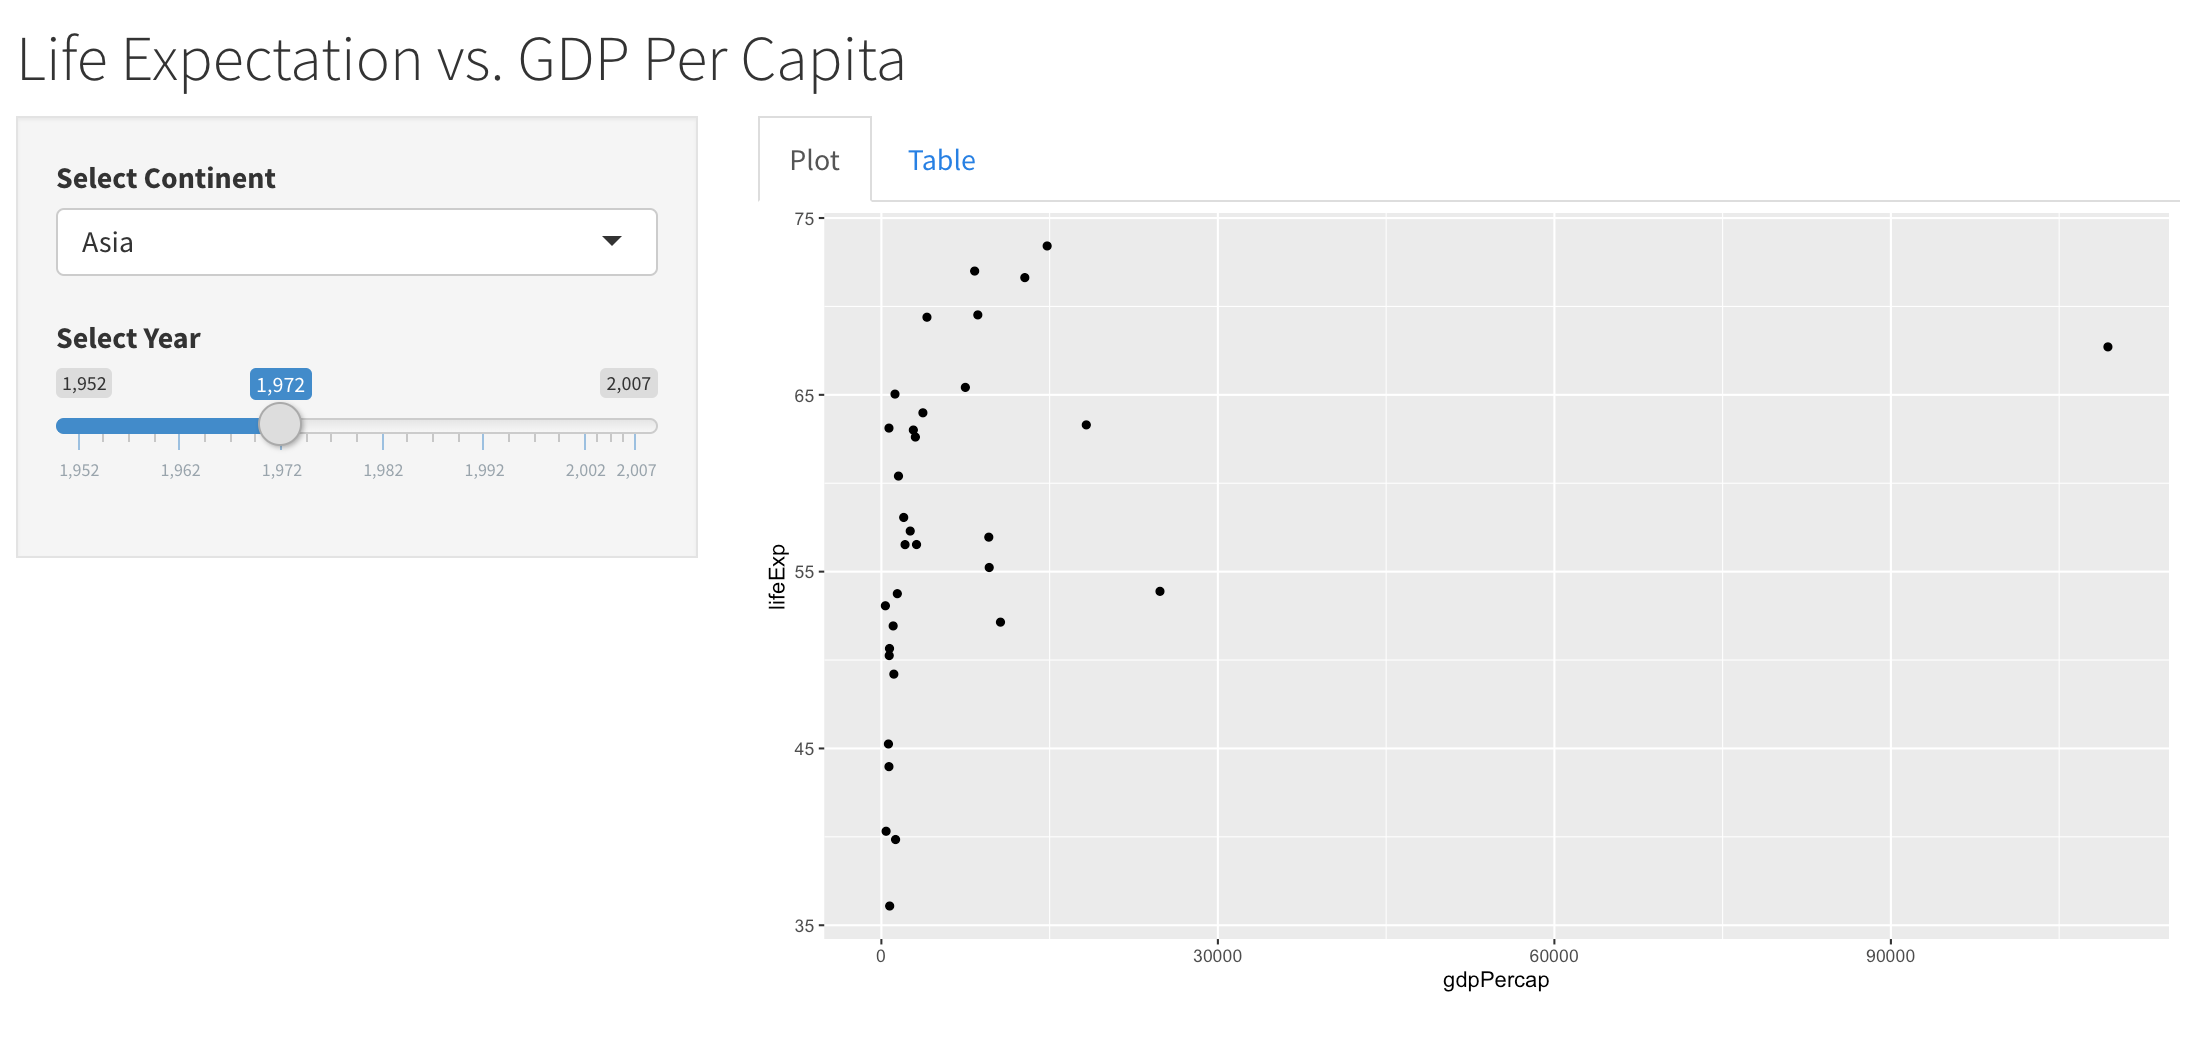
Une application affichant un nuage de points interactif de l'espérance de vie vs. le PIB par habitant pour un continent et une année choisis
Créer des applications web avec Shiny en R

Explorer l'espérance de vie vs. le PIB par habitant
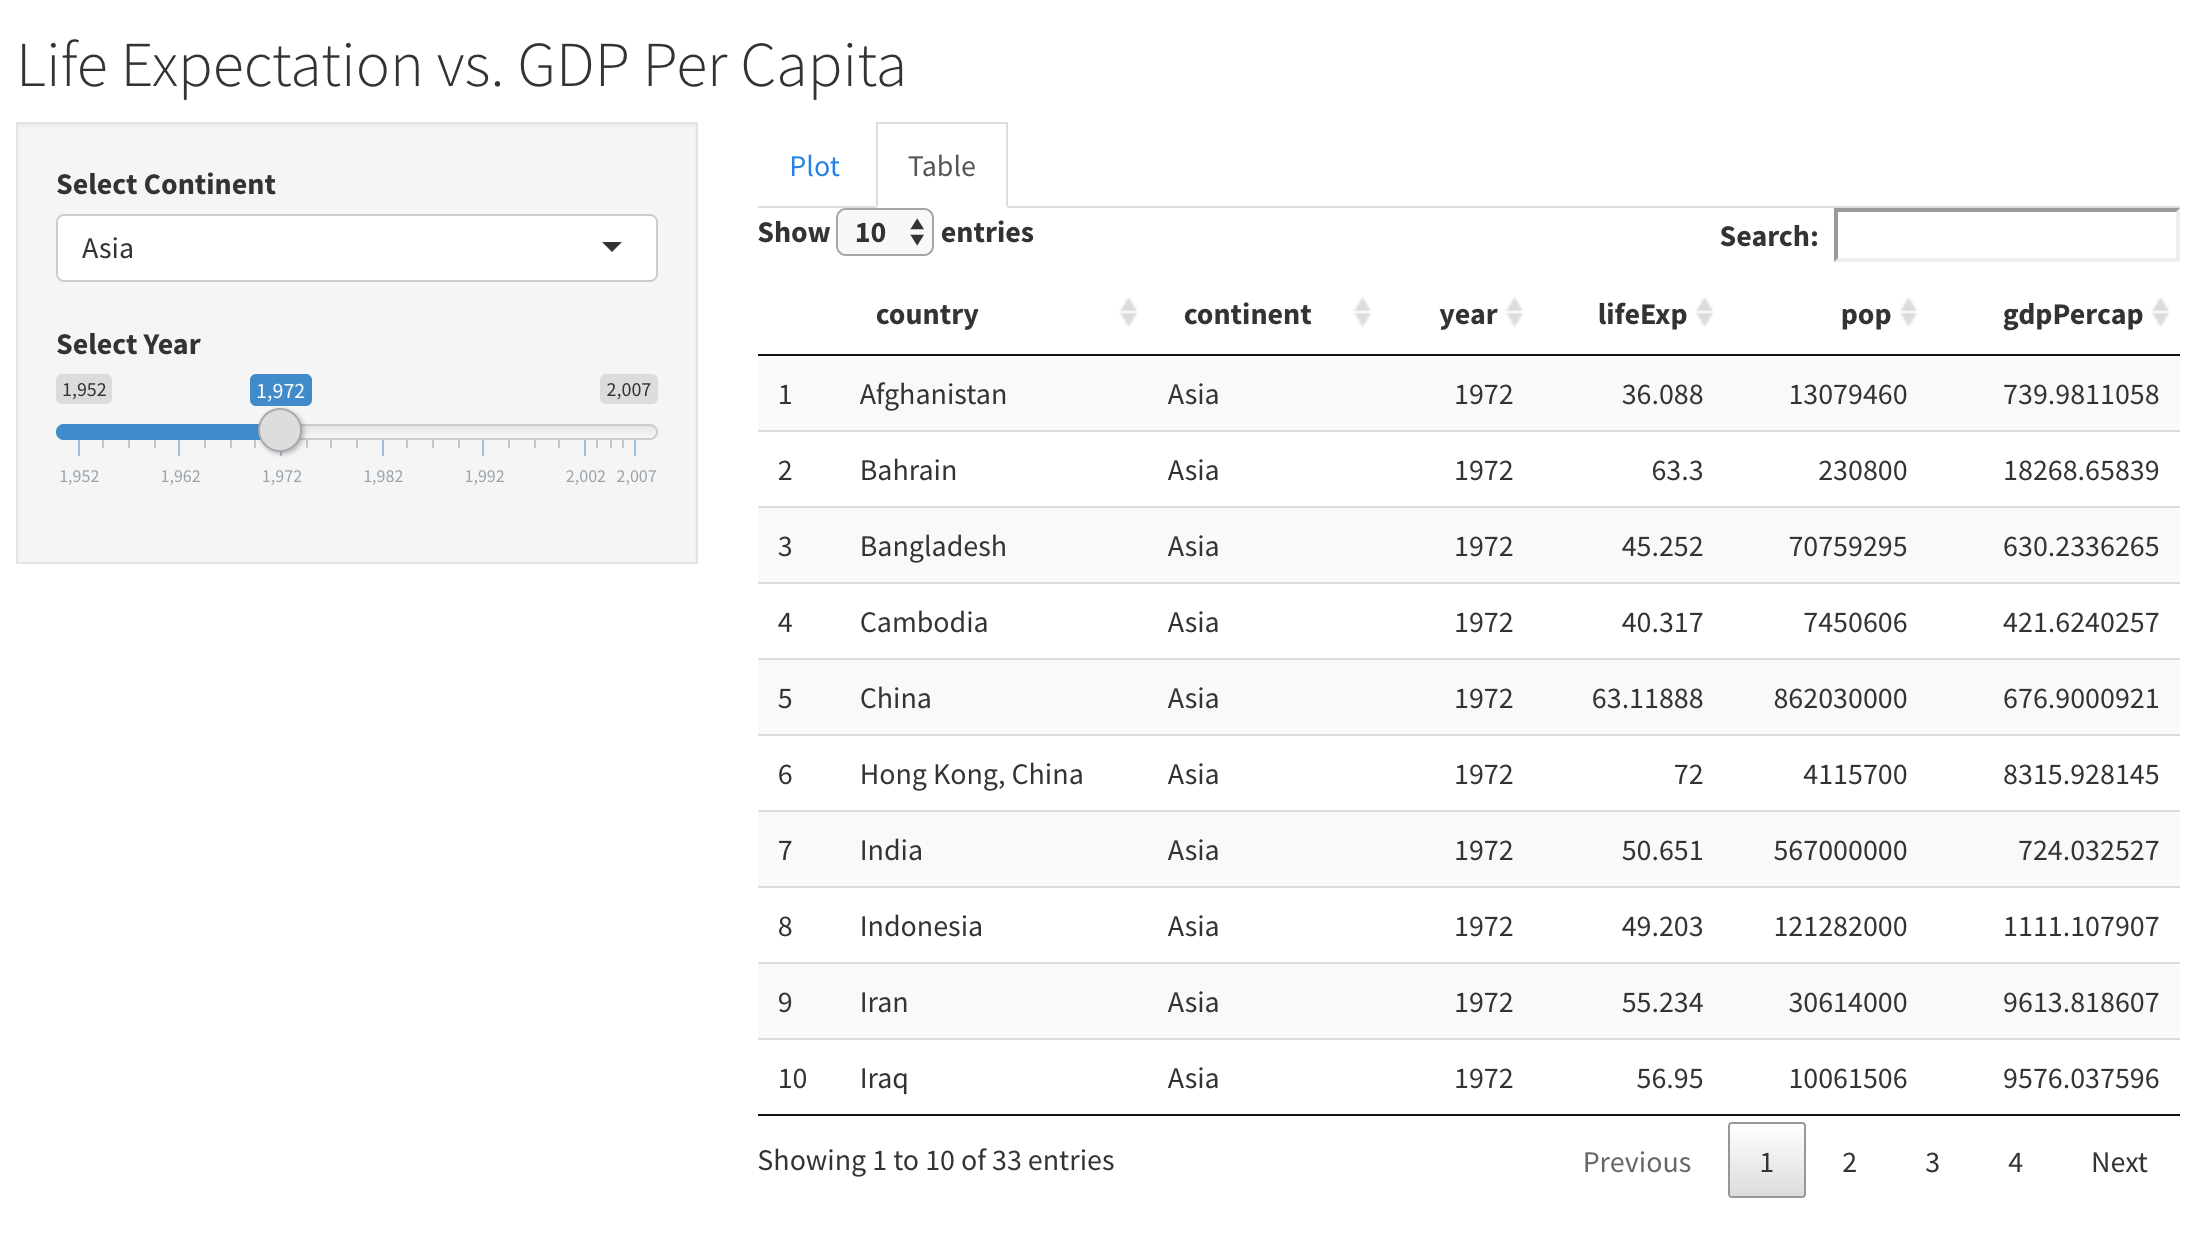
Une application affichant un tableau interactif de l'espérance de vie, de la population et du PIB par habitant pour un continent et une année choisis

Créer des applications web avec Shiny en R

Créer des apps Shiny : 4 étapes

  1. Ajouter des entrées (UI)
  2. Ajouter des sorties (UI/Server)
  3. Mettre à jour la mise en page (UI)
  4. Mettre à jour les sorties (Server)
Créer des applications web avec Shiny en R

Étape 1 : ajouter des entrées (UI)

ui <- fluidPage(
  titlePanel("Life Expectation vs. GDP Per Capita"),

selectInput('continent', 'Select Continent', unique(gapminder$continent)),
sliderInput('year', 'Select Year', 1952, 2007, 1990, step = 5) )
server <- function(input, output, session){ } shinyApp(ui = ui, server = server)
Créer des applications web avec Shiny en R

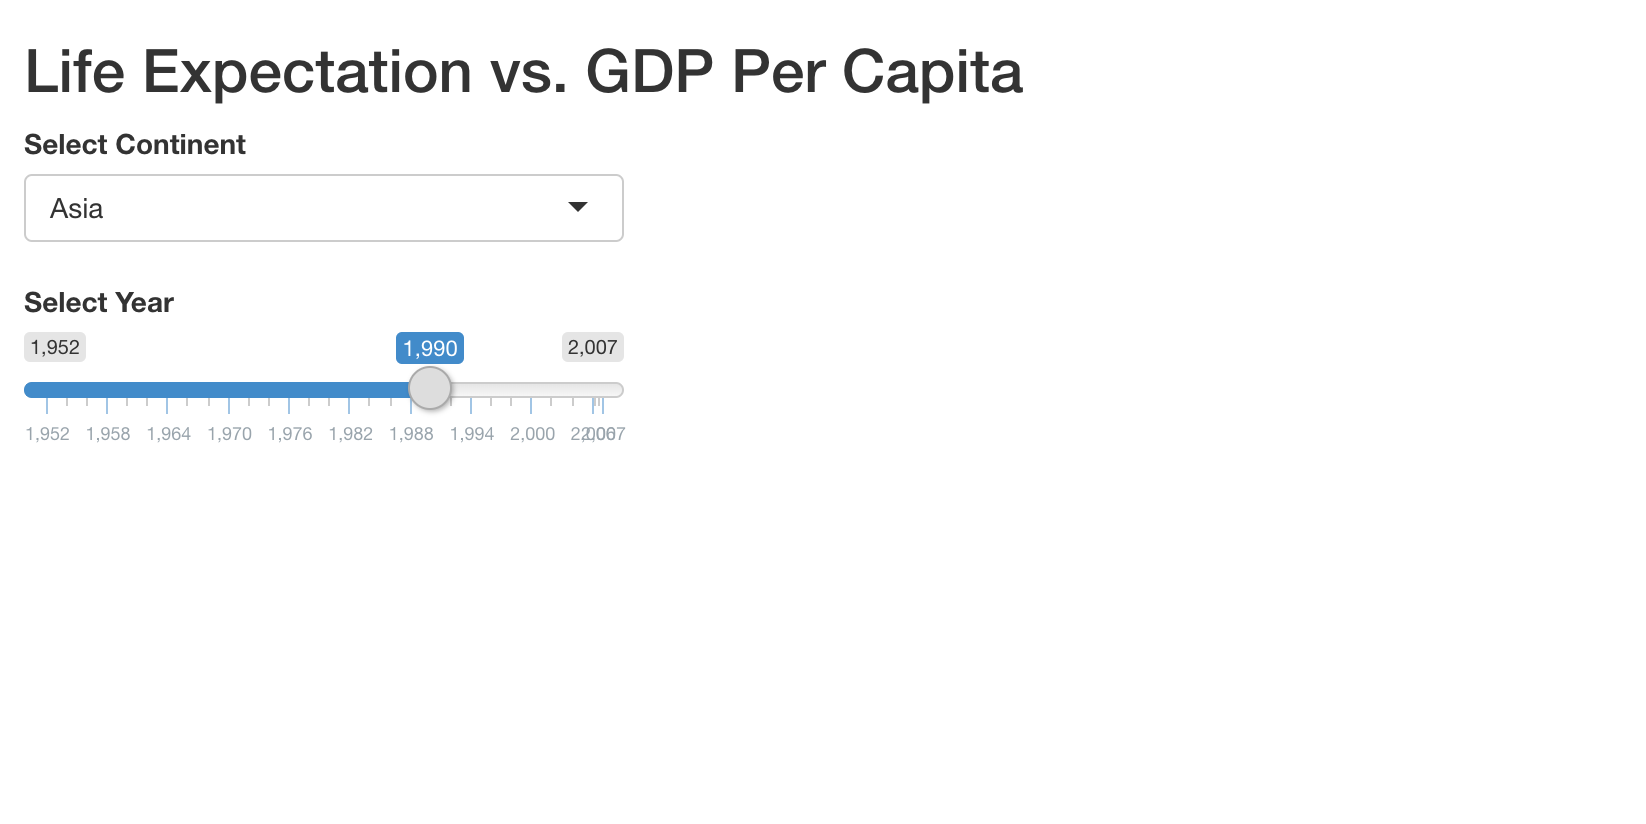
Une application affichant des contrôles pour choisir un continent et une année

Créer des applications web avec Shiny en R

Étape 2 : ajouter des sorties (UI)

ui <- fluidPage(
  titlePanel("Life Expectation vs. GDP Per Capita"),
  selectInput('continent', 'Select Continent', unique(gapminder$continent)),
  sliderInput('year', 'Select Year', 1952, 2007, 1990, step = 5),

plotOutput('plot'), DT::DTOutput('table')
)
Créer des applications web avec Shiny en R

Étape 2 : ajouter des sorties (Server)

server <- function(input, output, session){

output$plot <- renderPlot({ ggplot() })
output$table <- DT::renderDT({ gapminder })
}
Créer des applications web avec Shiny en R

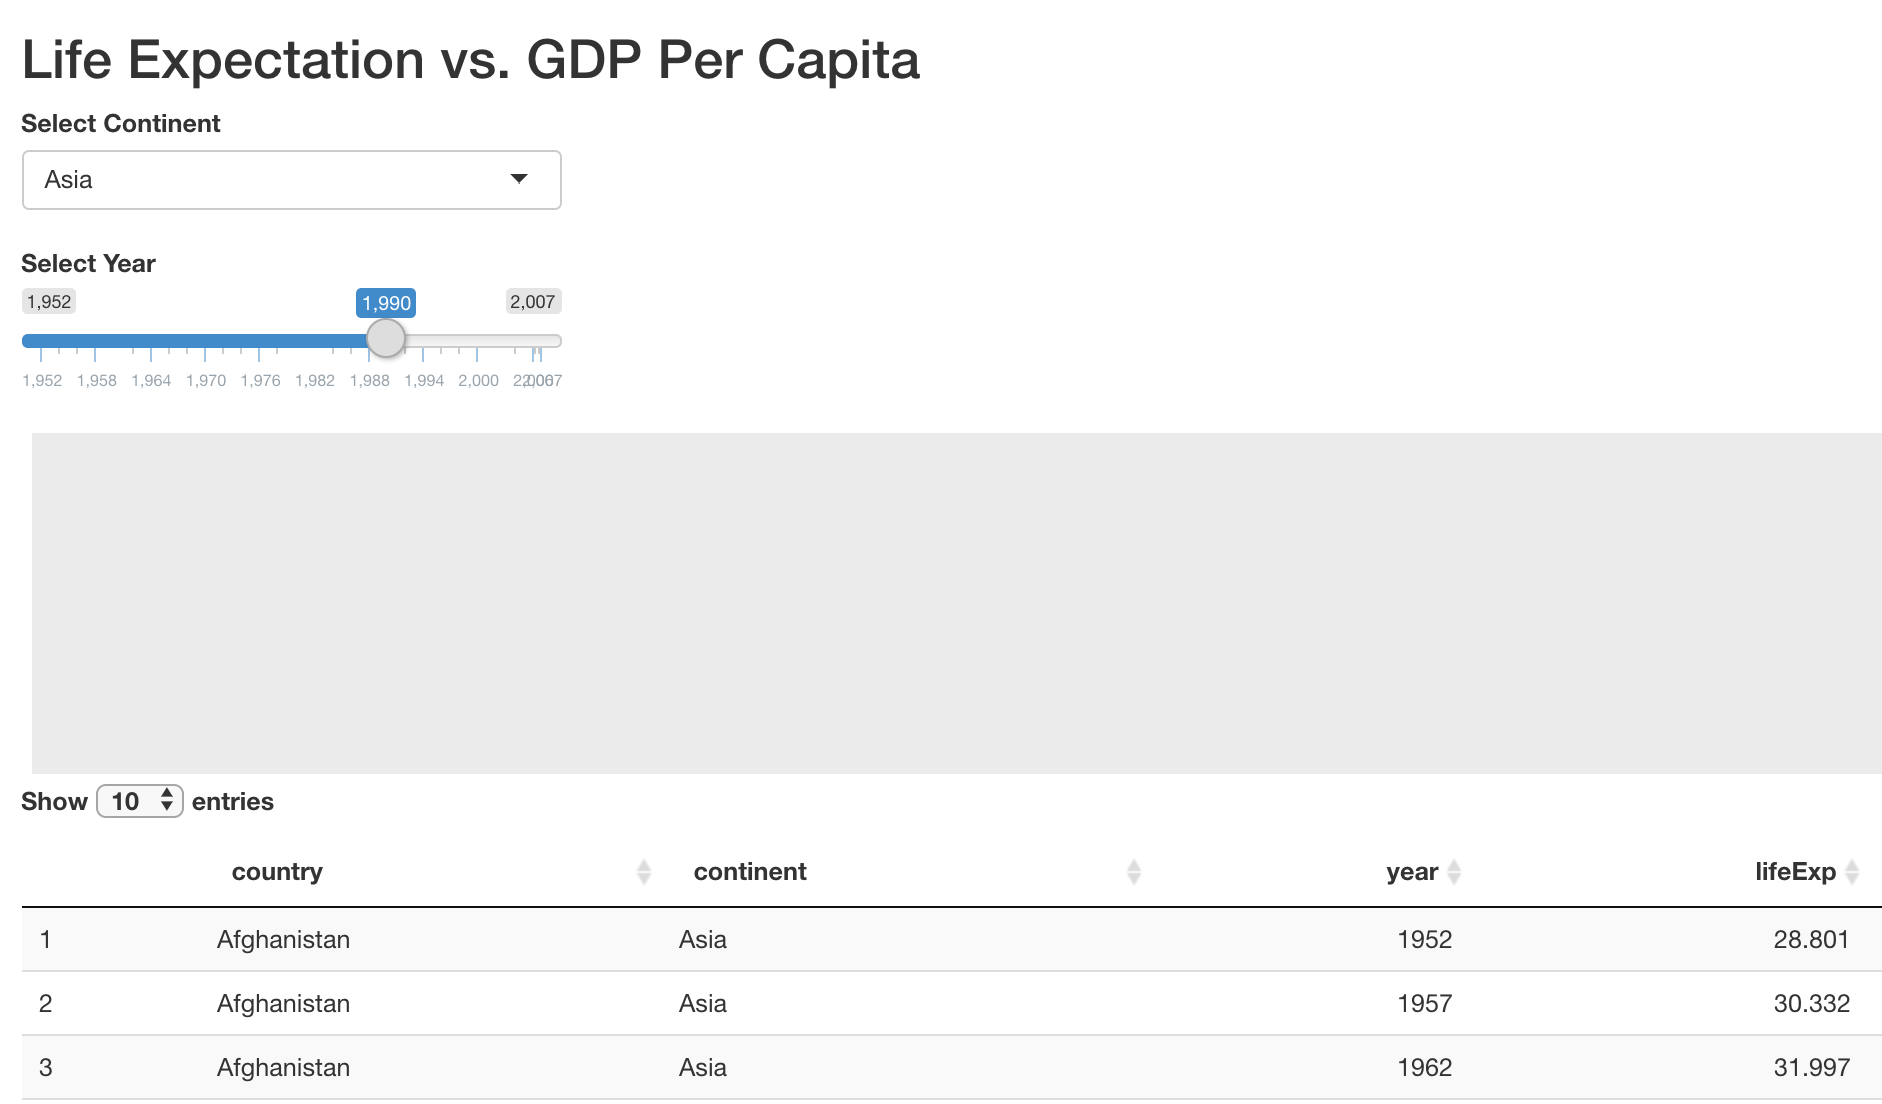
Une application affichant un graphique vide et un tableau interactif, avec des contrôles pour choisir un continent et une année

Créer des applications web avec Shiny en R

Étape 3 : mettre à jour la mise en page (UI)

ui <- fluidPage(
  titlePanel("Life Expectation vs. GDP Per Capita"),

sidebarLayout(
sidebarPanel( selectInput('continent', 'Select Continent', unique(gapminder$continent)), sliderInput('year', 'Select Year', 1952, 2007, 1990, step = 5) ),
mainPanel( plotOutput('plot'), DT::DTOutput('table') )
) )
Créer des applications web avec Shiny en R

Étape 3 : mettre à jour la mise en page (UI)

ui <- fluidPage(
  titlePanel("Life Expectation vs. GDP Per Capita"),

sidebarLayout(
sidebarPanel( selectInput('continent', 'Select Continent', unique(gapminder$continent)), sliderInput('year', 'Select Year', 1952, 2007, 1990, step = 5) ),
mainPanel( tabsetPanel( tabPanel("Plot", plotOutput('plot')), tabPanel("Table", DT::DTOutput('table')) ) )
) )
Créer des applications web avec Shiny en R

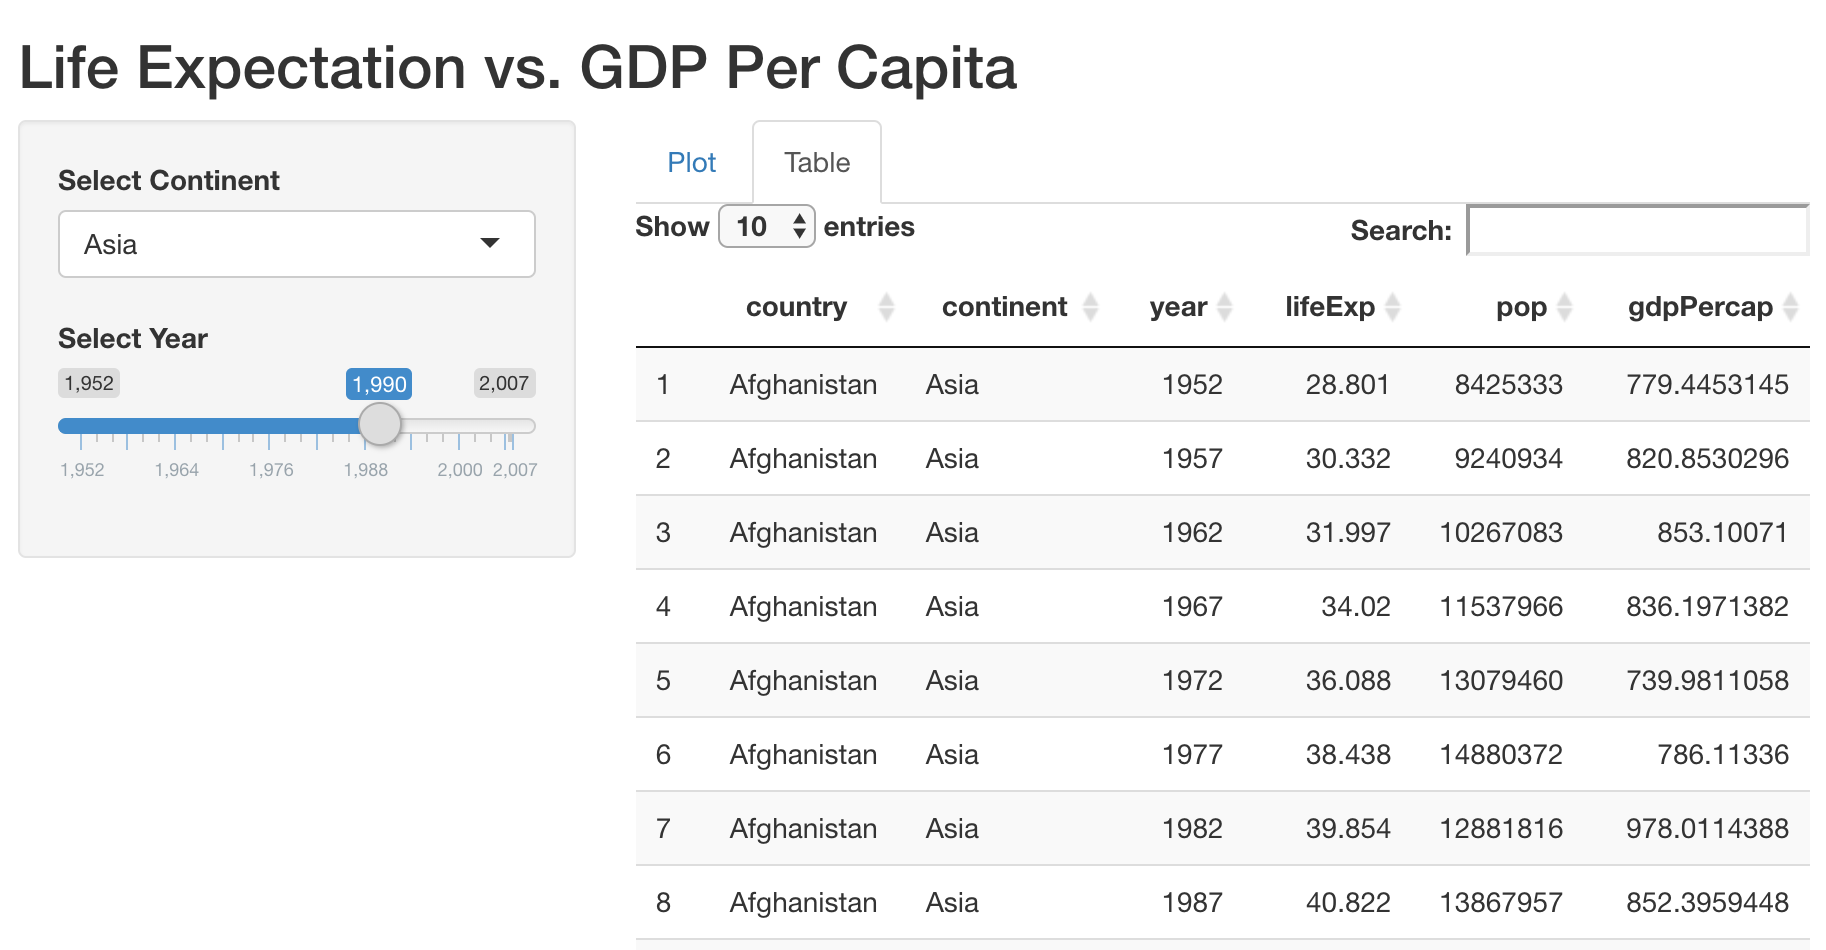
Une application affichant un tableau interactif de l'espérance de vie, de la population et du PIB par habitant pour un continent et une année choisis

Créer des applications web avec Shiny en R

Étape 4 : mettre à jour les sorties (Server)

server <- function(input, output, session){
  output$plot <- renderPlot({

data <- gapminder %>% filter(year == input$year) %>% filter(continent == input$continent) print(data) ggplot(data, aes(x = gdpPercap, y = lifeExp)) + geom_point()
}) output$table <- DT::renderDT({
gapminder %>% filter(year == input$year) %>% filter(continent == input$continent) })
}
Créer des applications web avec Shiny en R

Une application affichant, dans un onglet, un nuage de points interactif de l'espérance de vie vs. le PIB par habitant pour un continent et une année choisis
Créer des applications web avec Shiny en R

Passons à la pratique !

Créer des applications web avec Shiny en R

Preparing Video For Download...