Introduction to Shiny

Créer des applications web avec Shiny en R

Ramnath Vaidyanathan

VP of Product Research

Introduction to Shiny
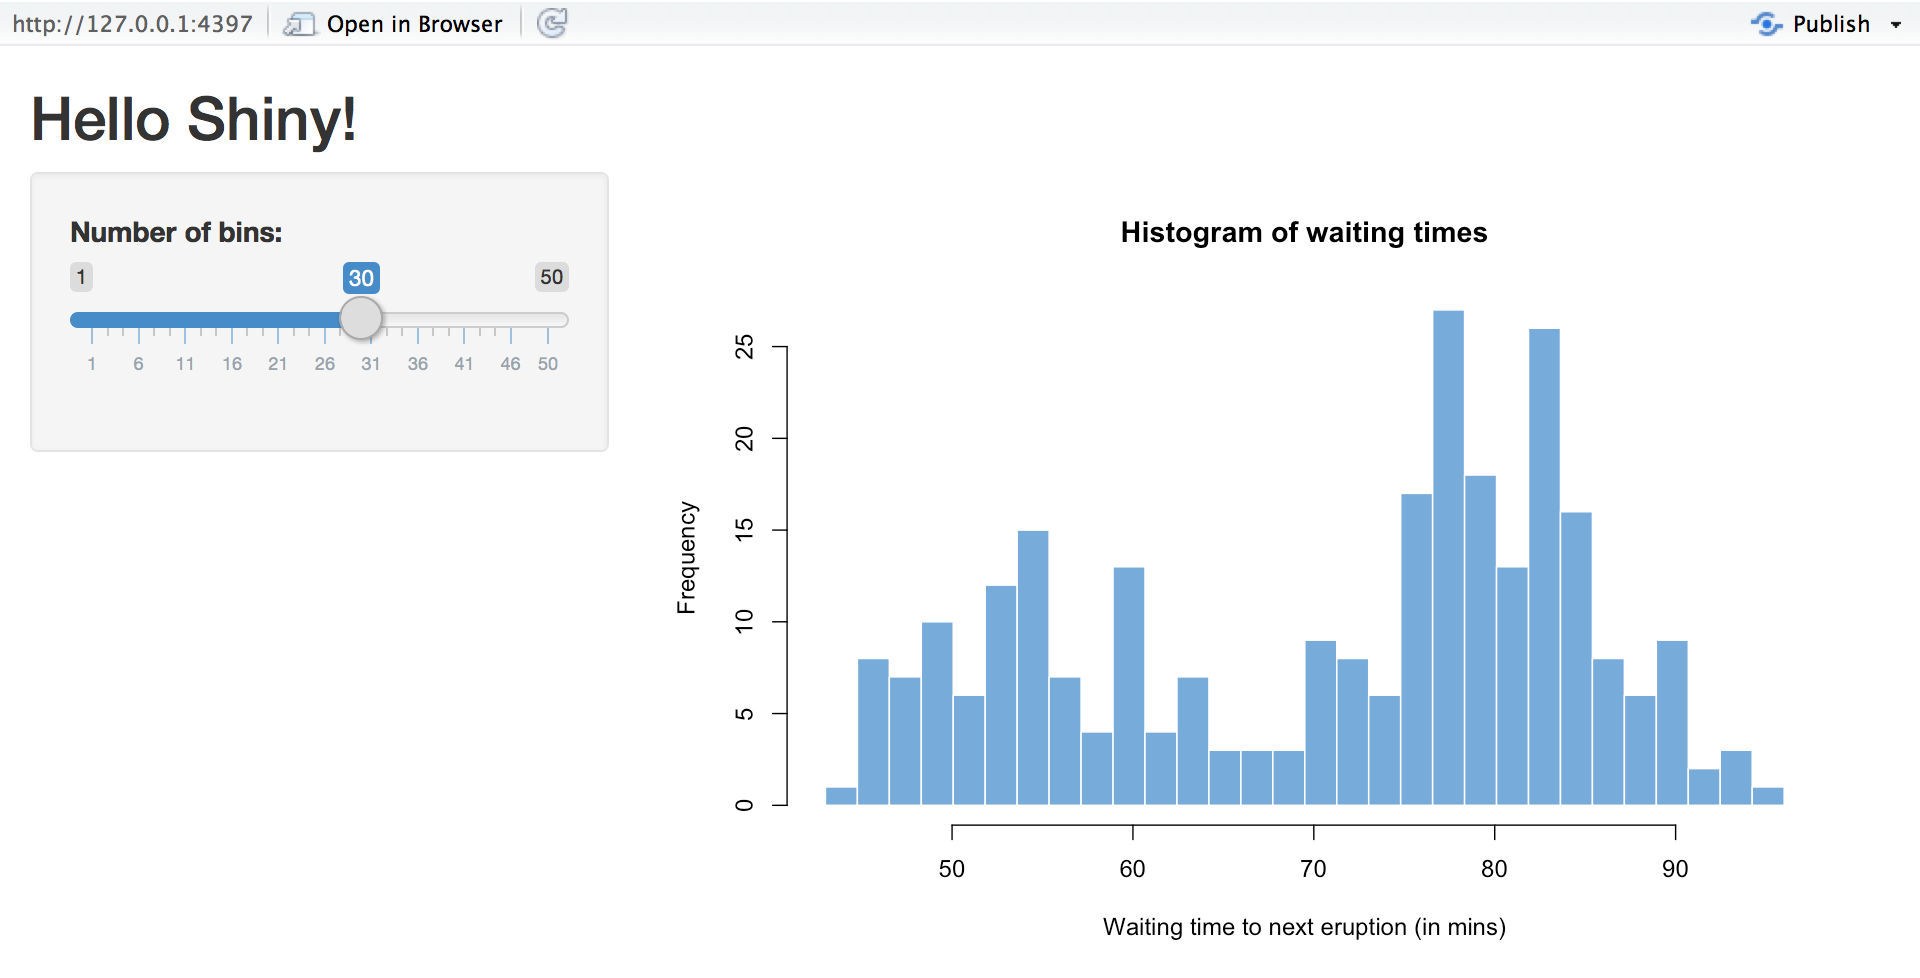
Shiny web app of wait times for Old Faithful geyser to explode, with number of histogram bins interactively adjustable

Créer des applications web avec Shiny en R

What is a web app?

  • Updates based on user input/interaction
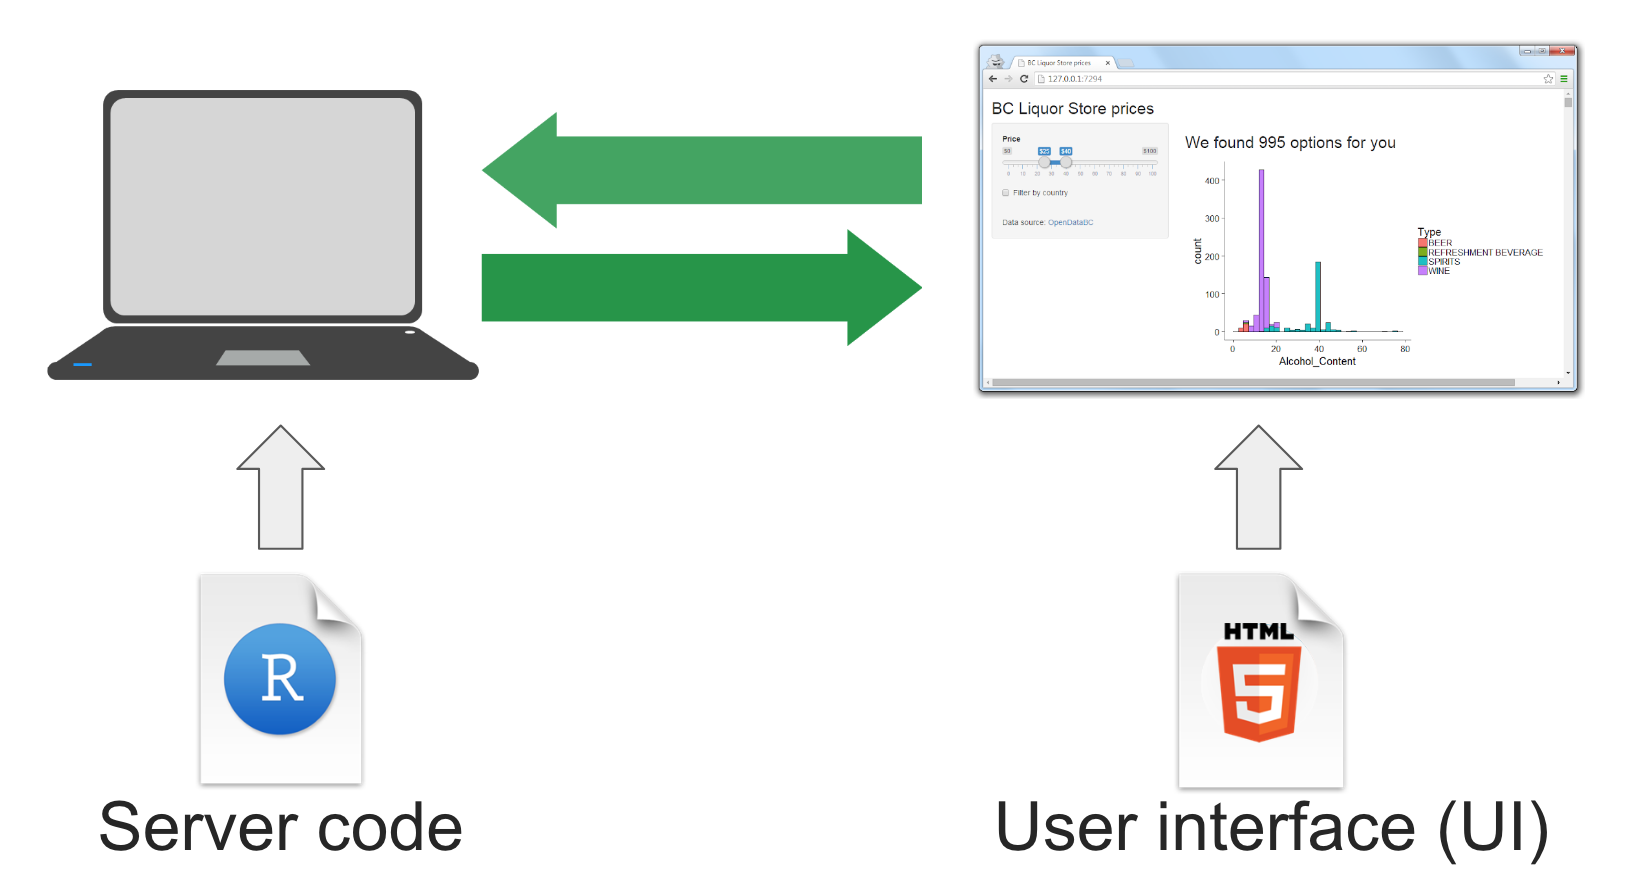
  • Made up of UI & server
Créer des applications web avec Shiny en R

What is a web app?

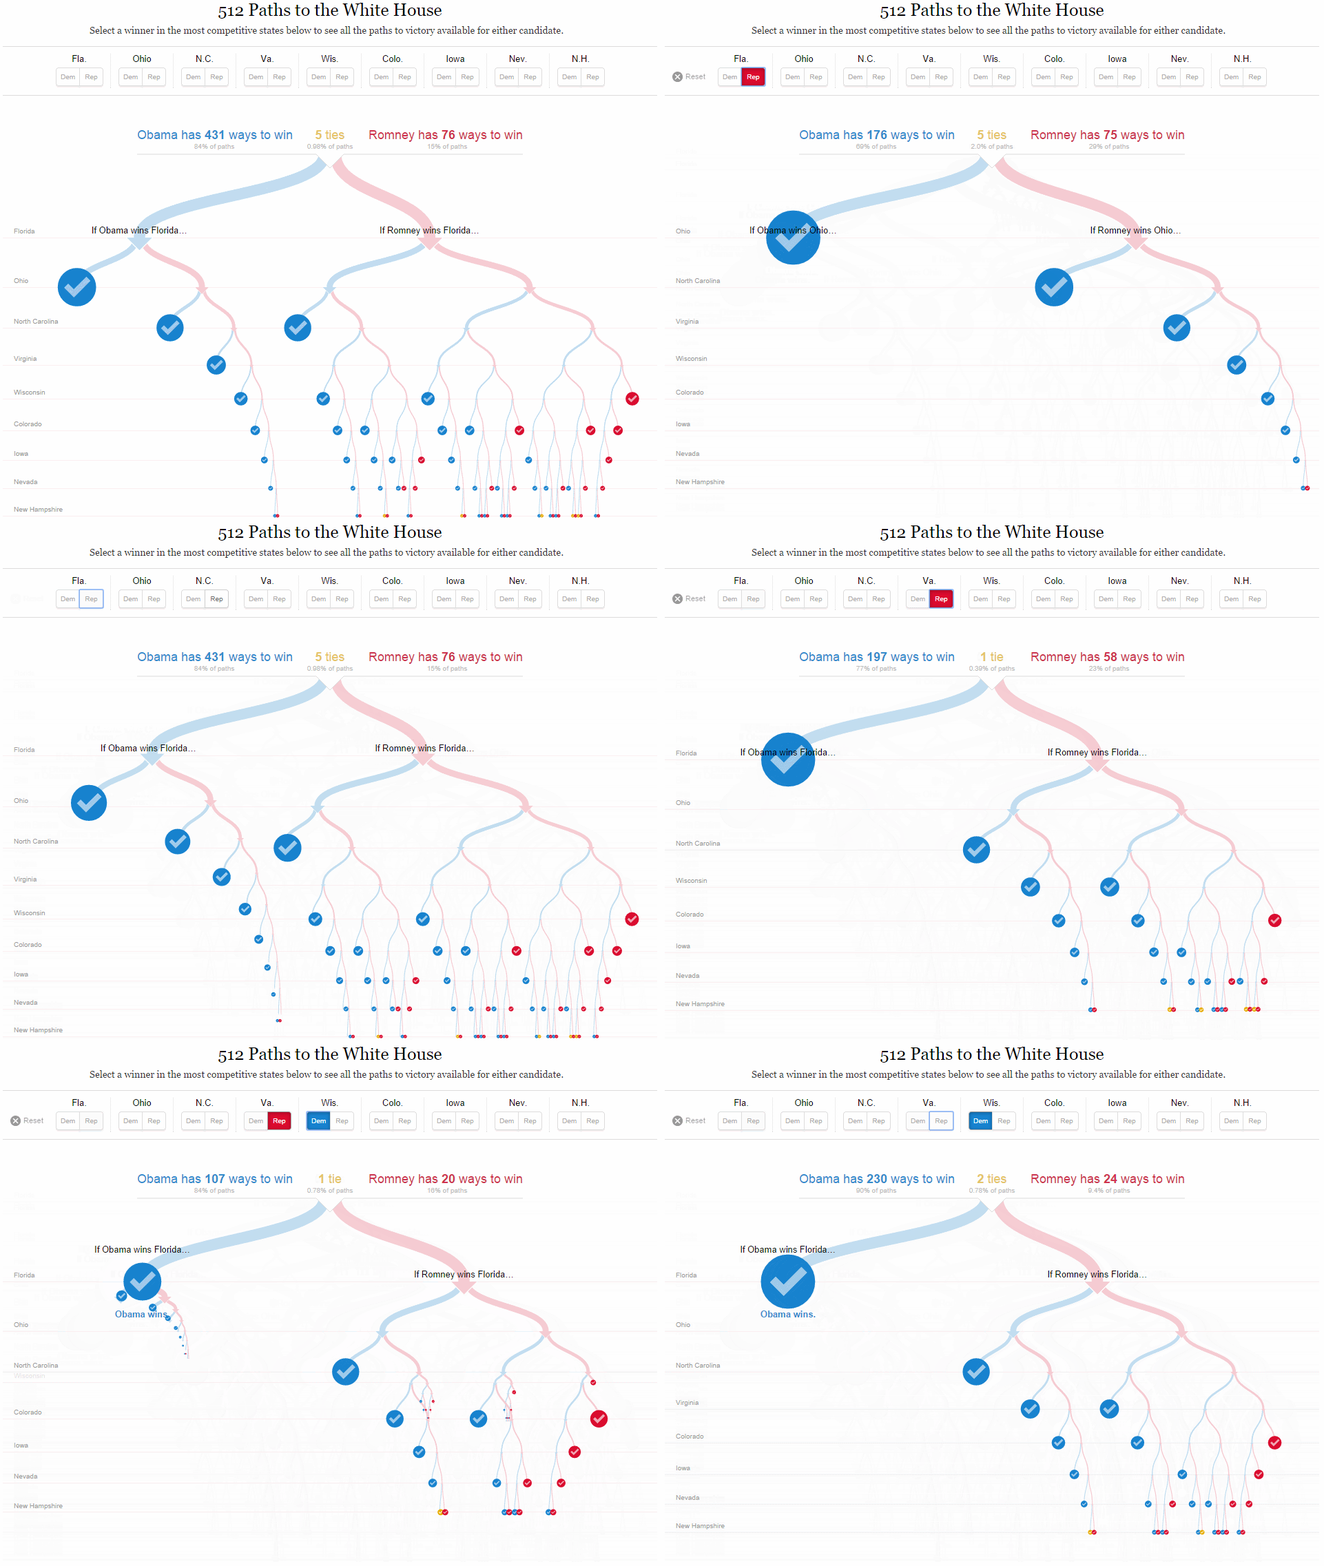
NY Times "Paths to the White House" web app gif

  • Displays paths to the White House for different presidential candidates.
Créer des applications web avec Shiny en R

What is a web app?

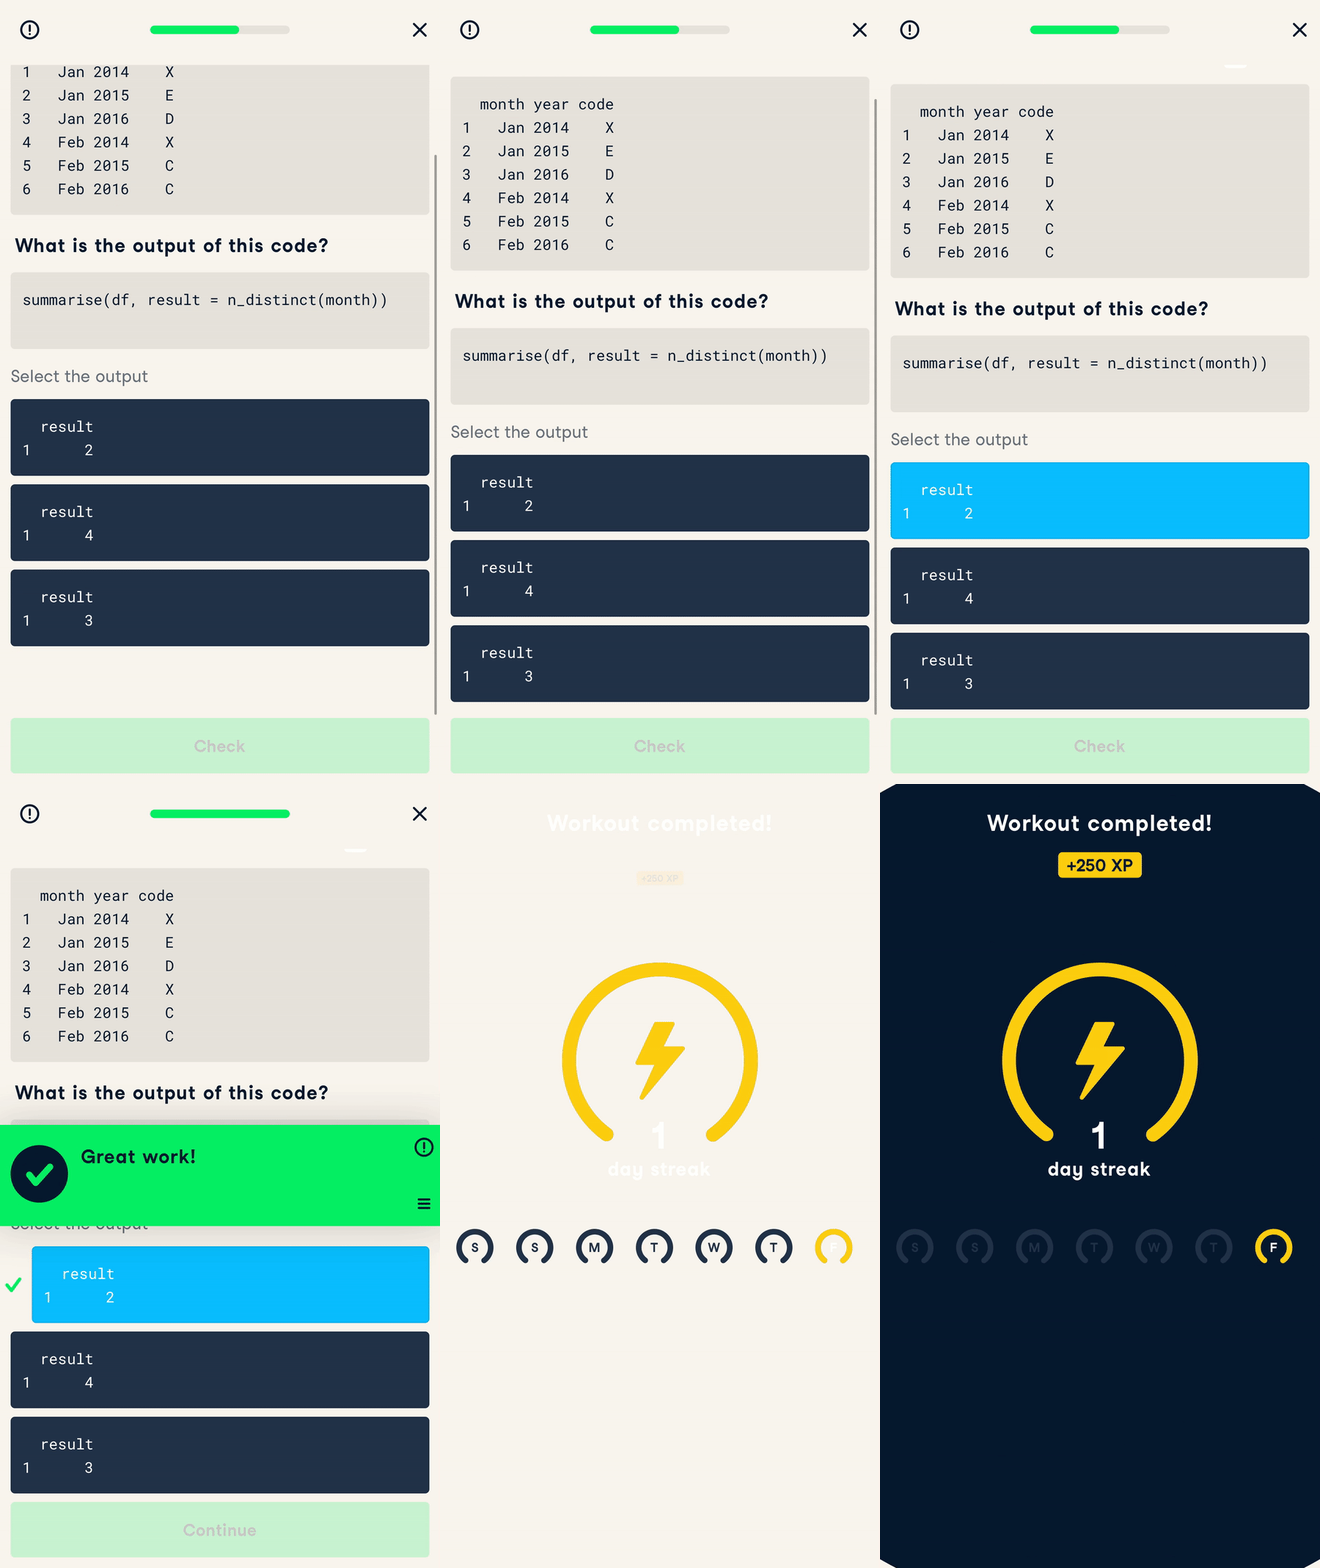
  • DataCamp mobile app

A gif of the DataCamp mobile app, displaying an example of a practice question.

Créer des applications web avec Shiny en R

How does a web app work?

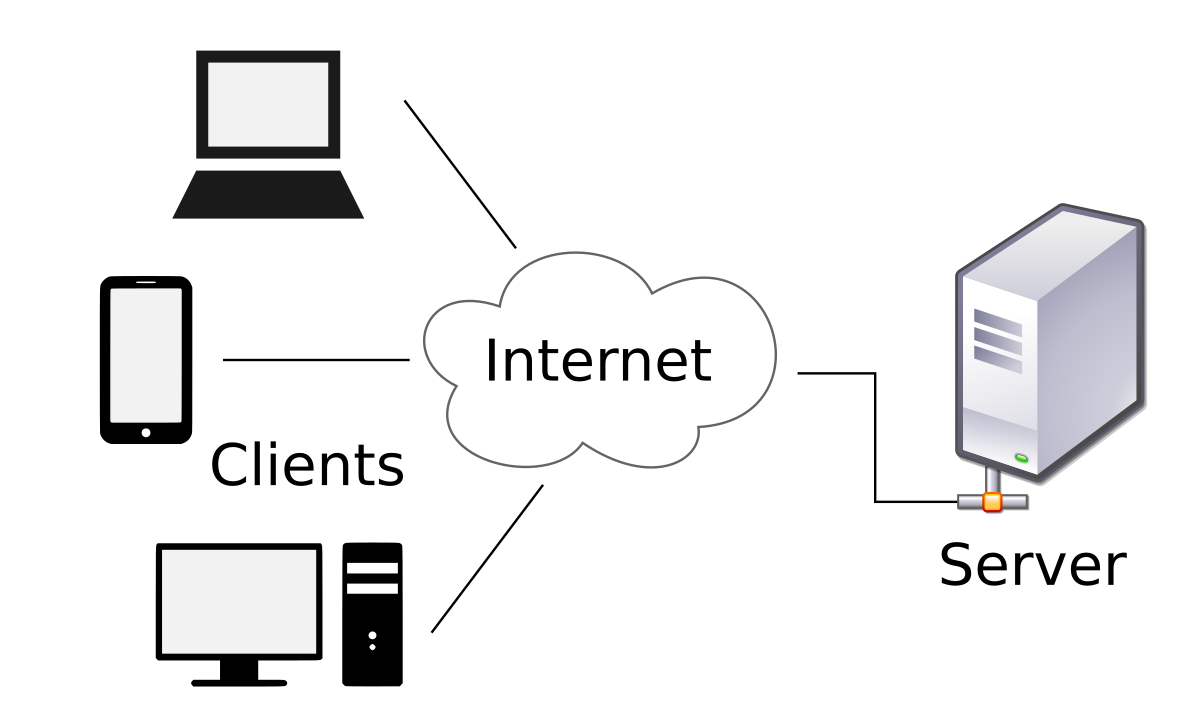
A web app is a thing that updates based on user input/interaction Diagram showing how clients and servers are connected to power web apps on the internet
Créer des applications web avec Shiny en R

What is Shiny?

What is shiny diagram, displaying how server code and the UI interface are separate but work together to create an app

Créer des applications web avec Shiny en R

Why should data scientists build web apps?
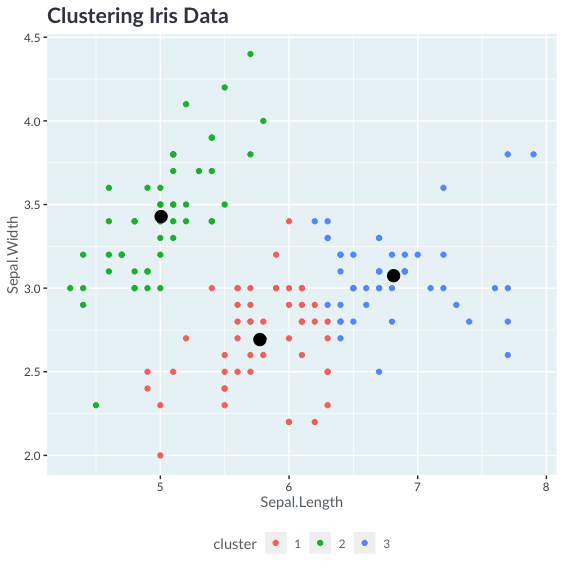
Iris dataset clustered by sepal.length and sepal.width, creating 3 distinct clusters

Créer des applications web avec Shiny en R

Why should data scientists build web apps?
plot_kmeans(
  data = iris, 
  x = 'Sepal.Length', 
  y = 'Sepal.Width', 
  nb_clusters = 3
)

Iris dataset clustered by sepal.length and sepal.width, creating 3 distinct clusters

Créer des applications web avec Shiny en R

Why should data scientists build web apps?

library(shiny)
ui <- fluidPage(
  h1('K-Means Clustering App'),
  selectInput('x', 'Select x', names(iris), 'Sepal.Length'),
  selectInput('y', 'Select y', names(iris), 'Sepal.Width'),
  numericInput('nb_clusters', 'Select number of clusters', 3),
  plotly::plotlyOutput('kmeans_plot')
)

server <- function(input, output, session){
  output$kmeans_plot <- plotly::renderPlotly({
    plot_kmeans(iris, input$x, input$y, input$nb_clusters)
  })
}

shinyApp(ui = ui, server = server)
Créer des applications web avec Shiny en R

Why should data scientists build web apps?

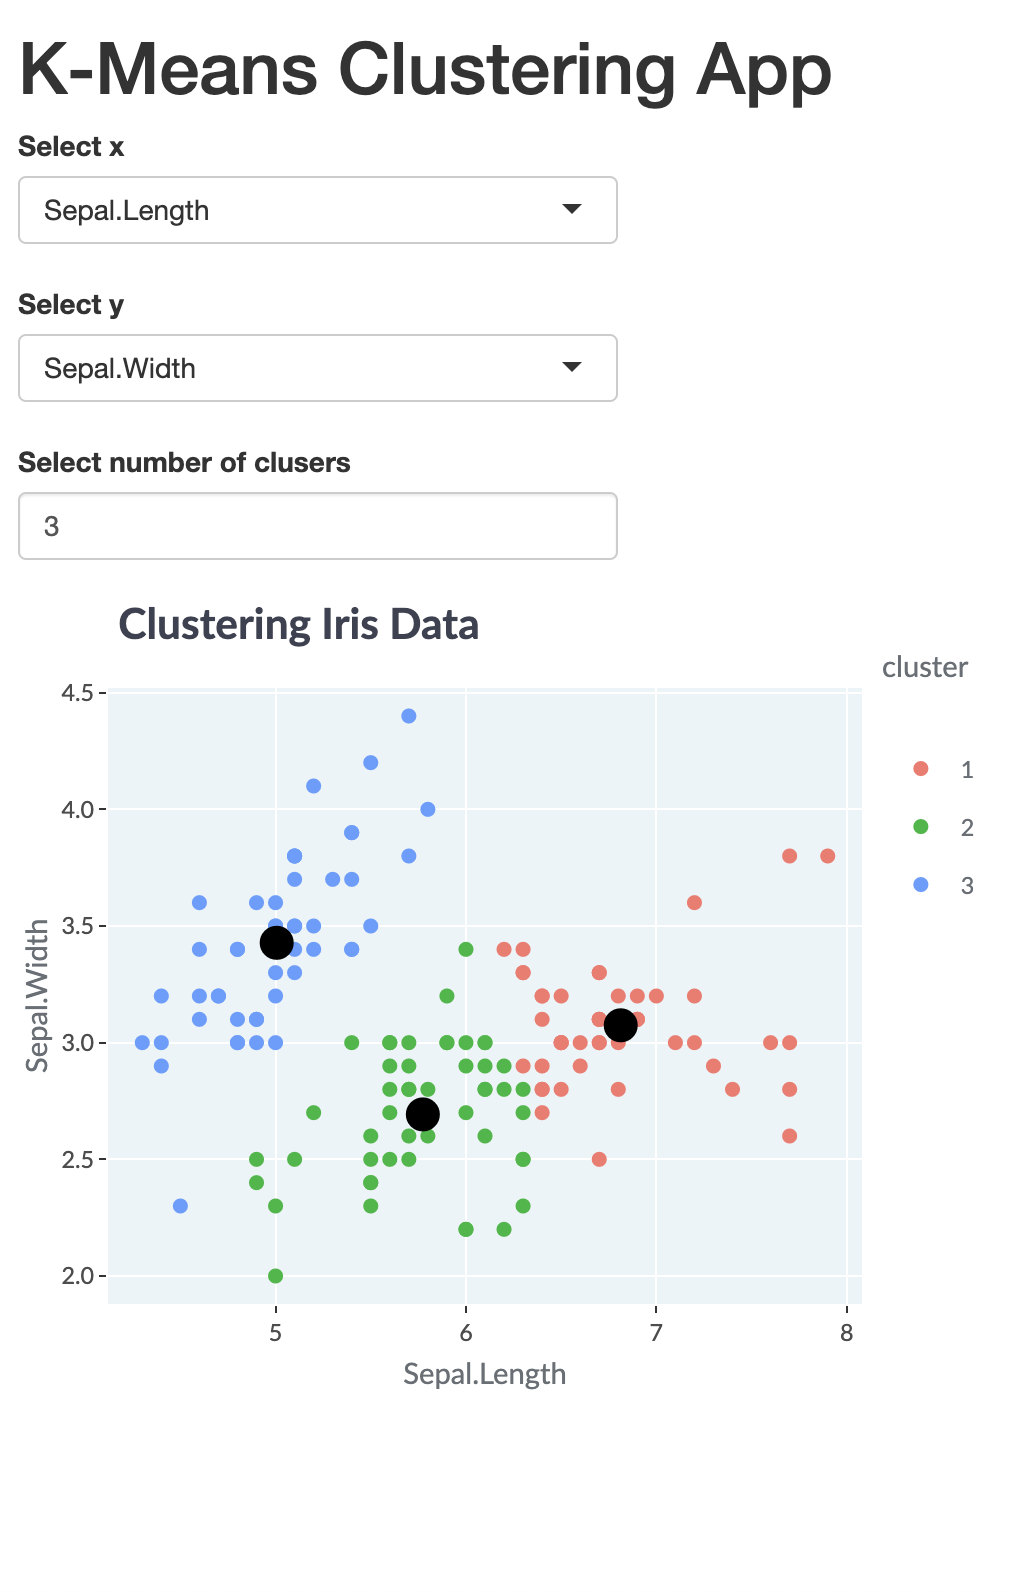
web app that does K-means clustering of Iris dataset

Créer des applications web avec Shiny en R

Let's practice!

Créer des applications web avec Shiny en R

Preparing Video For Download...