Qu'est-ce que le trading financier

Trading financier en Python

Chelsea Yang

Data Science Instructor

Le concept de trading financier

Le trading financier consiste à acheter et vendre des actifs financiers

Divers instruments à trader :

  • Actions
  • Obligations
  • Forex
  • Matières premières
  • Cryptomonnaies
Trading financier en Python

Pourquoi trader

Générer un profit en prenant des risques calculés

  • Positions longues : profiter d'une hausse des prix
  • Positions courtes : profiter d'une baisse des prix


Acteurs du marché :

  • Traders institutionnels
  • Traders particuliers
Trading financier en Python

Trading vs investissement

Trading :
  • Horizon de détention plus court
  • Focalisé sur les tendances ou variations de court terme
  • Possibilités longues et courtes
Investissement :
  • Horizon de détention plus long
  • Axé sur les fondamentaux du marché
  • Majoritairement des positions longues
Trading financier en Python

Données financières en séries temporelles

Séries temporelles : suite de points de données indexés dans le temps

import pandas as pd
# Load the data
bitcoin_data = pd.read_csv("bitcoin_data.csv", index_col='Date', parse_dates=True)
print(bitcoin_data.head())
               Open     High      Low    Close      Volume
Date                                                      
2019-01-01  3746.71  3850.91  3707.23  3843.52  4324200990
2019-01-02  3849.22  3947.98  3817.41  3943.41  5244856835
2019-01-03  3931.05  3935.69  3826.22  3836.74  4530215218
2019-01-04  3832.04  3865.93  3783.85  3857.72  4847965467
2019-01-05  3851.97  3904.90  3836.90  3845.19  5137609823
Trading financier en Python

Tracer une courbe pour des séries temporelles

import matplotlib.pyplot as plt
plt.plot(bitcoin_data['Close'], color='red')
plt.title("Daily close price")
plt.show()
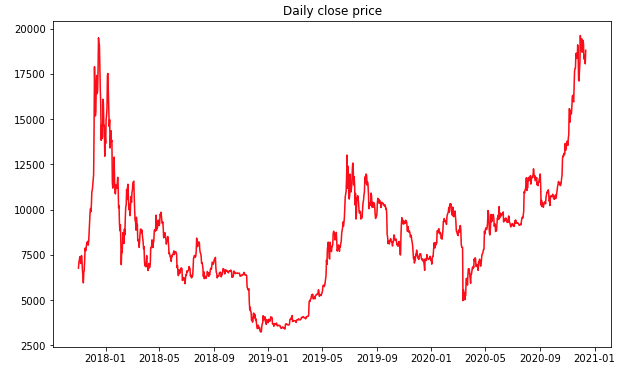
Exemple de courbe du cours de clôture d'une action

Trading financier en Python

Graphique en chandeliers

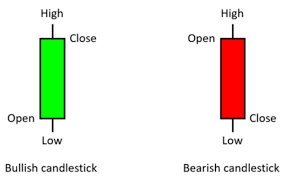
Chandelier : à gauche, un chandelier vert haussier ; à droite, un chandelier rouge baissier.

  • Chaque chandelier affiche le plus haut, le plus bas, l'ouverture et la clôture

  • La couleur indique un mouvement haussier (prix en hausse) ou baissier (prix en baisse)

Trading financier en Python

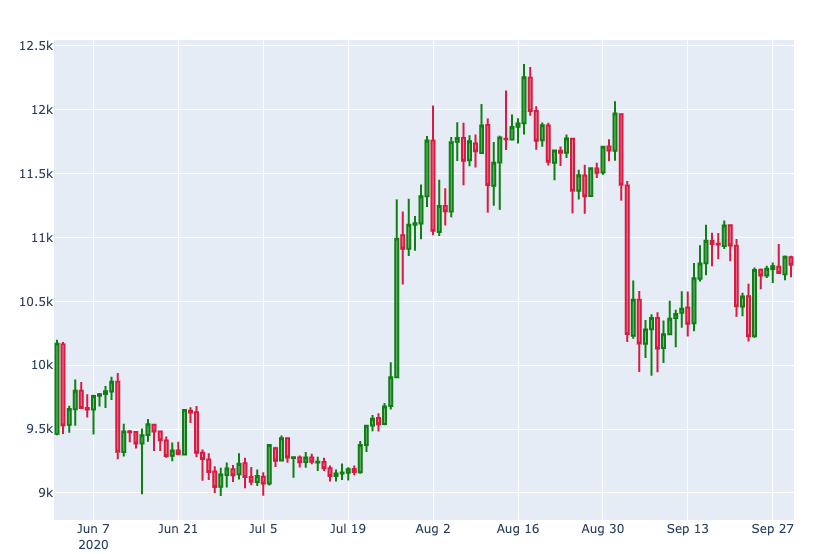
Tracer un graphique en chandeliers avec Python
import plotly.graph_objects as go

# Define the candlestick candlestick = go.Candlestick( x = bitcoin_data.index, open = bitcoin_data['Open'], high = bitcoin_data['High'], low = bitcoin_data['Low'], close = bitcoin_data['Close'])
# Create a plot fig = go.Figure(data=[candlestick])
# Show the plot fig.show()

Tracer un chandelier

Trading financier en Python

Passons à la pratique !

Trading financier en Python

Preparing Video For Download...