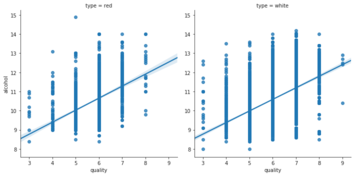
Graphiques de régression avec Seaborn
Visualisation de données intermédiaire avec Seaborn

Chris Moffitt
Instructor
Introduction à regplot
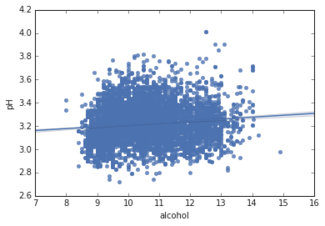
- La fonction
regplotcrée un nuage de points avec une droite de régression - Son usage est proche de
displot - Les variables
data,xetydoivent être définies
sns.regplot(data=df, x="alcohol", y="pH" )
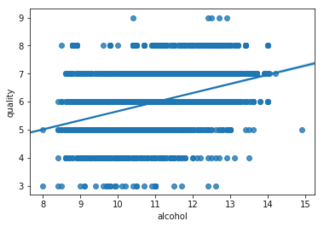
lmplot() s'appuie sur regplot() de base
regplot— bas niveau
sns.regplot(data=df,
            x="alcohol",
            y="quality")
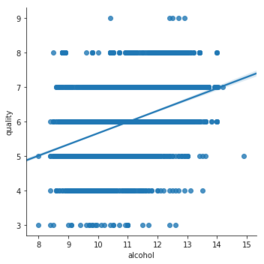
lmplot— haut niveau
sns.lmplot(data=df,
           x="alcohol",
           y="quality")
Facettes avec lmplot
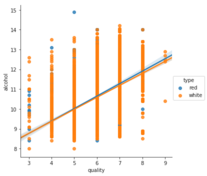
- Organiser par couleurs (
hue)
sns.lmplot(data=df,
           x="quality",
           y="alcohol",
           hue="type")
- Organiser par colonnes (
col)
sns.lmplot(data=df,
           x="quality",
           y="alcohol",
           col="type")