Mise à l'échelle robuste aux valeurs aberrantes

Détection d’anomalies en Python

Bekhruz (Bex) Tuychiev

Kaggle Master, Data Science Content Creator

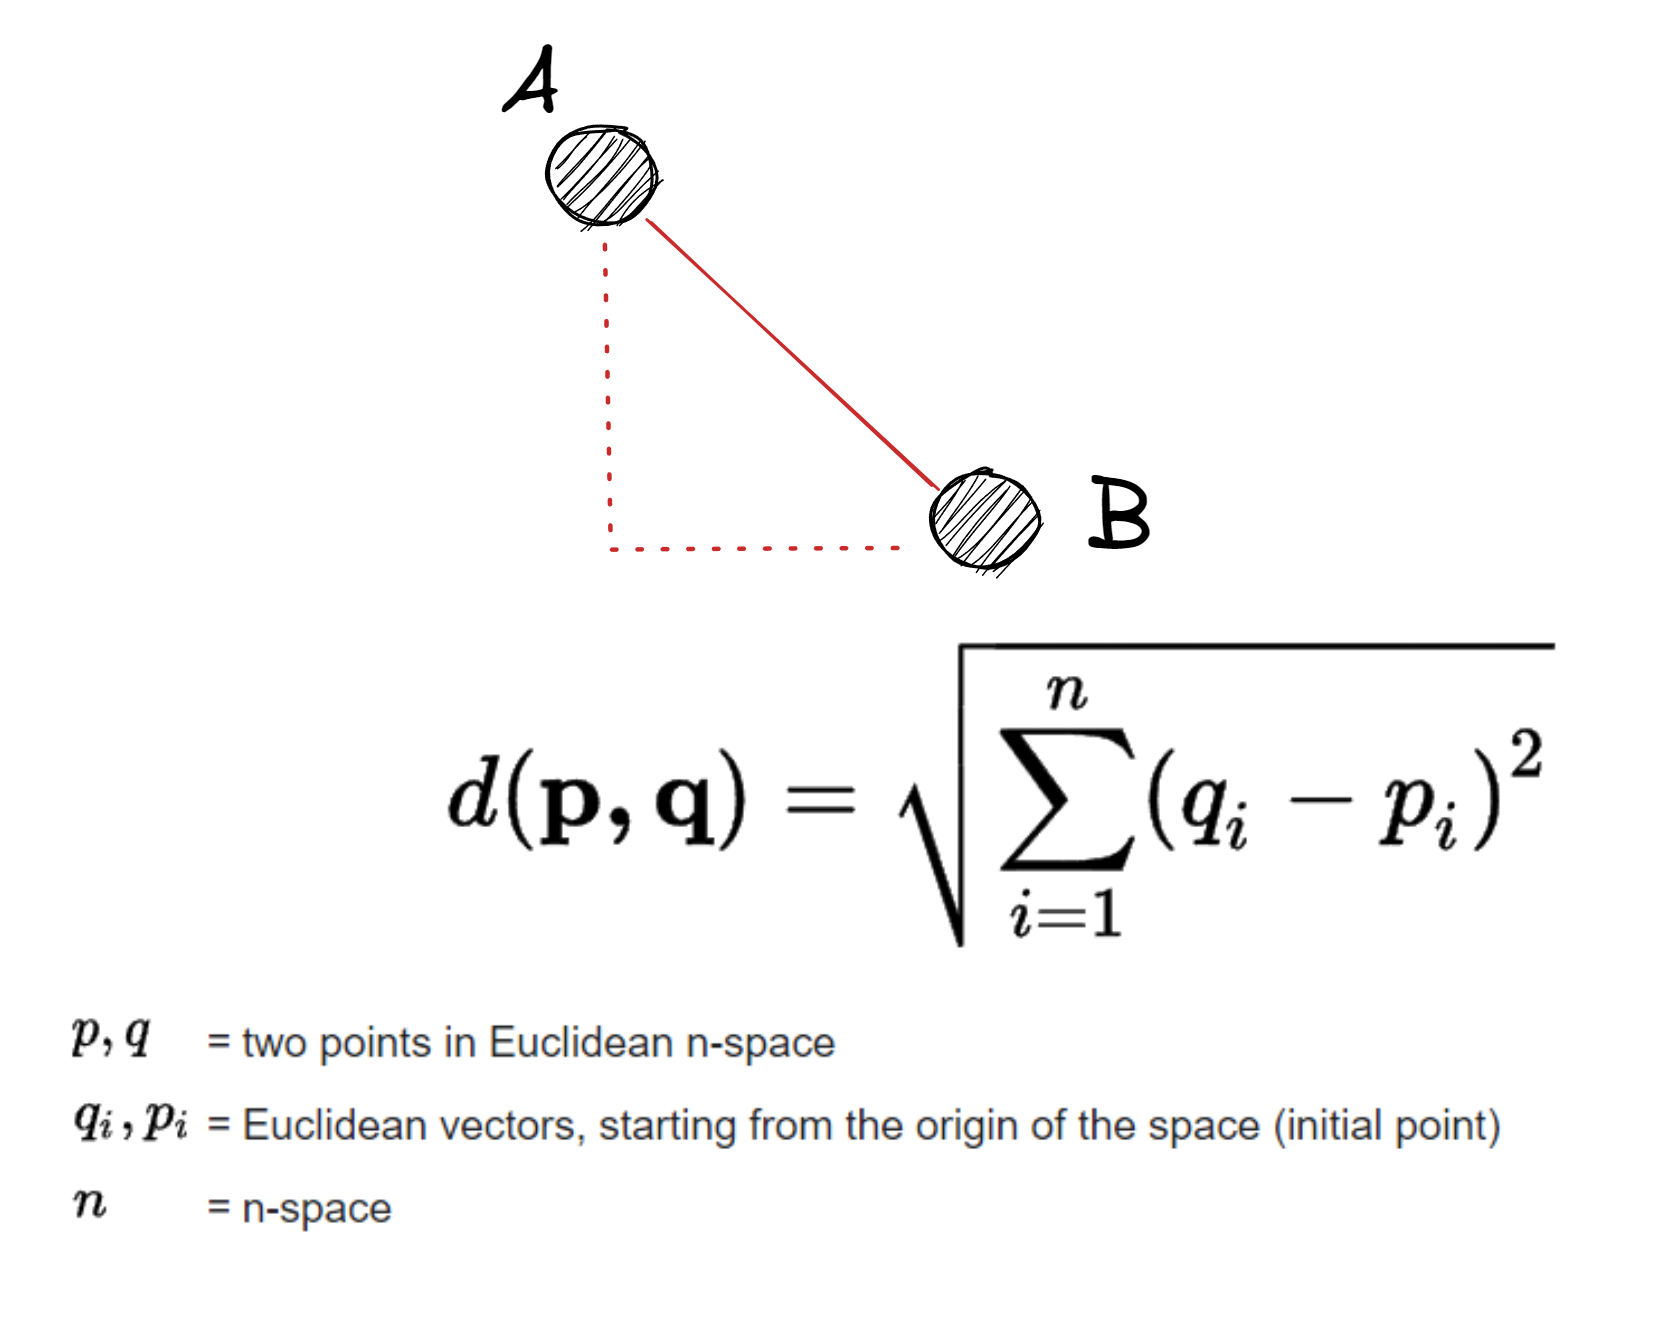
Distance euclidienne
A = np.array([9, 1, 6])
B = np.array([25, 44, 85])


diffs = (B - A) ** 2
dist_AB = np.sqrt(np.sum(diffs)) print(dist_AB)
91.35644476444998

La formule de la distance euclidienne et un visuel pour l'illustrer.

Détection d’anomalies en Python

Euclidean dans SciPy

from scipy.spatial.distance import \
euclidean

dist_AB = euclidean(A, B)
dist_AB
91.35644476444998

La formule de la distance euclidienne et un visuel pour l'illustrer.

Détection d’anomalies en Python

Standardisation

  • On soustrait la moyenne et on divise par l'écart type
  • Résultat : moyenne 0 et écart type 1
Détection d’anomalies en Python

StandardScaler

from sklearn.preprocessing import StandardScaler

ss = StandardScaler()

# Extraire les variables explicatives et la cible X = males.drop("weightkg", axis=1) y = males[['weightkg']]
# Ajuster ss.fit(X)
Détection d’anomalies en Python

Transformation

X_transformed = ss.transform(X)

X_transformed[:5]
array([[-1.05174523],
       [-0.29289108],
       [ 1.3446363 ],
       [-1.21654894],
       [0.056451235]])
Détection d’anomalies en Python

fit_transform

ss = StandardScaler()

X_transformed = ss.fit_transform(X)
Détection d’anomalies en Python

QuantileTransformer

from sklearn.preprocessing import QuantileTransformer


# Initialiser qt = QuantileTransformer() X = males.drop("weightkg", axis=1) y = males[['weightkg']]
X_transformed = qt.fit_transform(X) X_transformed.shape
(4082, 94)
Détection d’anomalies en Python

Préserver les noms de colonnes

qt = QuantileTransformer()

X.loc[:, :] = qt.fit_transform(X)

X.head()

Les cinq premières lignes d'une version transformée du jeu de mesures corporelles Ansur Males.

Détection d’anomalies en Python

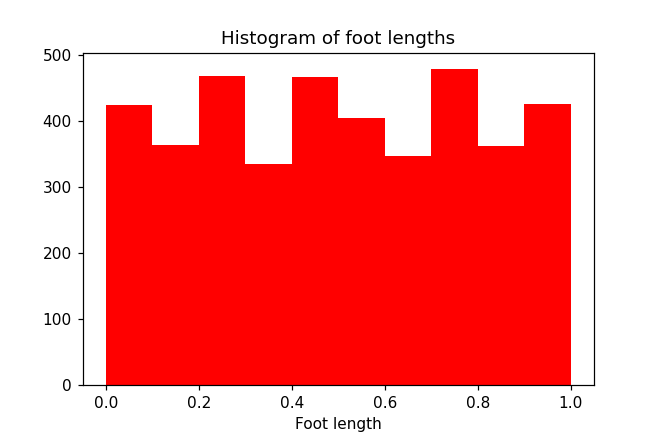
Histogramme uniforme

plt.hist(X['footlength'], color='red')

plt.xlabel("Foot length")
plt.title("Histogram of foot lengths")

plt.show()

Un histogramme de la colonne foot length montrant une distribution uniforme

Détection d’anomalies en Python

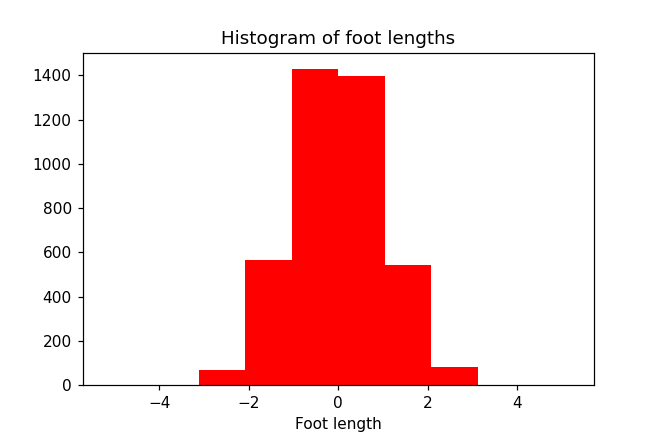
Histogramme normal

qt = QuantileTransformer(
  output_distribution='normal')

# Reconstruire le tableau de variables explicatives écrasé
X = males.drop("weightkg", axis=1)
X.loc[:, :] = qt.fit_transform(X)

plt.hist(X['footlength'], color='r')
plt.xlabel("Foot length")
plt.title("Histogram of foot lengths")

plt.show()

Un histogramme de la colonne foot length montrant une distribution proche de la normale

Détection d’anomalies en Python

Passons à la pratique !

Détection d’anomalies en Python

Preparing Video For Download...