Vecteur moyen et matrice variance-covariance

Lois de probabilité multivariées en R

Surajit Ray

Professor, University of Glasgow

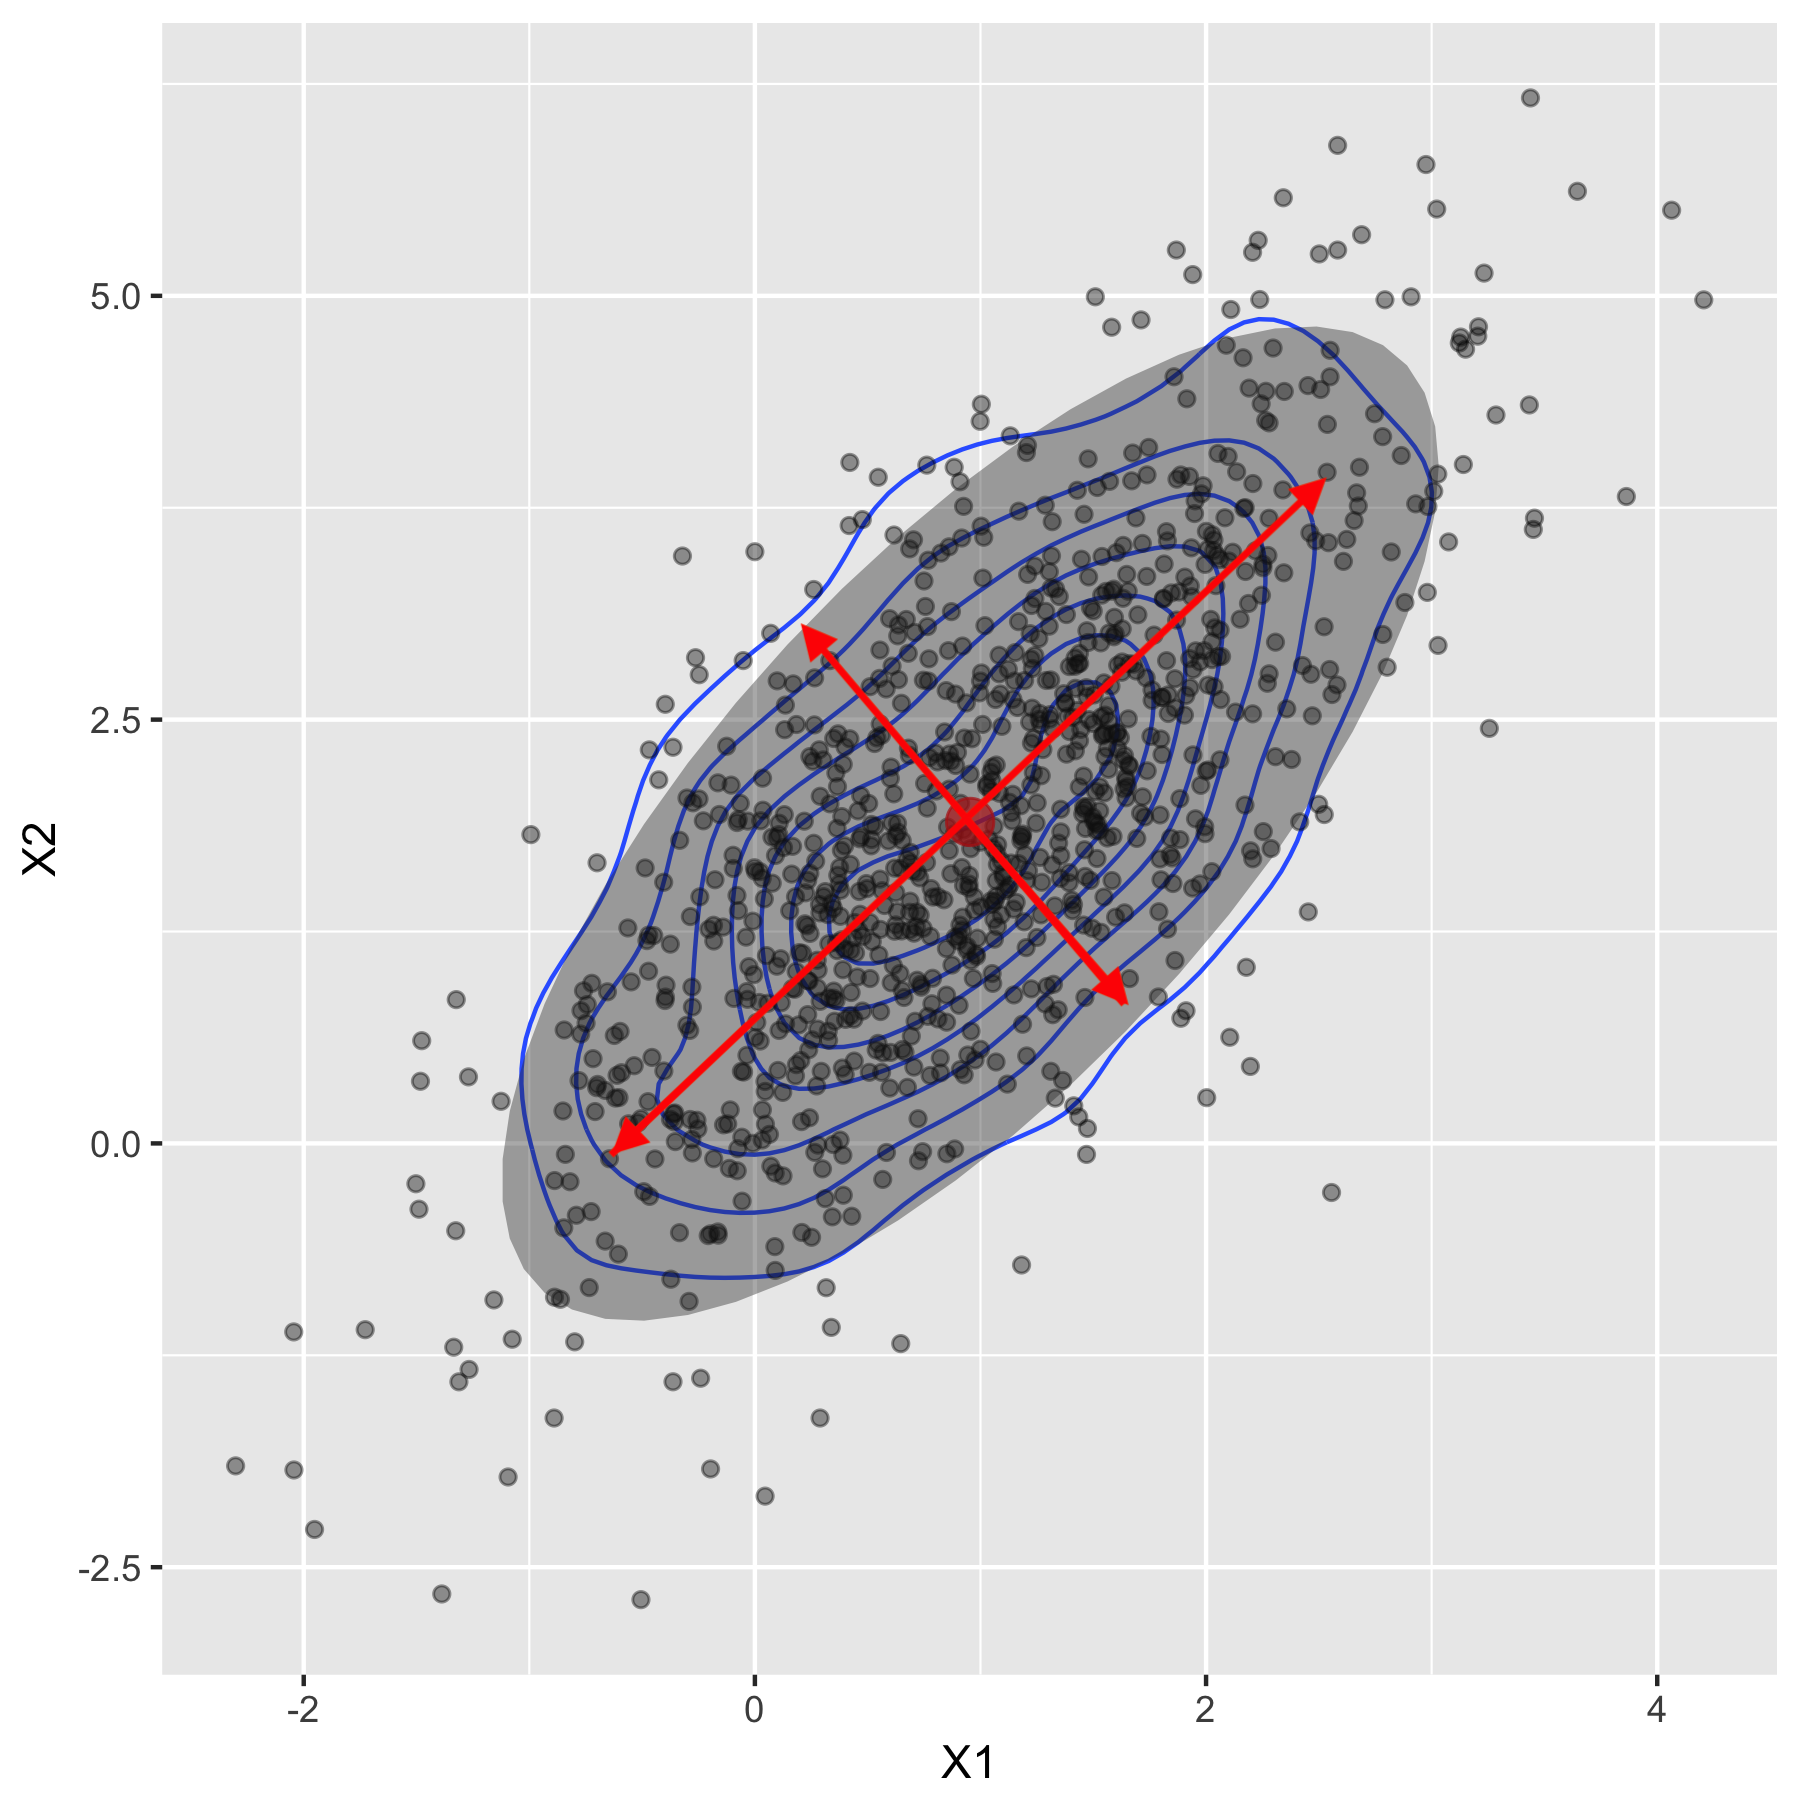
La moyenne indique la position de la distribution
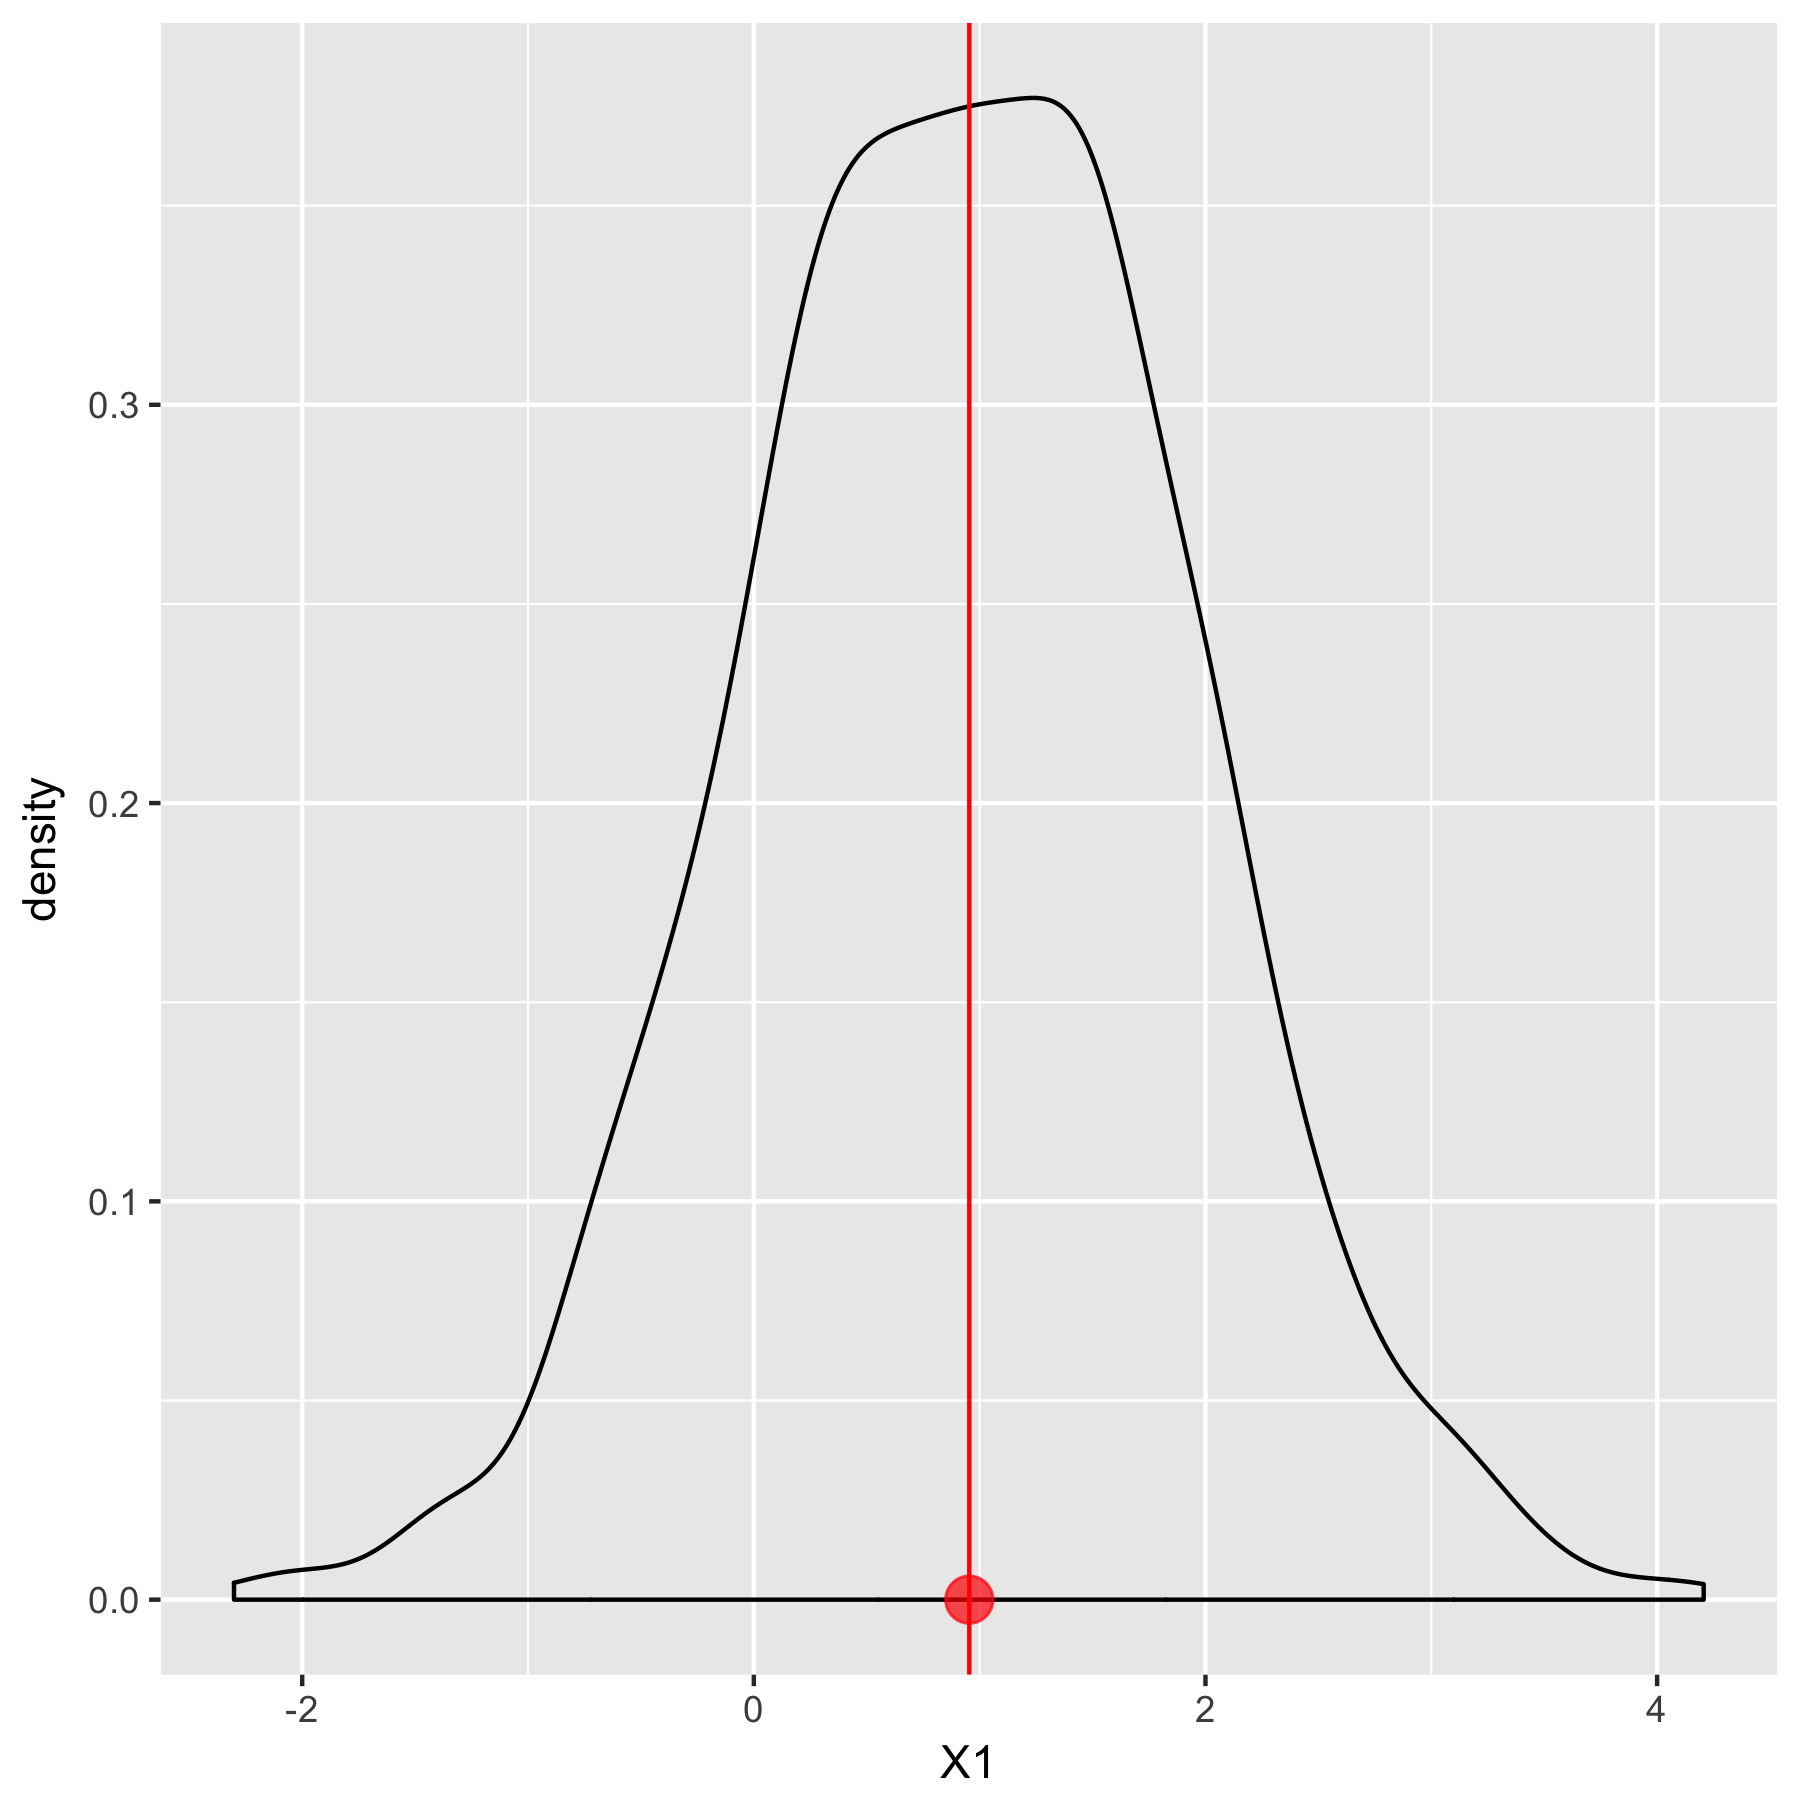
                                               Moyenne $0.95$
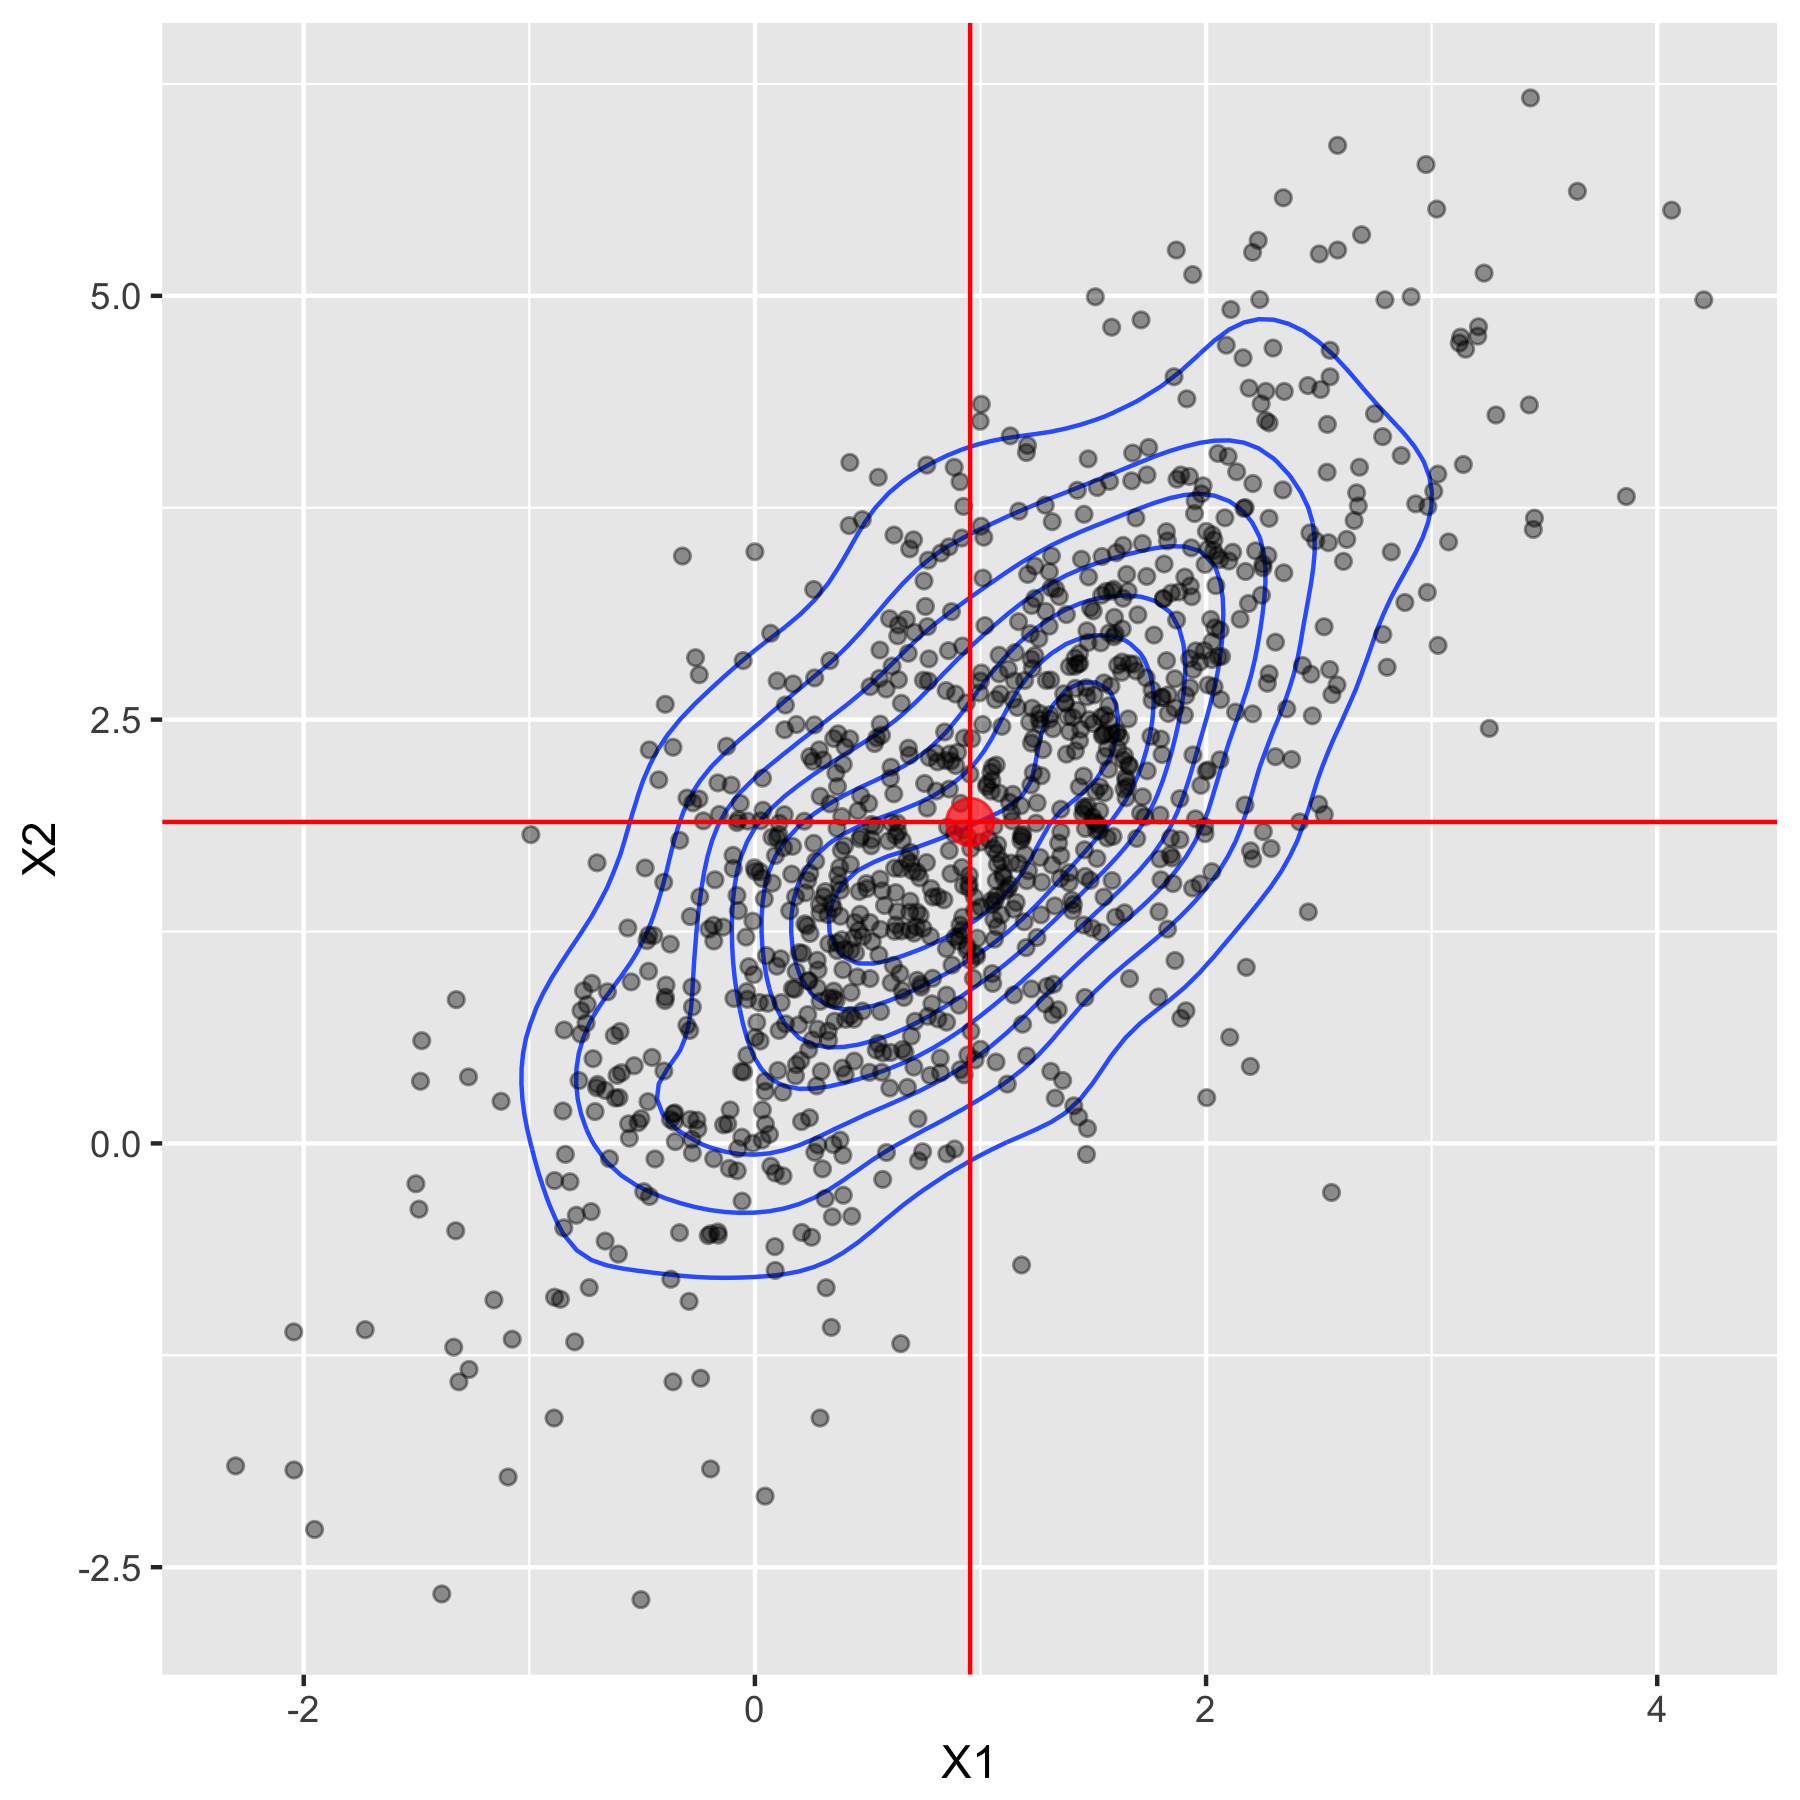
                                  Vecteur moyen (0.95 1.89)

Lois de probabilité multivariées en R

La matrice variance-covariance mesure la dispersion
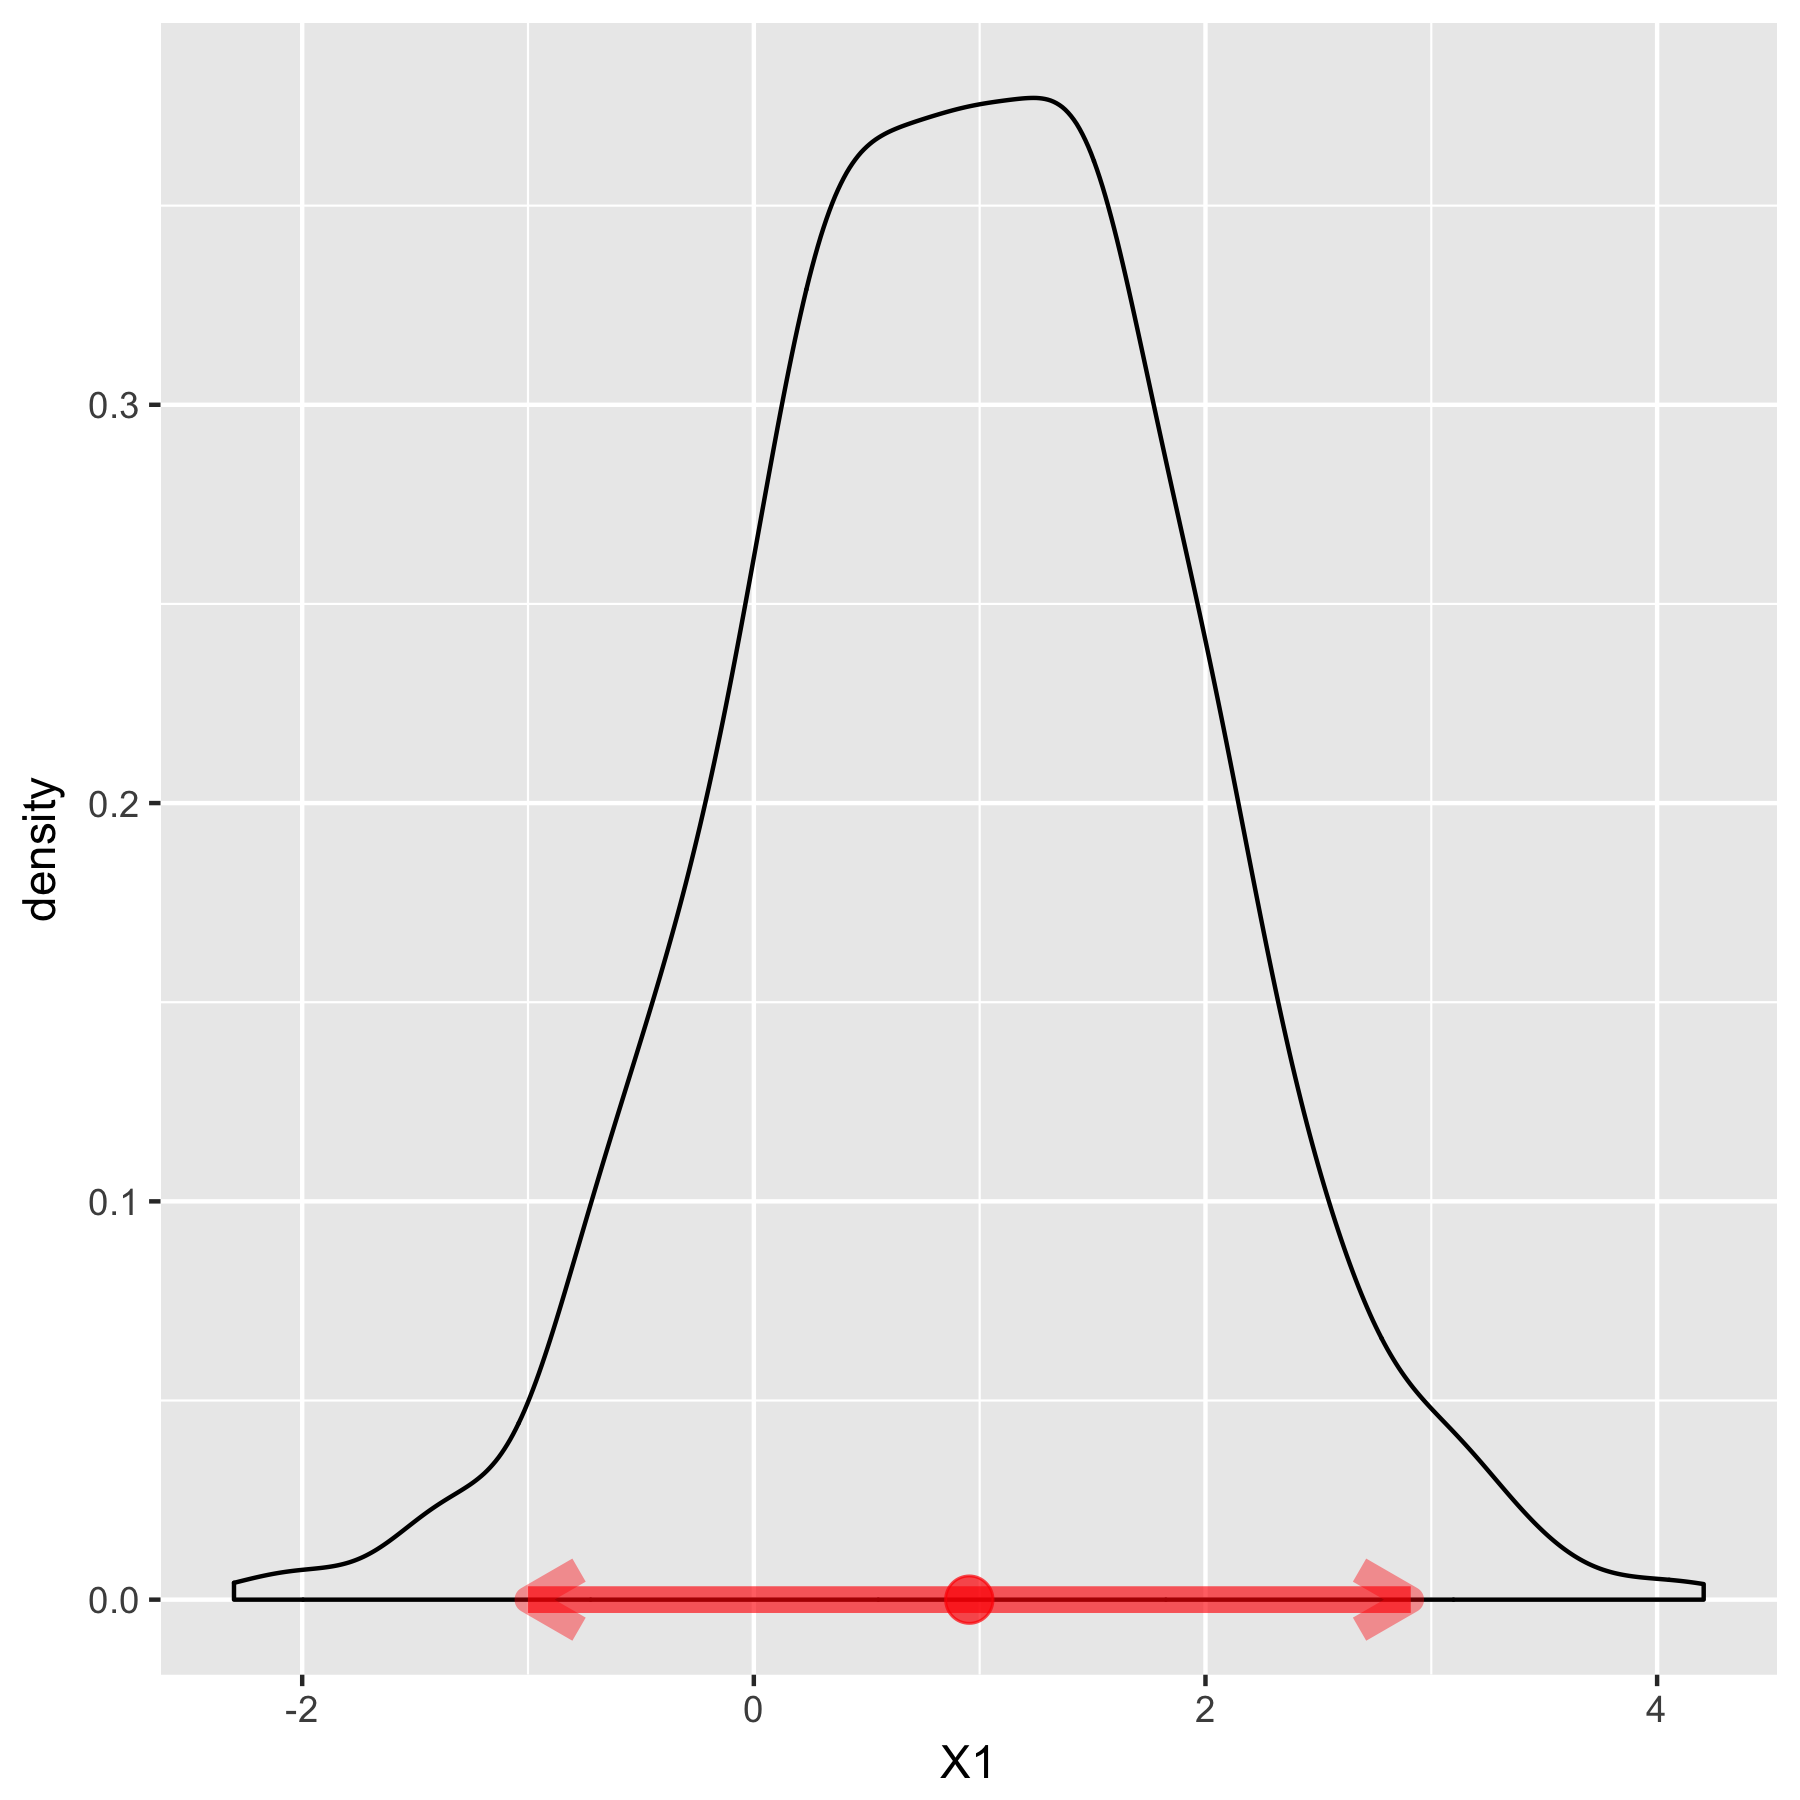
                                            Variance $1.02$

Variance-covariance ${\begin{pmatrix} 1.02 & 0.97 \\ 0.97 & 2 \end{pmatrix}}$

Lois de probabilité multivariées en R

Calcul de la moyenne

colMeans(iris_raw[, 1:4])
Sepal.Length  Sepal.Width Petal.Length  Petal.Width 
        5.84         3.05         3.76         1.20

Fonctions pour calculer les moyennes par sous-groupes

  • by()
  • aggregate()
Lois de probabilité multivariées en R

Moyenne par groupe avec by

by(data = iris[,1:4], INDICES = iris$Species, FUN = colMeans)
iris_raw$Species: setosa
Sepal.Length  Sepal.Width Petal.Length  Petal.Width 
       5.006        3.418        1.464        0.244 
 ----------------------------------------------------
iris_raw$Species: versicolor
Sepal.Length  Sepal.Width Petal.Length  Petal.Width 
       5.936        2.770        4.260        1.326 
 ----------------------------------------------------
iris_raw$Species: virginica
Sepal.Length  Sepal.Width Petal.Length  Petal.Width 
       6.588        2.974        5.552        2.026
Lois de probabilité multivariées en R

Moyenne par groupe avec aggregate

aggregate(. ~ Species, iris_raw, mean)
     Species Sepal.Length Sepal.Width Petal.Length Petal.Width
1     setosa         5.01        3.42         1.46       0.244
2 versicolor         5.94        2.77         4.26       1.326
3  virginica         6.59        2.97         5.55       2.026
Lois de probabilité multivariées en R

Calcul des matrices variance-covariance et de corrélation

var(iris_raw[, 1:4])
             Sepal.Length Sepal.Width Petal.Length Petal.Width
Sepal.Length       0.6857     -0.0393        1.274       0.517
Sepal.Width       -0.0393      0.1880       -0.322      -0.118
Petal.Length       1.2737     -0.3217        3.113       1.296
Petal.Width        0.5169     -0.1180        1.296       0.582

Corrélation

cor(iris_raw[, 1:4])
             Sepal.Length Sepal.Width Petal.Length Petal.Width
Sepal.Length        1.000      -0.109        0.872       0.818
Sepal.Width        -0.109       1.000       -0.421      -0.357
Petal.Length        0.872      -0.421        1.000       0.963
Petal.Width         0.818      -0.357        0.963       1.000
Lois de probabilité multivariées en R

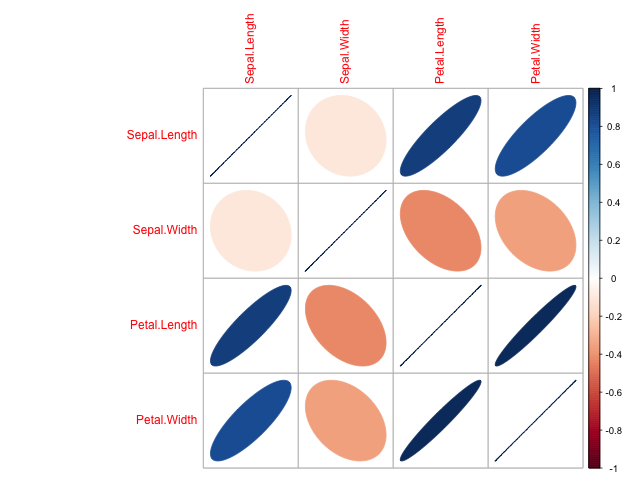
Visualisation de la matrice de corrélation

Fonction corrplot pour visualiser la corrélation

corrplot(cor(iris_raw[, 1:4]), method = "ellipse")
Lois de probabilité multivariées en R

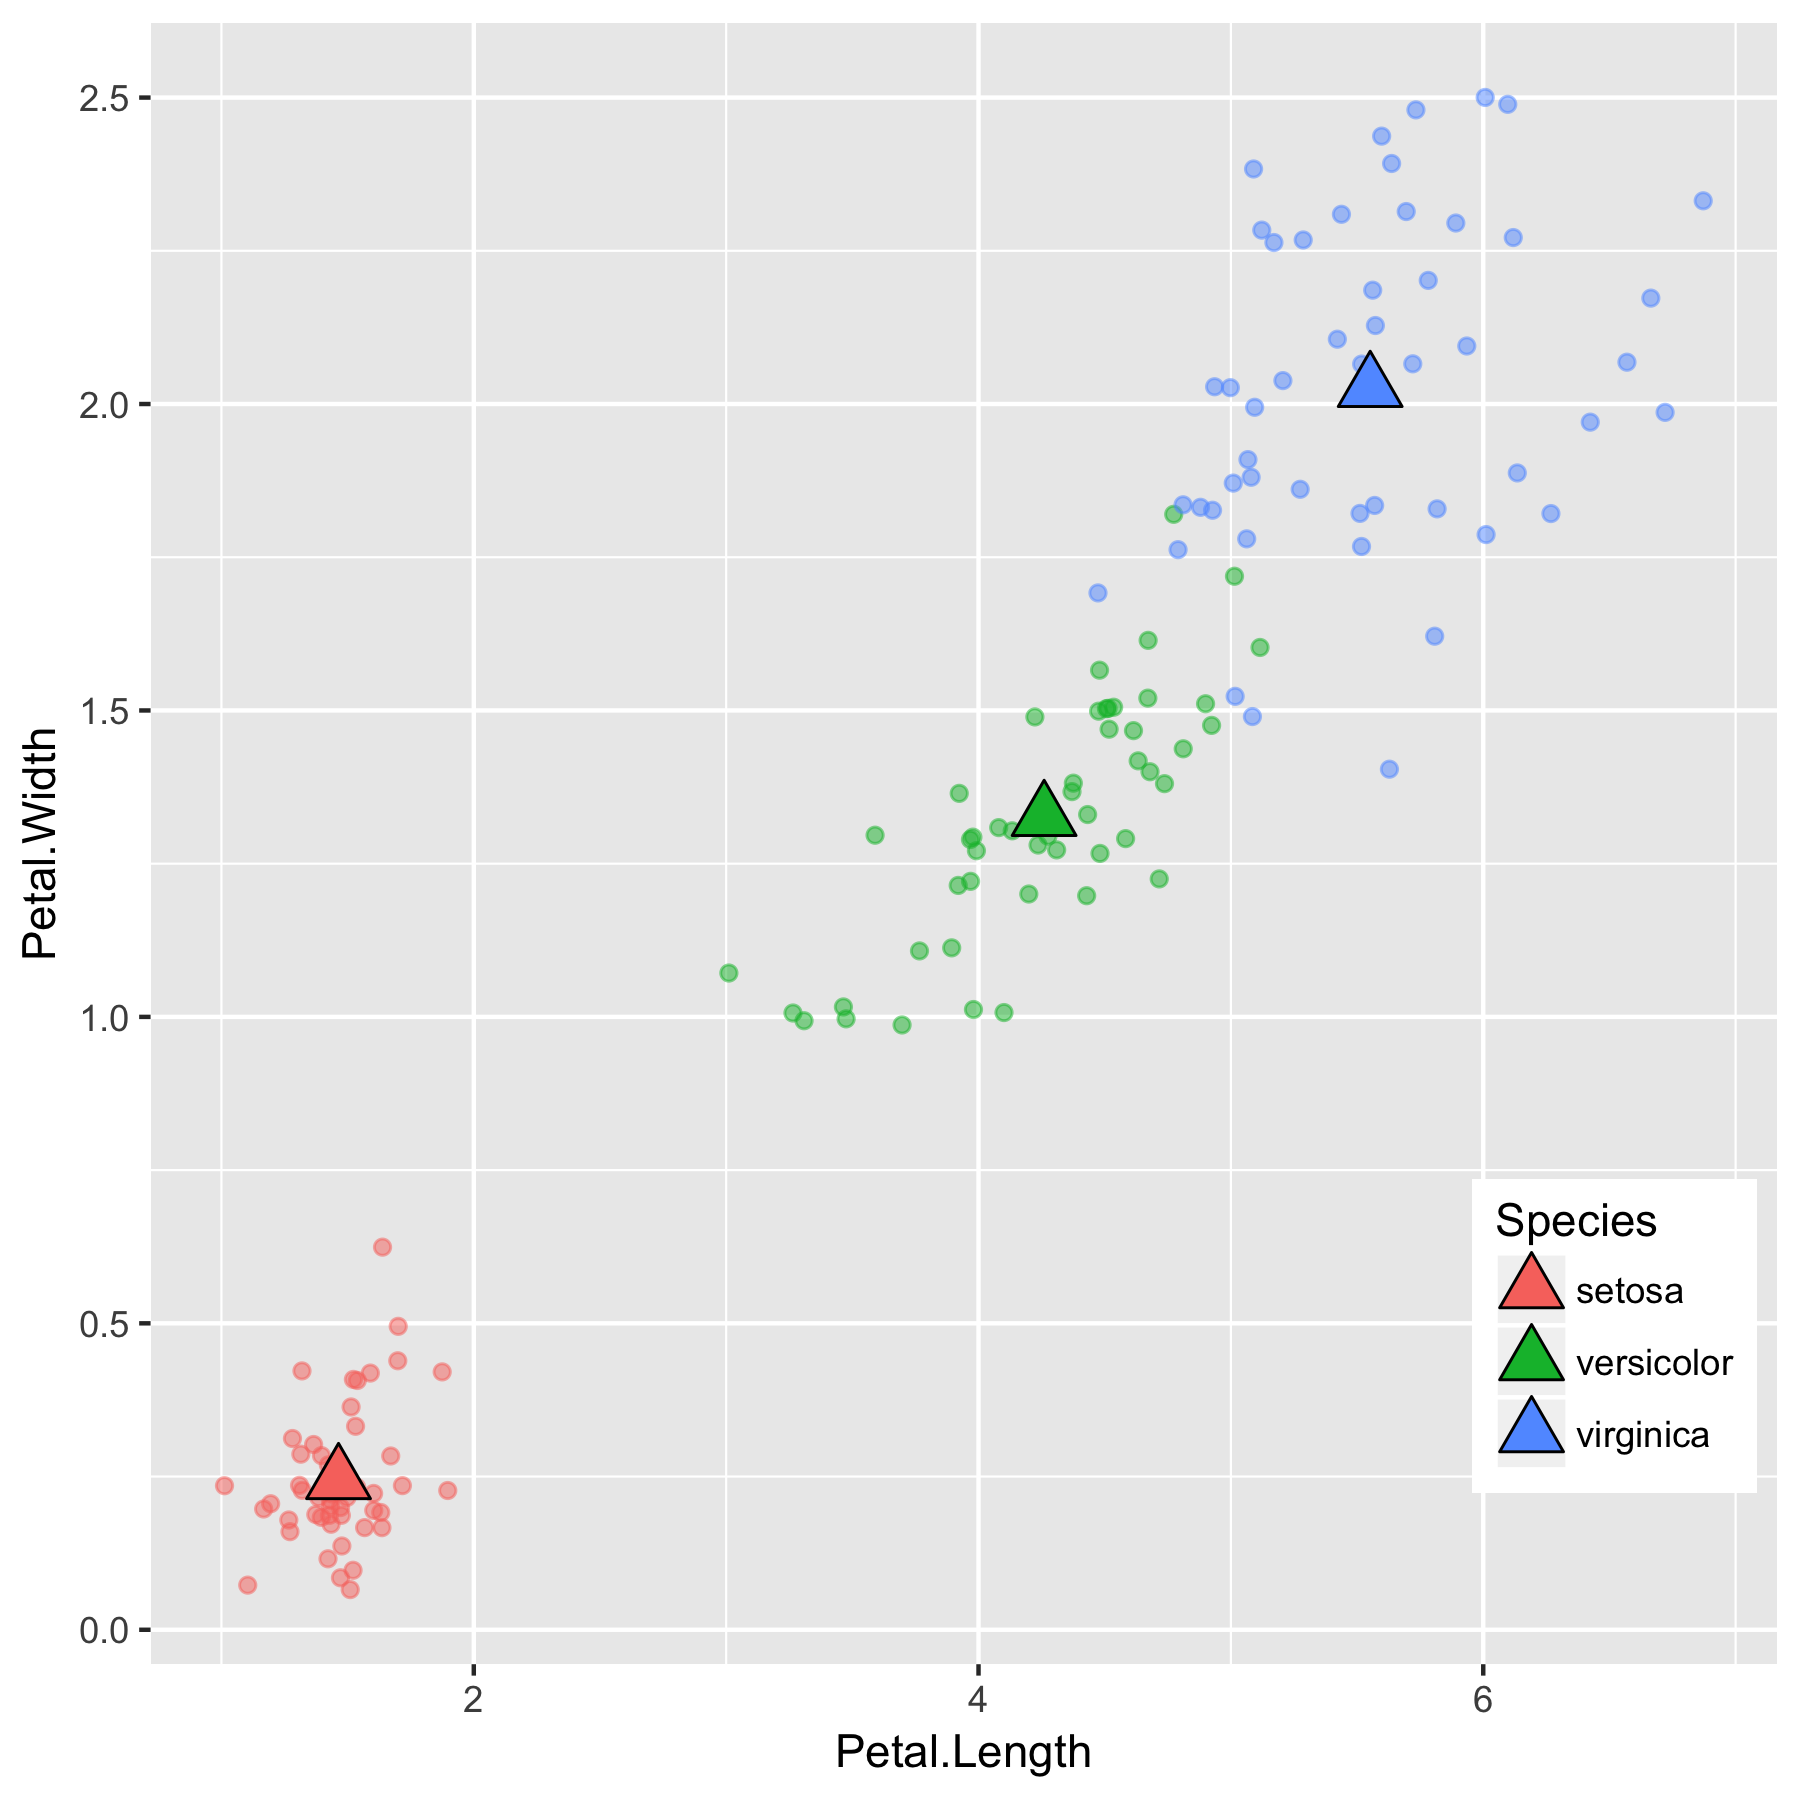
Interprétation des moyennes

Moyennes

Species Petal.Length Petal.Width
setosa 1.46 0.244
versicolor 4.26 1.326
virginica 5.55 2.026

mean

Lois de probabilité multivariées en R

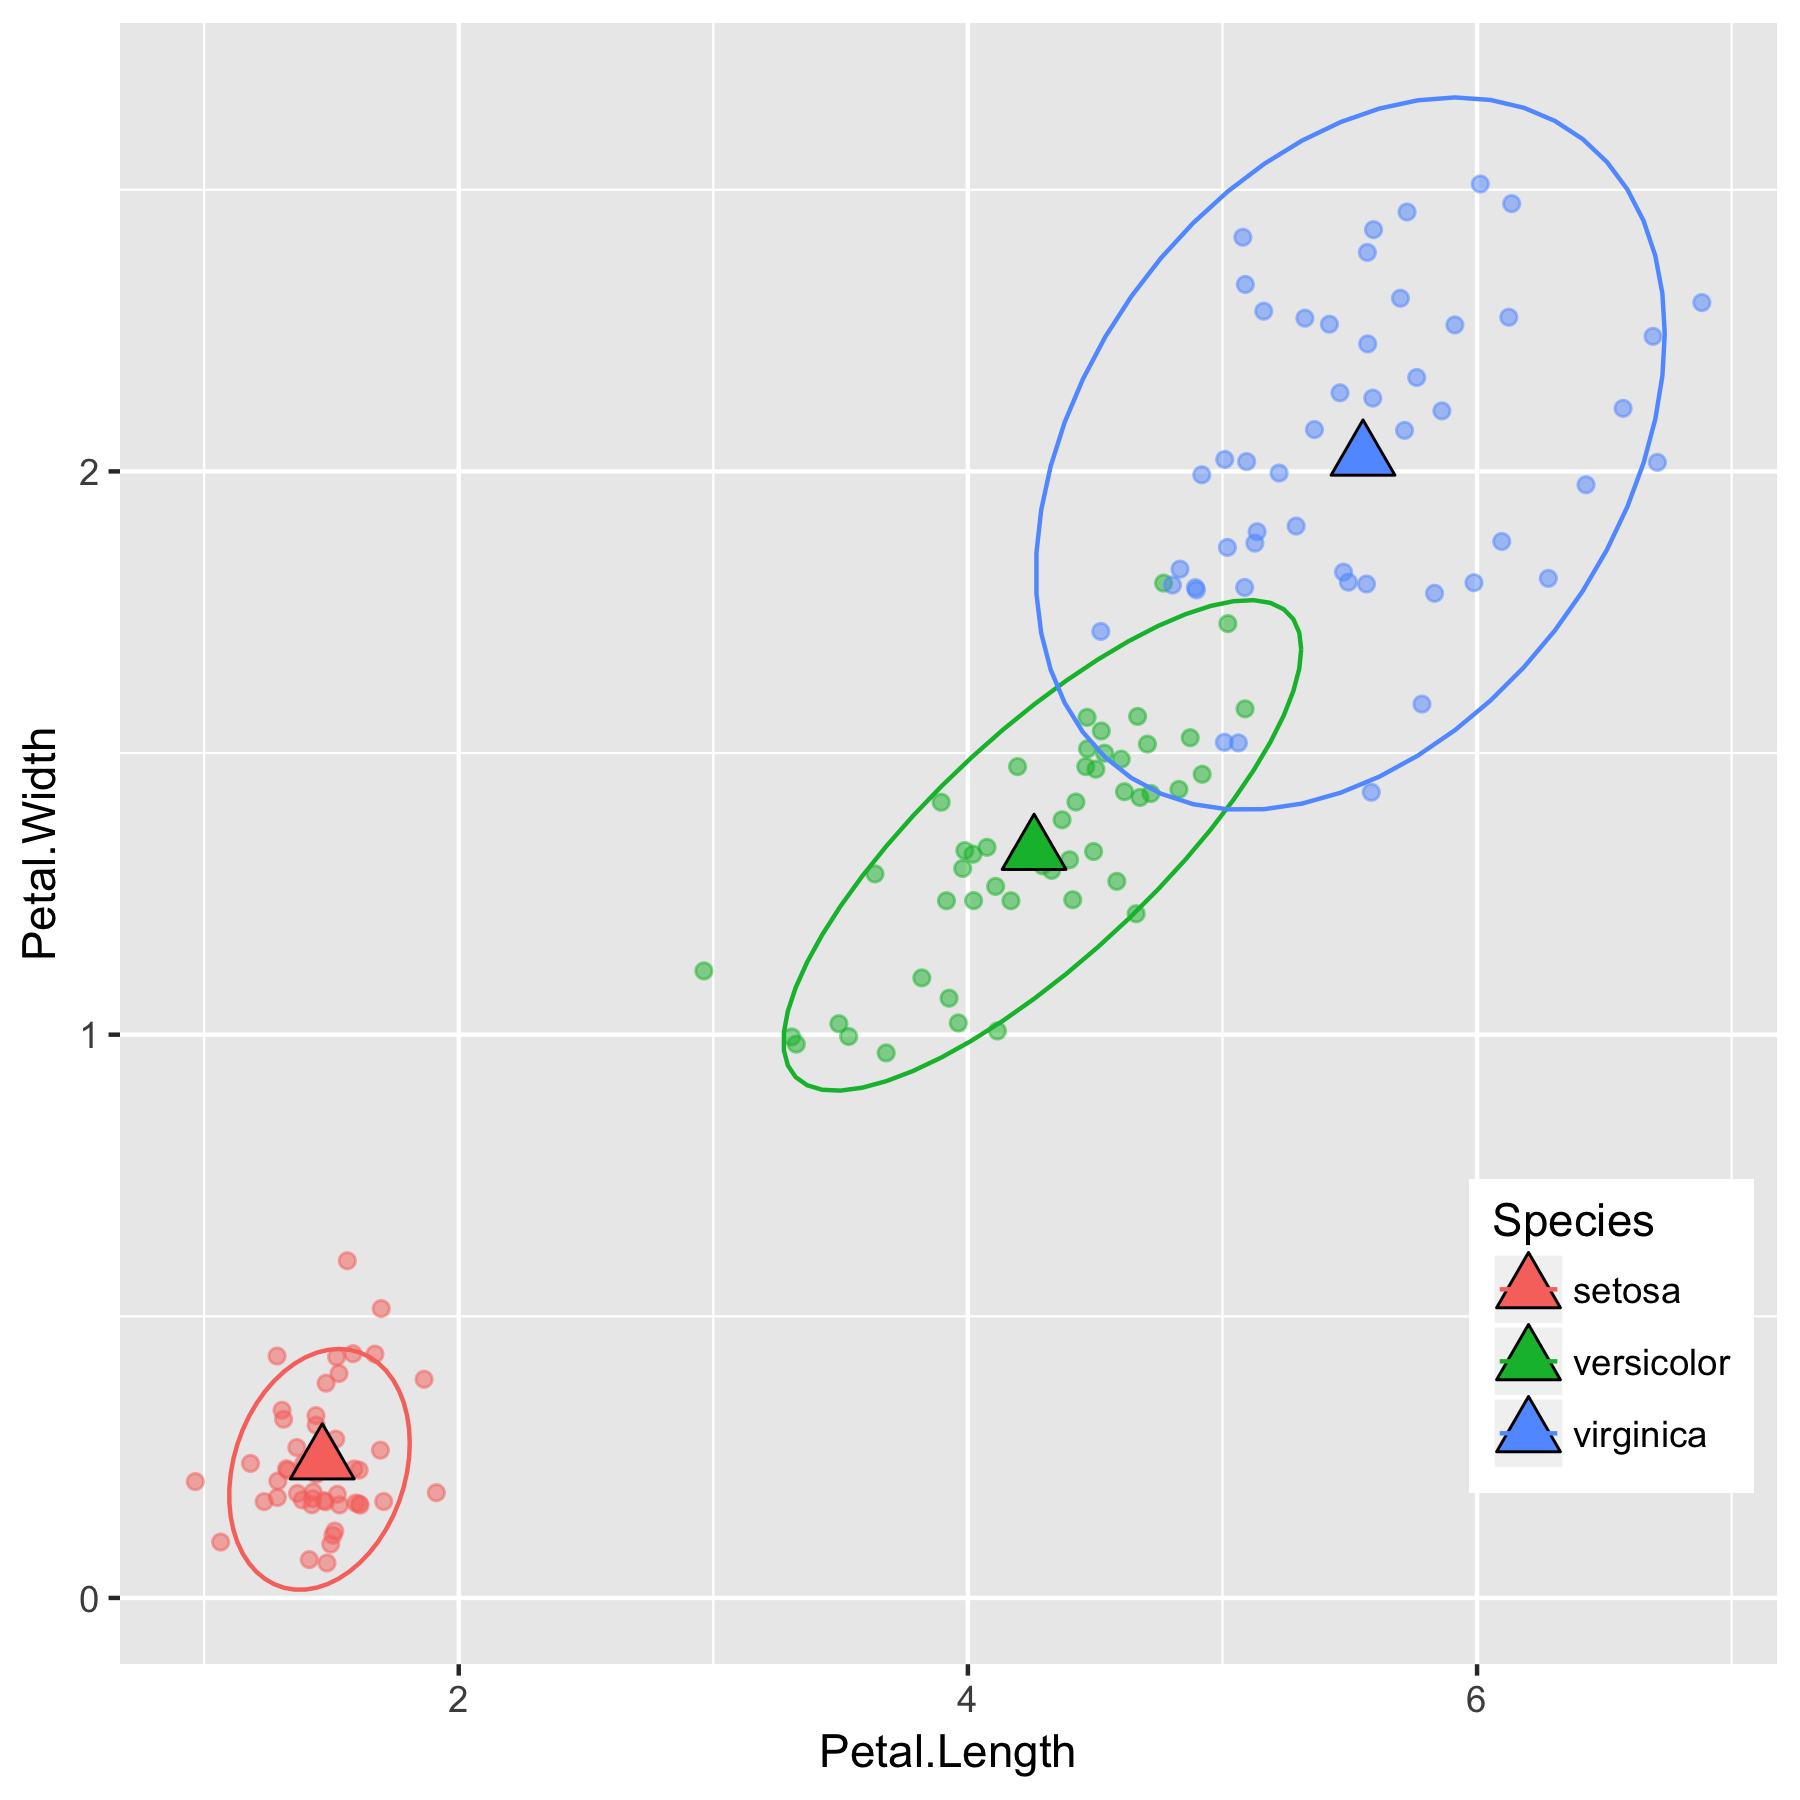
Interprétation des variances

setosa Petal.Length Petal.Width
Petal.Length 0.030 0.006
Petal.Width 0.006 0.011
versicolor Petal.Length Petal.Width
Petal.Length 0.221 0.073
Petal.Width 0.073 0.039
virginica Petal.Length Petal.Width
Petal.Length 0.305 0.049
Petal.Width 0.049 0.075

mean and variance

Lois de probabilité multivariées en R

Passons à la pratique !

Lois de probabilité multivariées en R

Preparing Video For Download...