k-nearest neighbors distance score

Introduction à la détection d’anomalies en R

Alastair Rushworth

Data Scientist

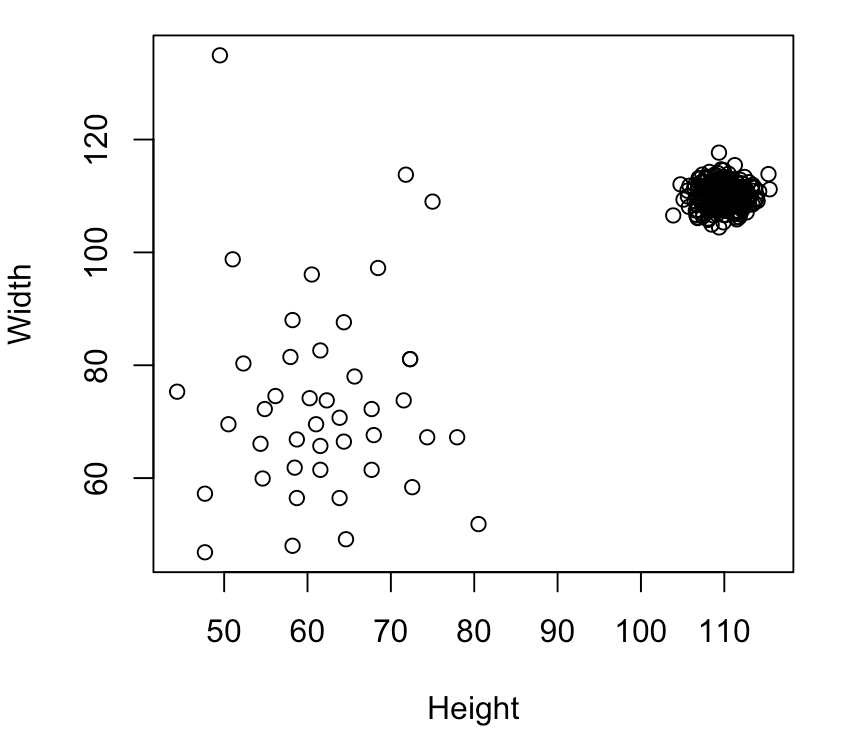
Furniture dimensions

plot(Width ~ Height, data = furniture)
Introduction à la détection d’anomalies en R

k-nearest neighbors (kNN) distance

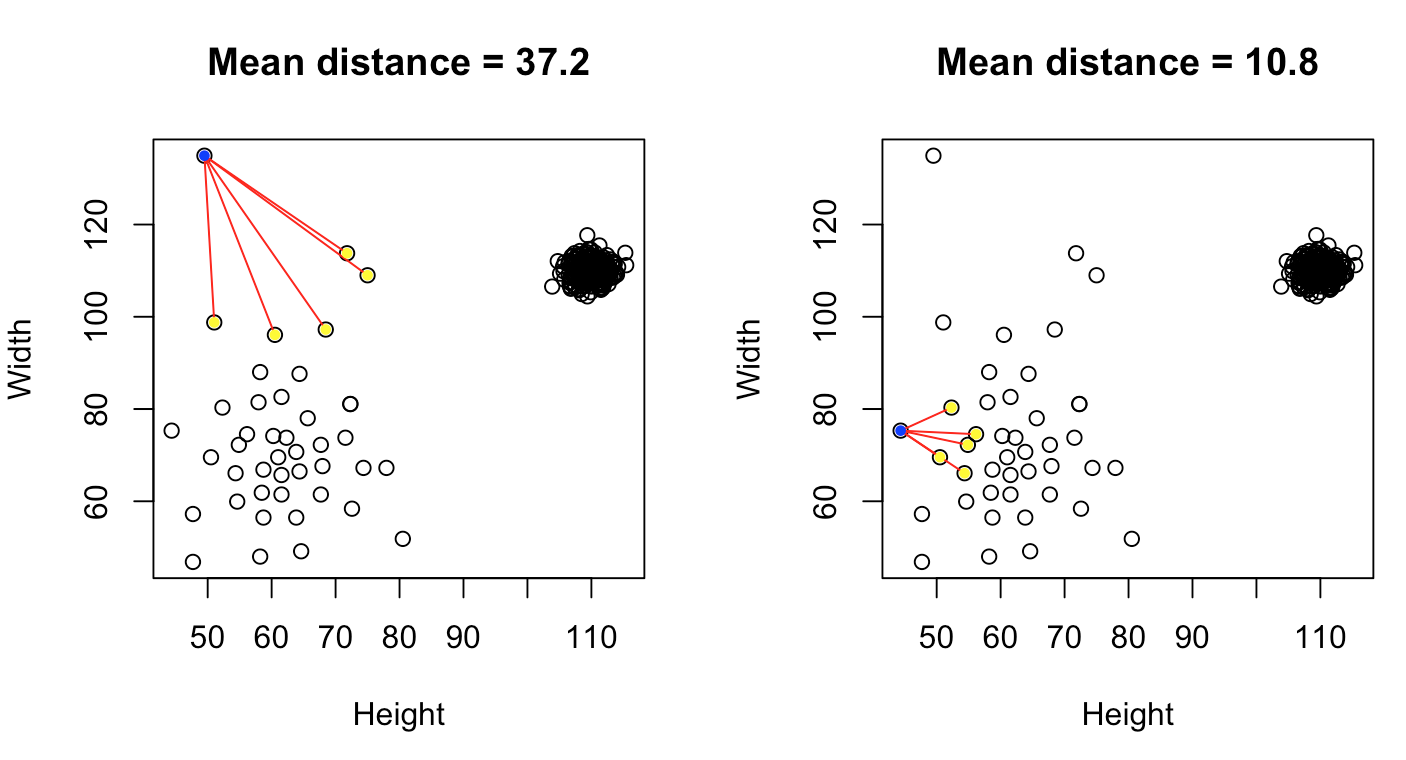
Anomalies usually lie far from their neighbors
Introduction à la détection d’anomalies en R

Inputs for distance matrix calculation

library(FNN)
furniture_knn <- get.knn(data = furniture, k = 5)


Arguments

  • data: matrix of data
  • k: the number of neighbors
Introduction à la détection d’anomalies en R

Distance matrix output

get.knn() returns two matrices

names(furniture_knn)
"nn.index" "nn.dist" 

Distance matrix

head(furniture_knn$nn.dist, 3)
         [,1]     [,2]     [,3]     [,4]     [,5]
[1,] 5.128300 5.367791 5.390801 5.740713 8.477025
[2,] 4.300093 5.367791 6.159139 7.091966 7.428176
[3,] 3.047502 3.545978 4.426266 5.006570 5.654202
Introduction à la détection d’anomalies en R

kNN distance score

Average distance to nearest neighbors

furniture_score <- rowMeans(furniture_knn$nn.dist)


Largest score?

which.max(furniture_score)
29
Introduction à la détection d’anomalies en R

Let's practice!

Introduction à la détection d’anomalies en R

Preparing Video For Download...