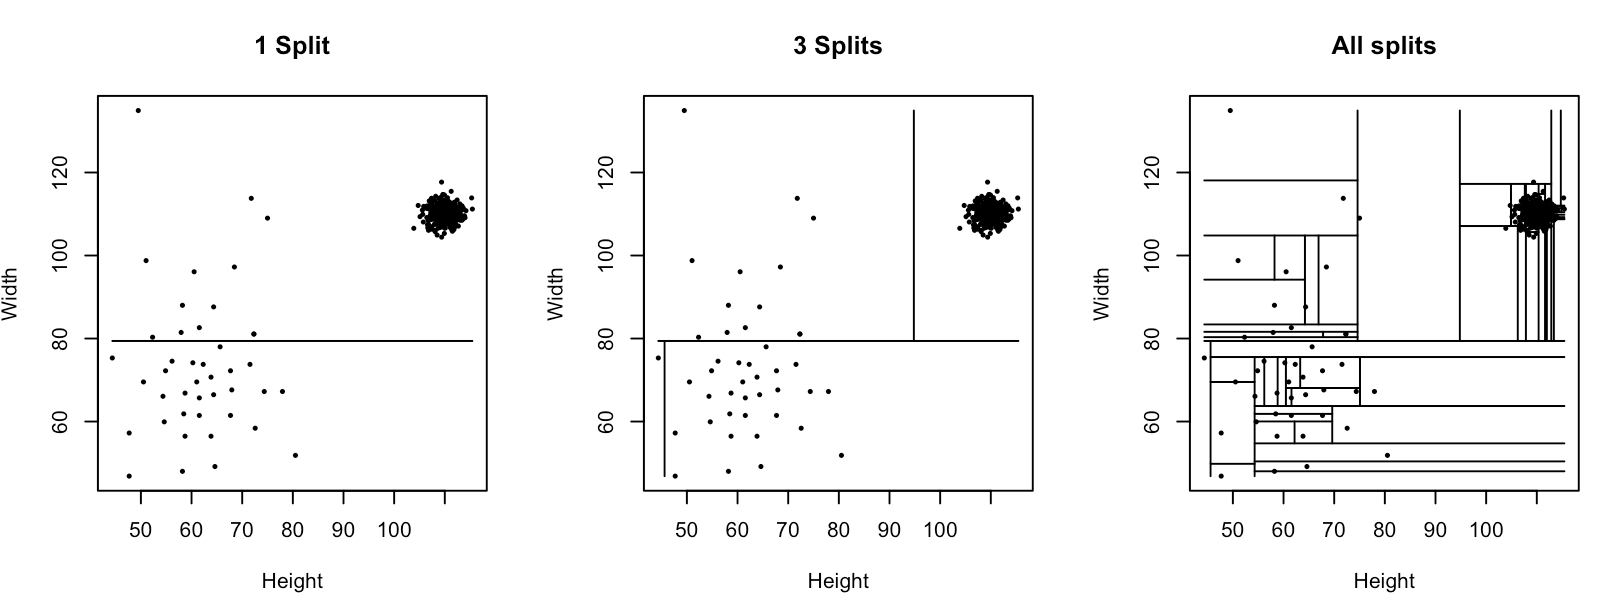
Introduction à la détection d’anomalies en R
Alastair Rushworth
Data Scientist
library(isofor)

furniture_tree <- iForest(data = furniture, nt = 1)
library(isofor)
furniture_tree <- iForest(data = furniture, nt = 1)
iForest() arguments
iForest()
data
nt
Package download from https://github.com/Zelazny7/isofor
furniture_score <- predict(furniture_tree, newdata = furniture)
predict() arguments
predict()
object
iForest
newdata
furniture_score[1:10]
[1] 0.5820092 0.5820092 0.5439338 0.5820092 0.5439338
[6] 0.5820092 0.7129862 0.5363547 0.5363547 0.5363547
Standardized path length