Grundlagen der Clusteranalyse

Cluster Analysis in Python

Shaumik Daityari

Business Analyst

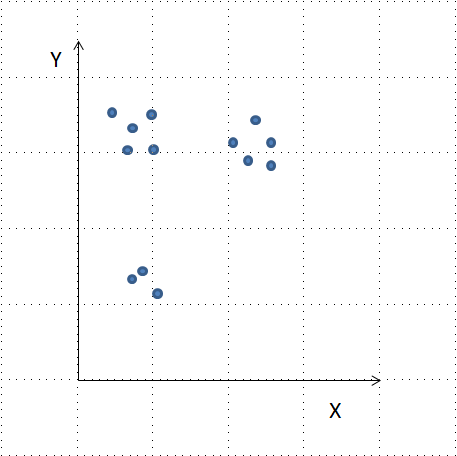
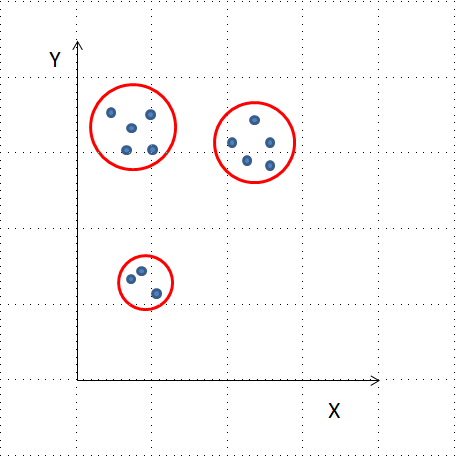
Was ist ein Cluster?

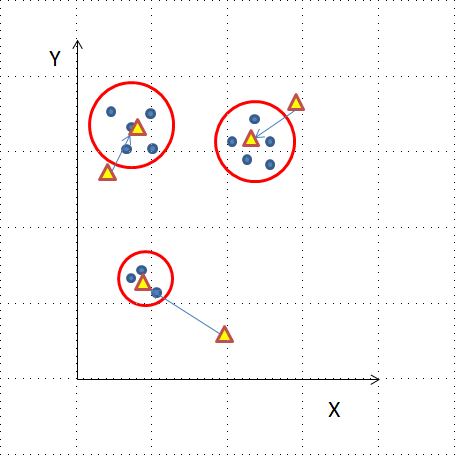
  • Eine Gruppe von Objekten mit ähnlichen Merkmalen
  • Google News: Artikel mit ähnlichen Wörtern und Wortbezügen
  • Kundensegmente

Cluster Analysis in Python

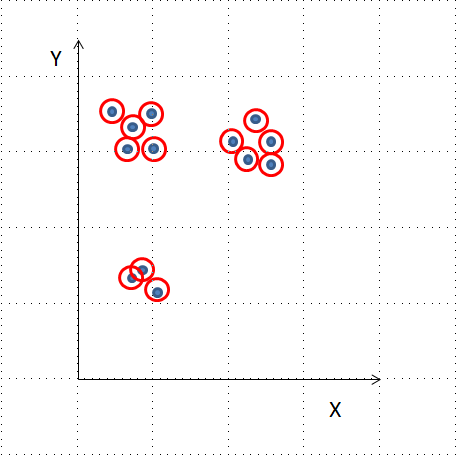
Clustering-Algorithmen

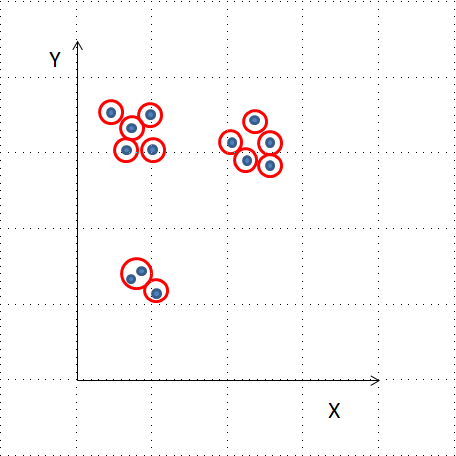
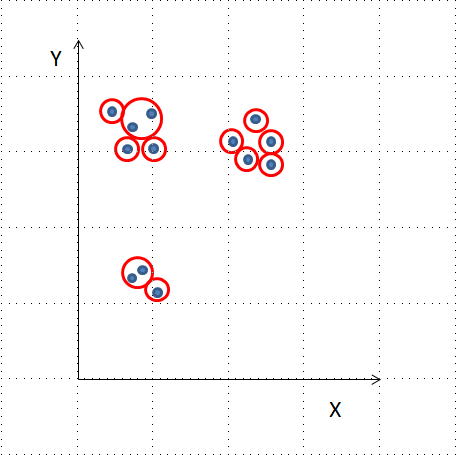
  • Hierarchisches Clustering
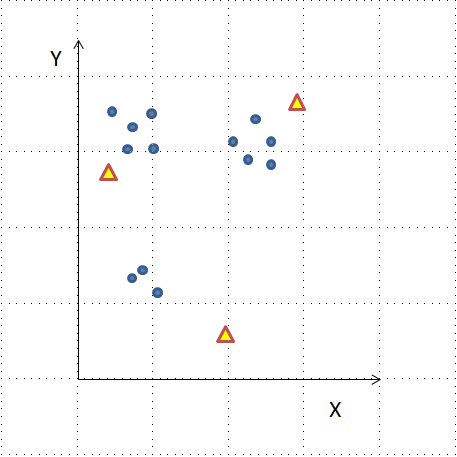
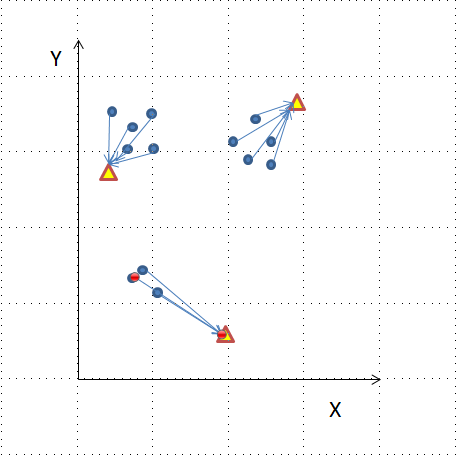
  • K-Means-Clustering
  • Weitere Verfahren: DBSCAN, Gaußsche Methoden
Cluster Analysis in Python

Cluster Analysis in Python

Cluster Analysis in Python

Cluster Analysis in Python

Cluster Analysis in Python

Cluster Analysis in Python

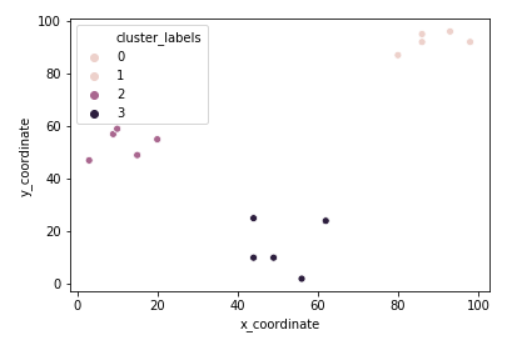
Hierarchisches Clustering in SciPy

from scipy.cluster.hierarchy import linkage, fcluster
from matplotlib import pyplot as plt
import seaborn as sns, pandas as pd
x_coordinates = [80.1, 93.1, 86.6, 98.5, 86.4, 9.5, 15.2, 3.4, 
                 10.4, 20.3, 44.2, 56.8, 49.2, 62.5, 44.0]
y_coordinates = [87.2, 96.1, 95.6, 92.4, 92.4, 57.7, 49.4, 
                 47.3, 59.1, 55.5, 25.6, 2.1, 10.9, 24.1, 10.3]

df = pd.DataFrame({'x_coordinate': x_coordinates,
                   'y_coordinate': y_coordinates})
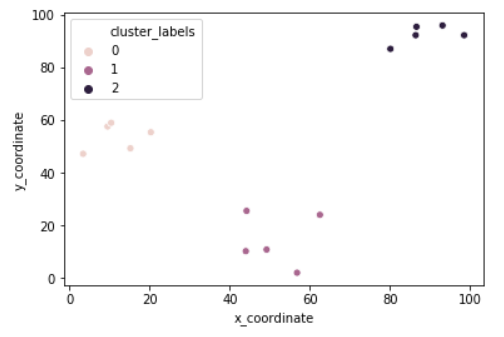
Z = linkage(df, 'ward')
df['cluster_labels'] = fcluster(Z, 3, criterion='maxclust')
sns.scatterplot(x='x_coordinate', y='y_coordinate', 
                hue='cluster_labels', data = df)
plt.show()
Cluster Analysis in Python

Cluster Analysis in Python

Cluster Analysis in Python

Cluster Analysis in Python

Cluster Analysis in Python

Cluster Analysis in Python

K-Means in SciPy

from scipy.cluster.vq import kmeans, vq
from matplotlib import pyplot as plt
import seaborn as sns, pandas as pd

import random
random.seed((1000,2000))
x_coordinates = [80.1, 93.1, 86.6, 98.5, 86.4, 9.5, 15.2, 3.4, 
                 10.4, 20.3, 44.2, 56.8, 49.2, 62.5, 44.0]
y_coordinates = [87.2, 96.1, 95.6, 92.4, 92.4, 57.7, 49.4, 
                 47.3, 59.1, 55.5, 25.6, 2.1, 10.9, 24.1, 10.3]

df = pd.DataFrame({'x_coordinate': x_coordinates, 'y_coordinate': y_coordinates})
centroids,_ = kmeans(df, 3)
df['cluster_labels'], _ = vq(df, centroids)
sns.scatterplot(x='x_coordinate', y='y_coordinate', 
                hue='cluster_labels', data = df)
plt.show()
Cluster Analysis in Python

Cluster Analysis in Python

Als Nächstes: Praxisaufgaben

Cluster Analysis in Python

Preparing Video For Download...