Zeitreihen in R bearbeiten
Harrison Brown
Graduate Researcher in Geography
Rolling Window:
Expanding Window:
Zunehmende Fensterbreite:
Was ist die Zusammenfassung der verfügbaren Daten?
Fester Startpunkt:

Expanding Windows in R:
zoo::rollapply()!width kann Zahl oder Vektor seinExpanding-Fensterbreite:
1, 2, 3, 4, ...Funktion für Zahlenfolge:
base::seq_along()seq_along(daily_temp)
[1] 1 2 3 4 5 6 7 8 9 ...
... 363 364 365
exp_widths <- seq_along(daily_temp)
exp_widths
[1] 1 2 3 4 5 ... 363 364 365
temp_expand <-
rollapply(
data = daily_temp,
FUN = mean,
width = exp_widths,
# Ausrichtung muss 'right' sein
align = 'right'
)
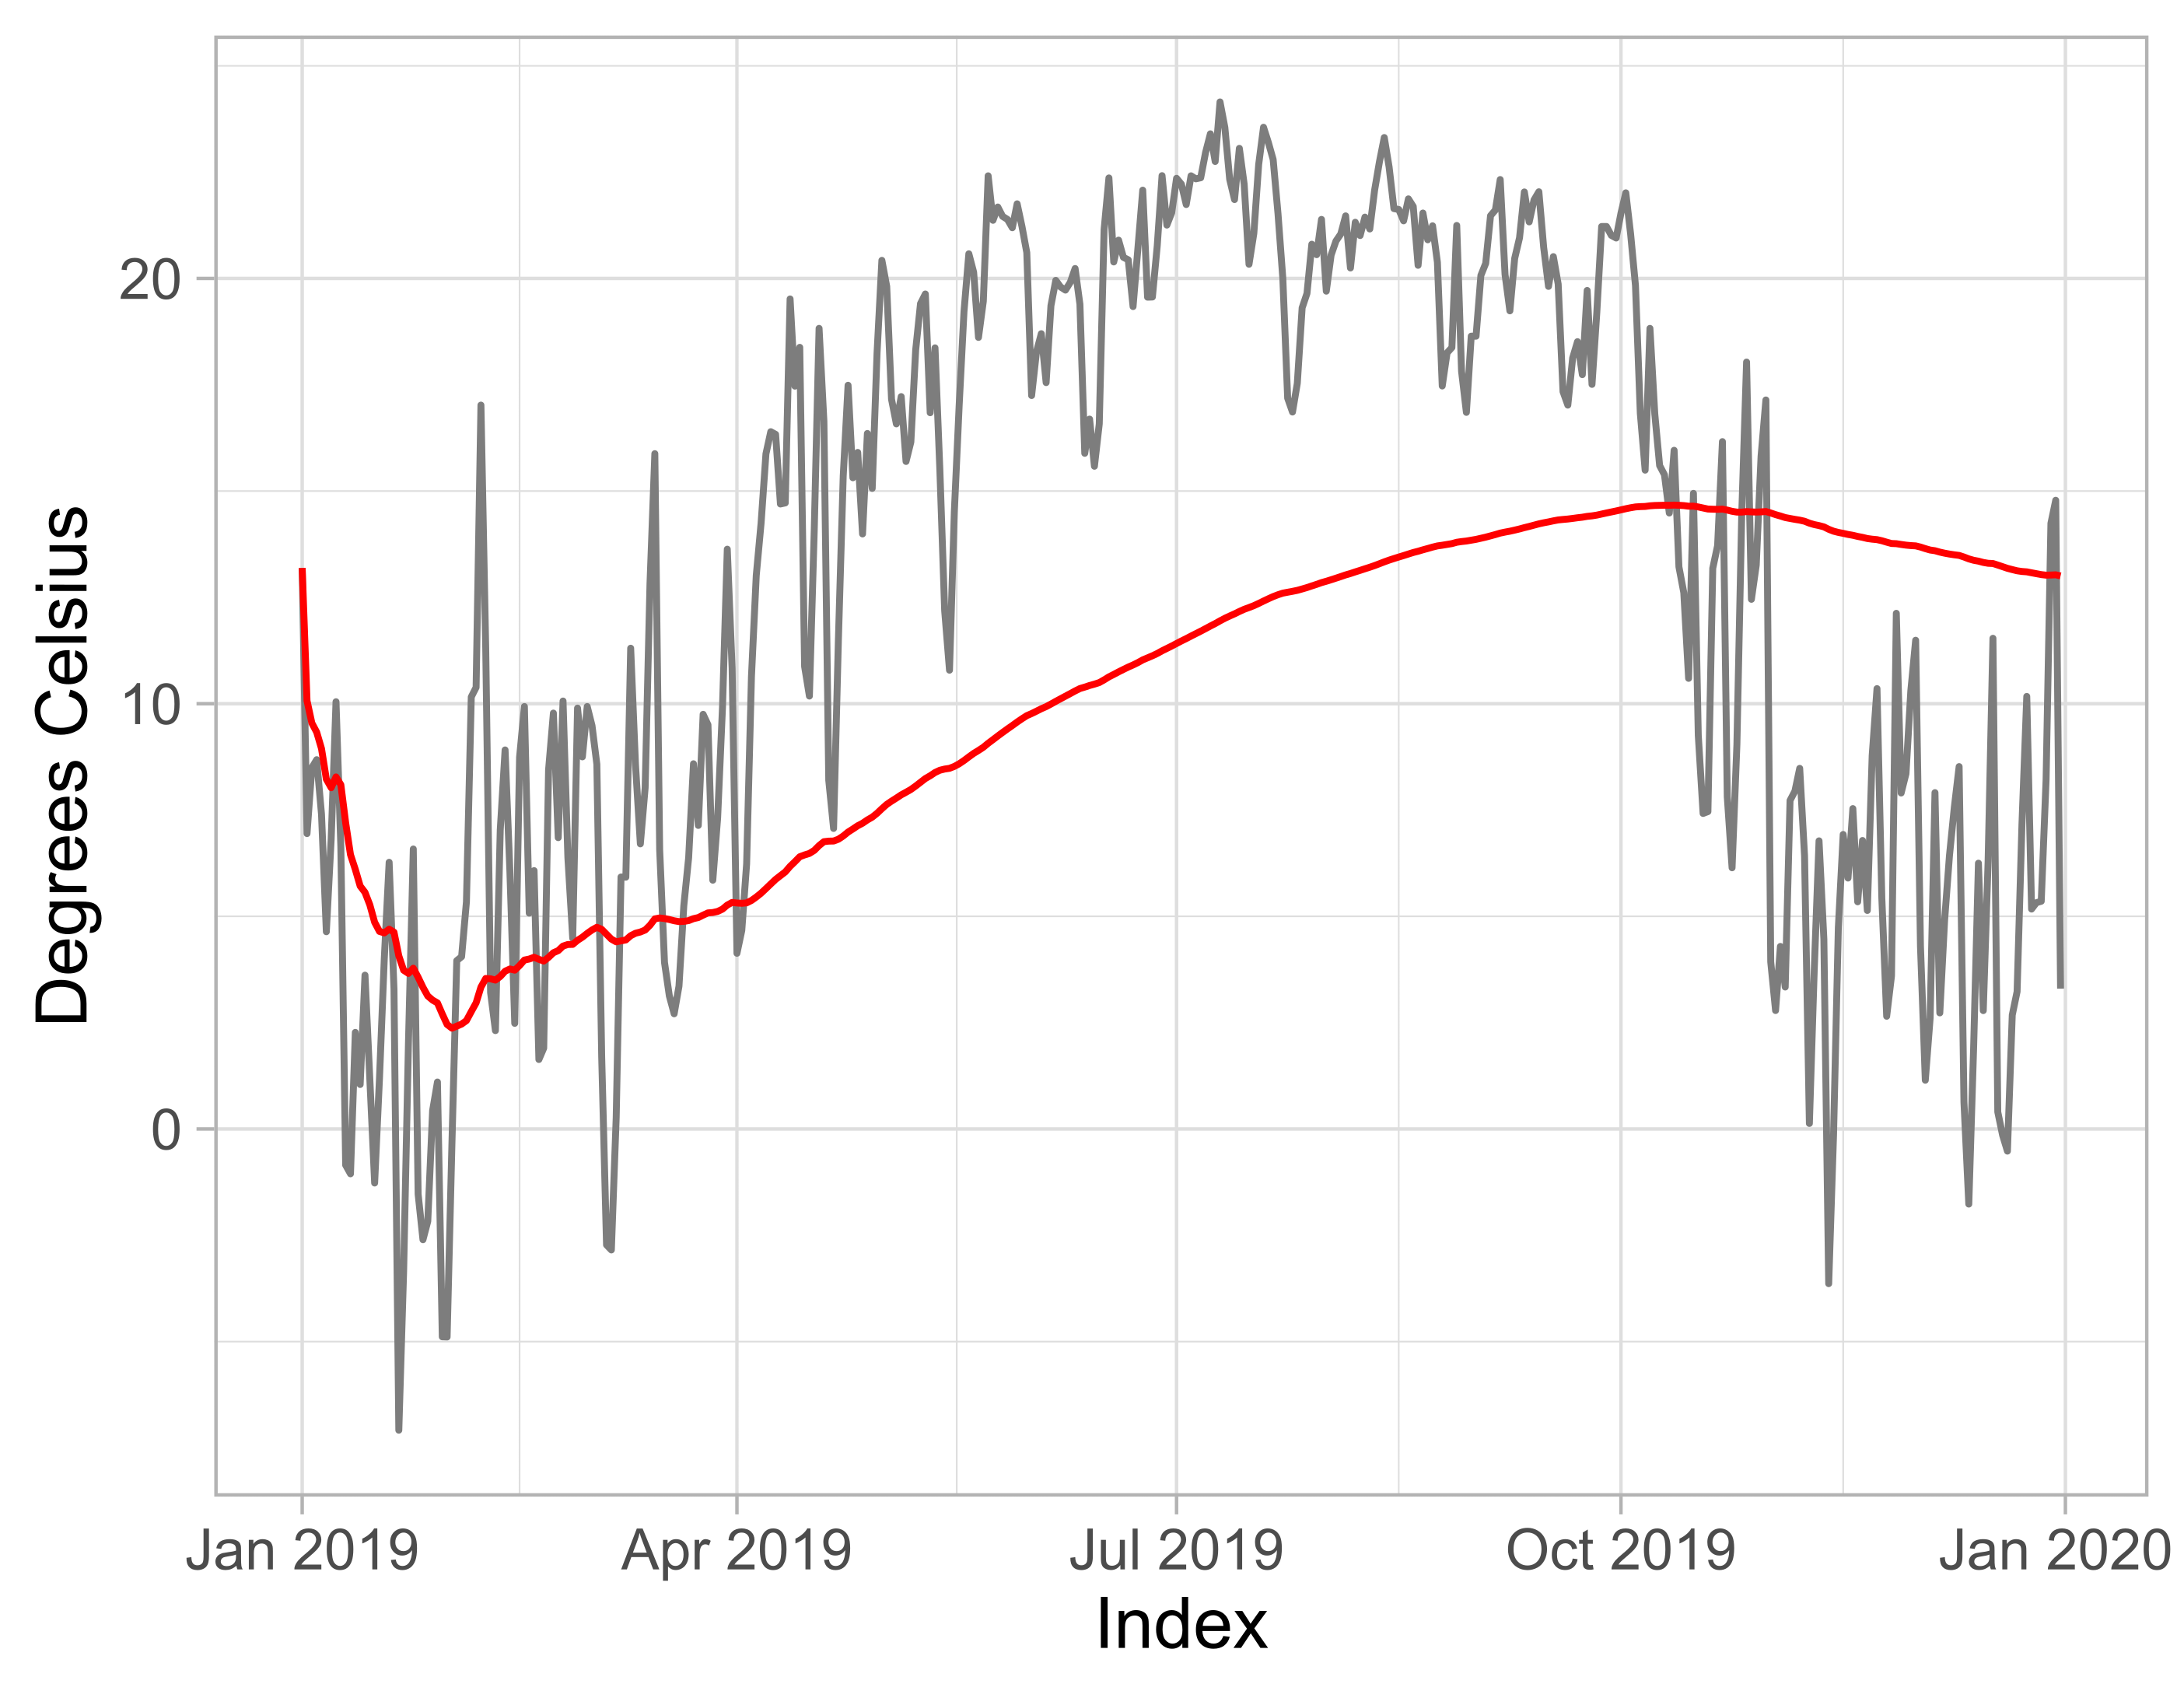
ggplot() + # Originaldaten geom_line(data = daily_temp, aes(x = Index, y = daily_temp), color = 'grey50') +# Expanding-Window-Plot geom_line(data = temp_expand, aes(x = Index, y = temp_expand), color = 'red') + theme_light() + labs(y = 'Grad Celsius')


Zeitreihen in R bearbeiten