Fortgeschrittenes CSS in Dash
Dashboards mit Dash und Plotly erstellen

Alex Scriven
Data Scientist
CSS für Abstände zwischen Objekten
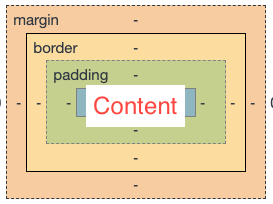
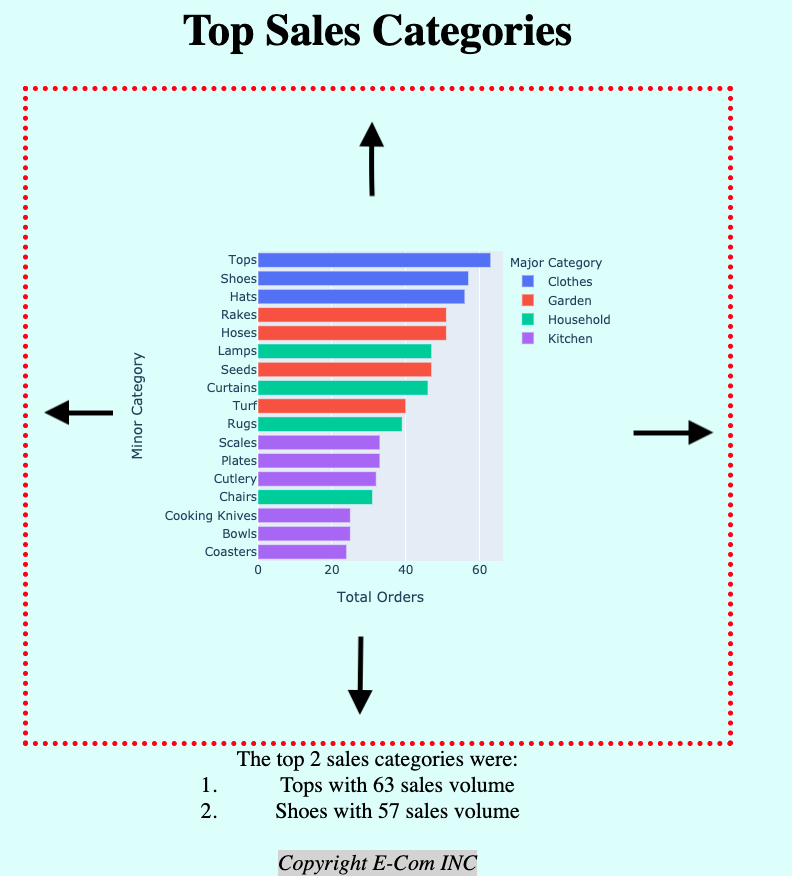
Das „Box Model" betrachtet jedes HTML-Element als Box mit Schichten:
- Inhalt des Objekts (Eigenschaften
height&width) - Padding (außerhalb des Inhalts)
- Border (zwischen Padding und Margin)
- Margin (außerhalb der Border, trennt Elemente)
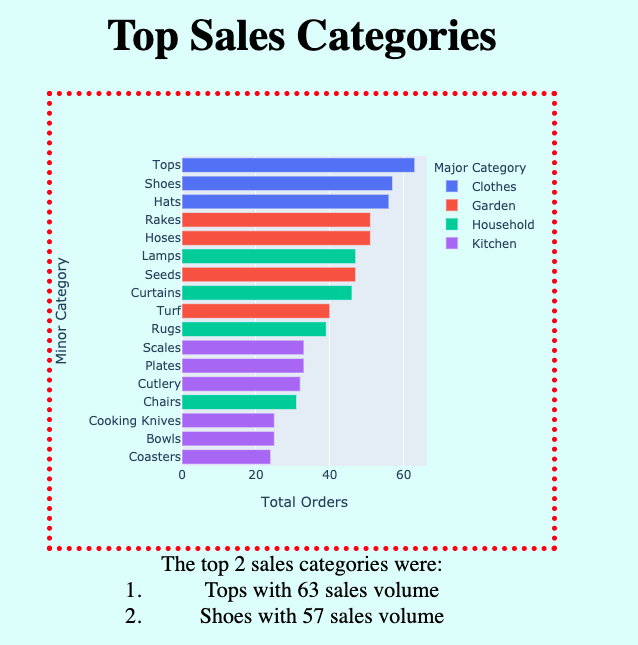
Eine Border in unserer App
CSS-Abstände
$$
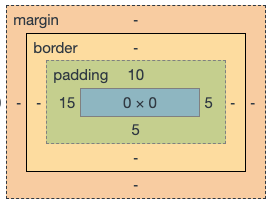
Padding in Dash hinzufügen
Kein Padding:
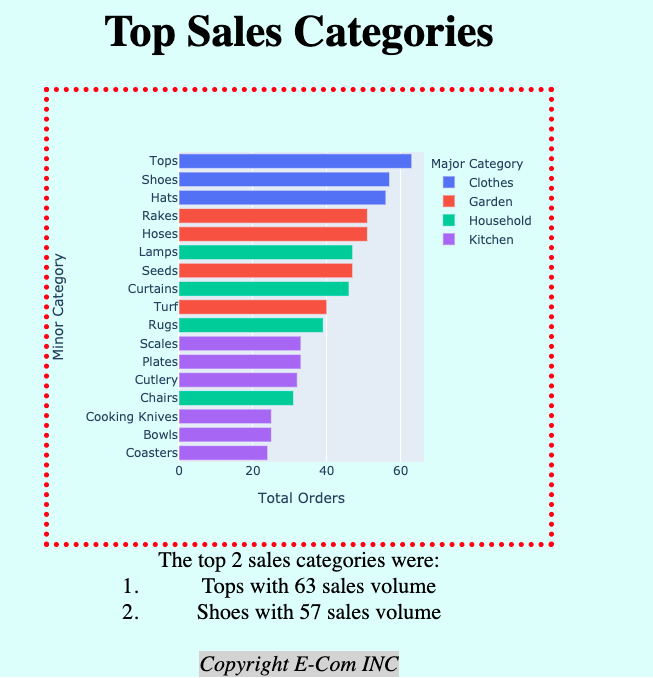
Mit 'padding':'100px':
Margin in Dash hinzufügen
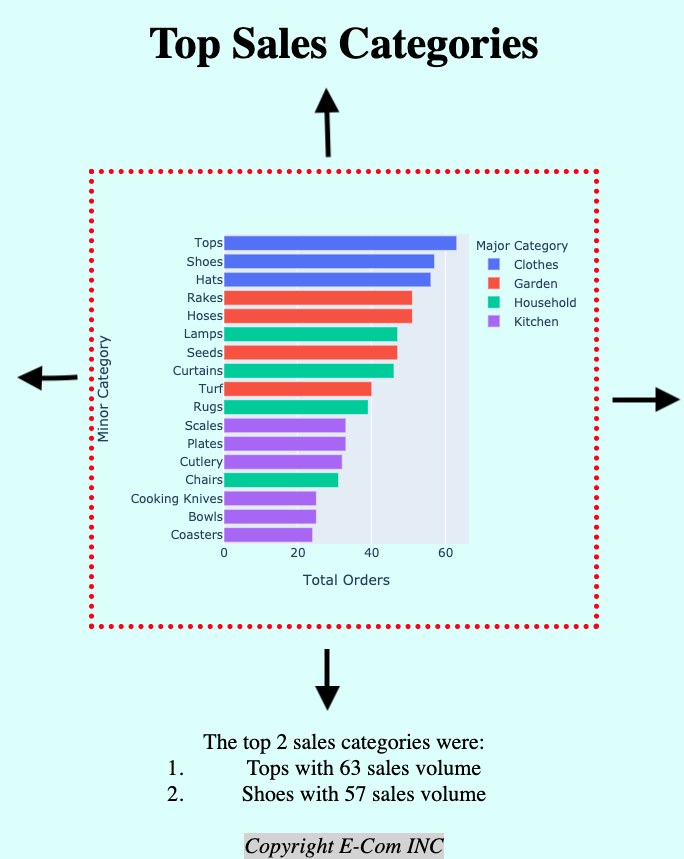
Kein Margin:
Mit margin: 100px auto:
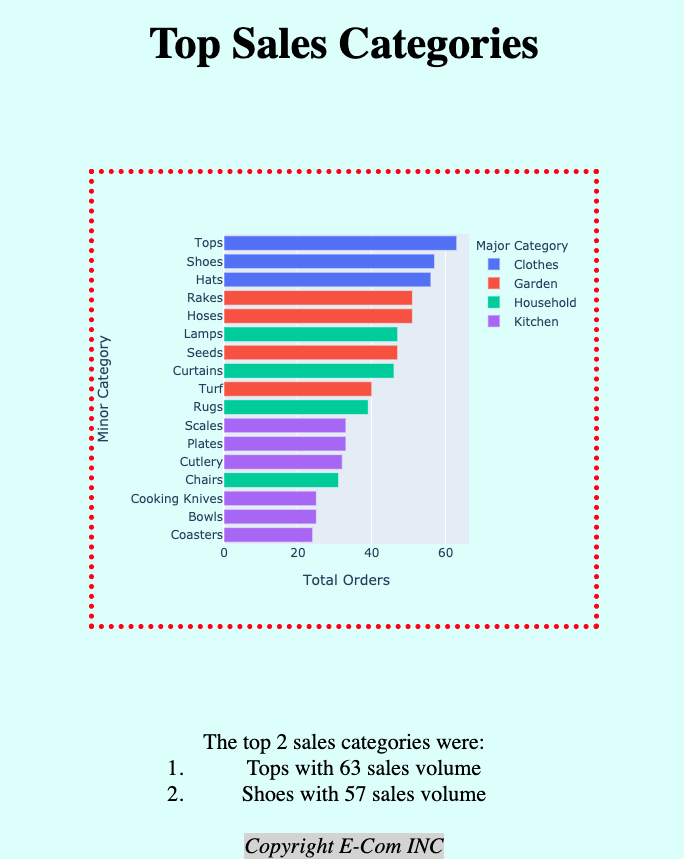
Zentrieren mit Auto-Margin
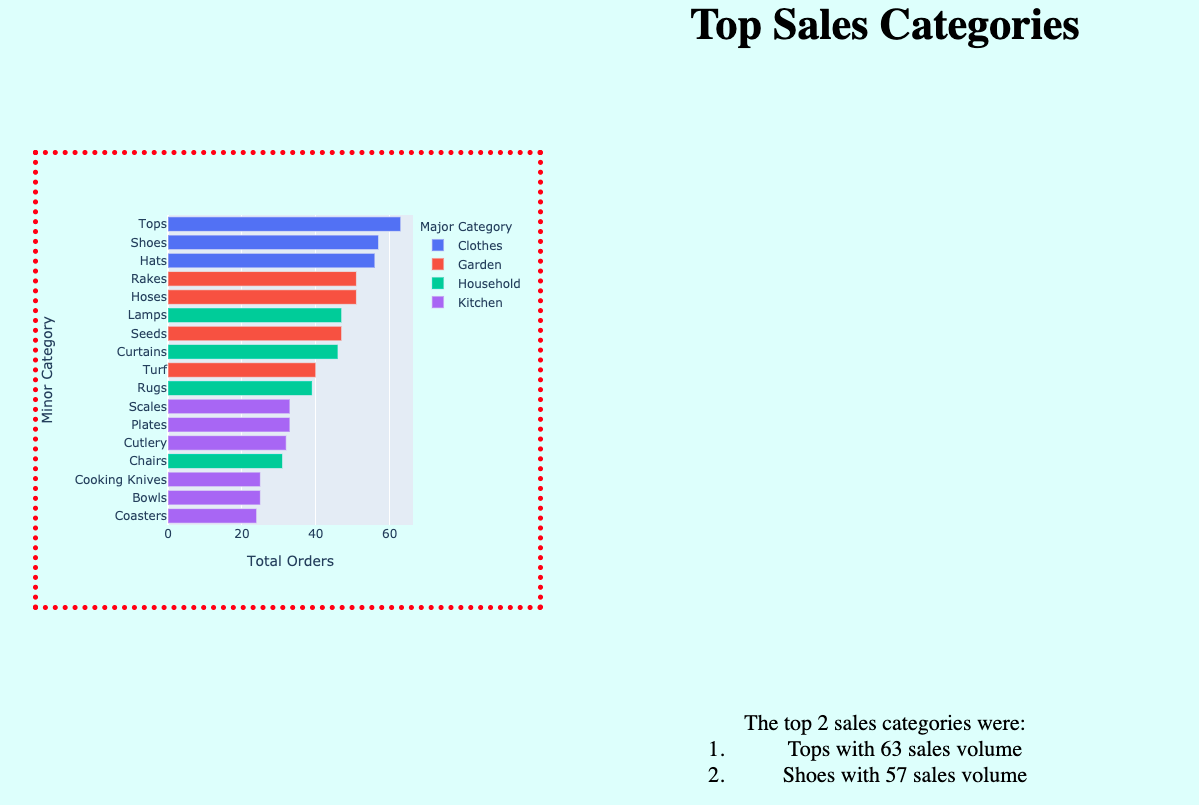
Mit: 'margin':'100px'
Mit: 'margin':'100px auto'
Inline-Block-Elemente
$$