Unüberwachtes Lernen in R
Hank Roark
Senior Data Scientist at Boeing
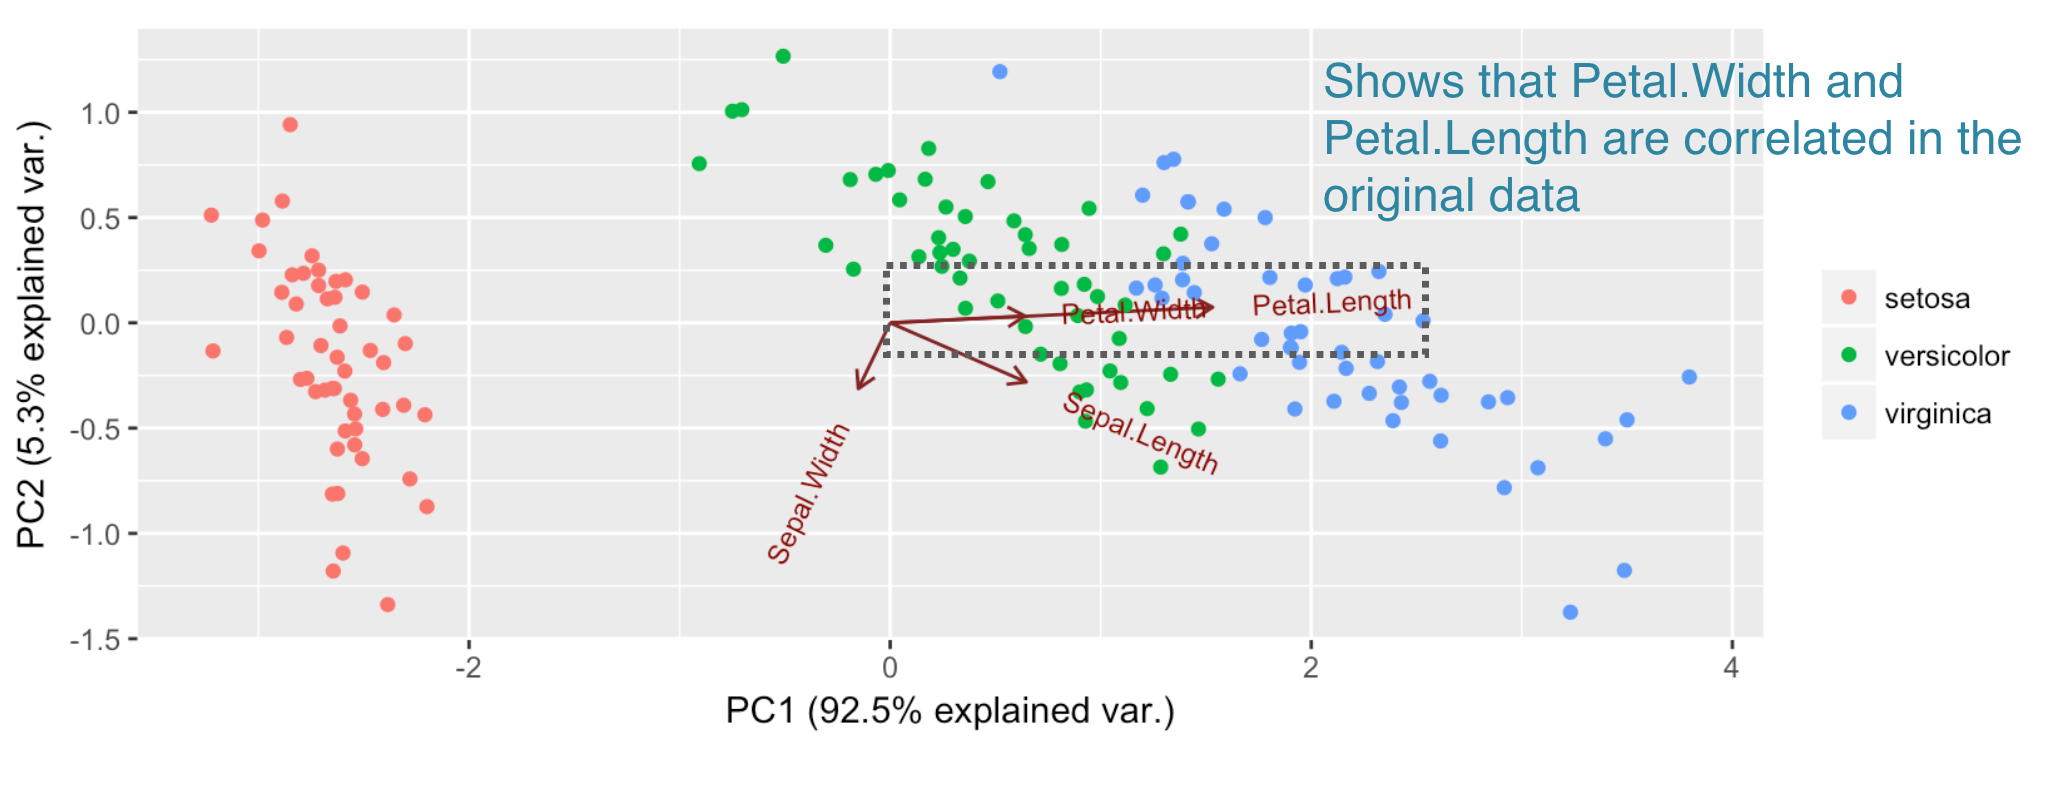
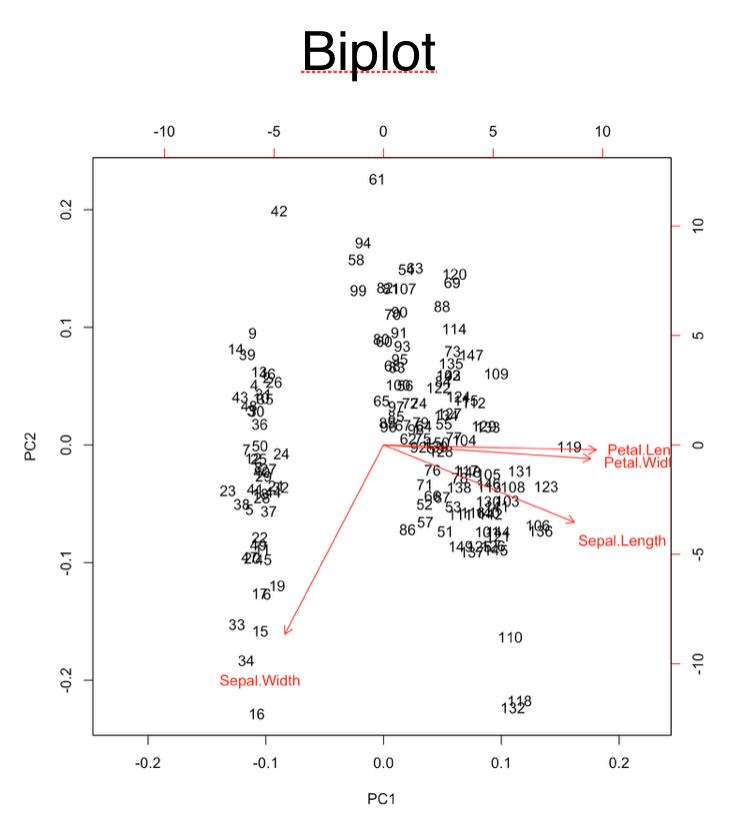
# Creating a biplot
pr.iris <- prcomp(x = iris[-5],
                  scale = FALSE,
                  center = TRUE)
biplot(pr.iris)
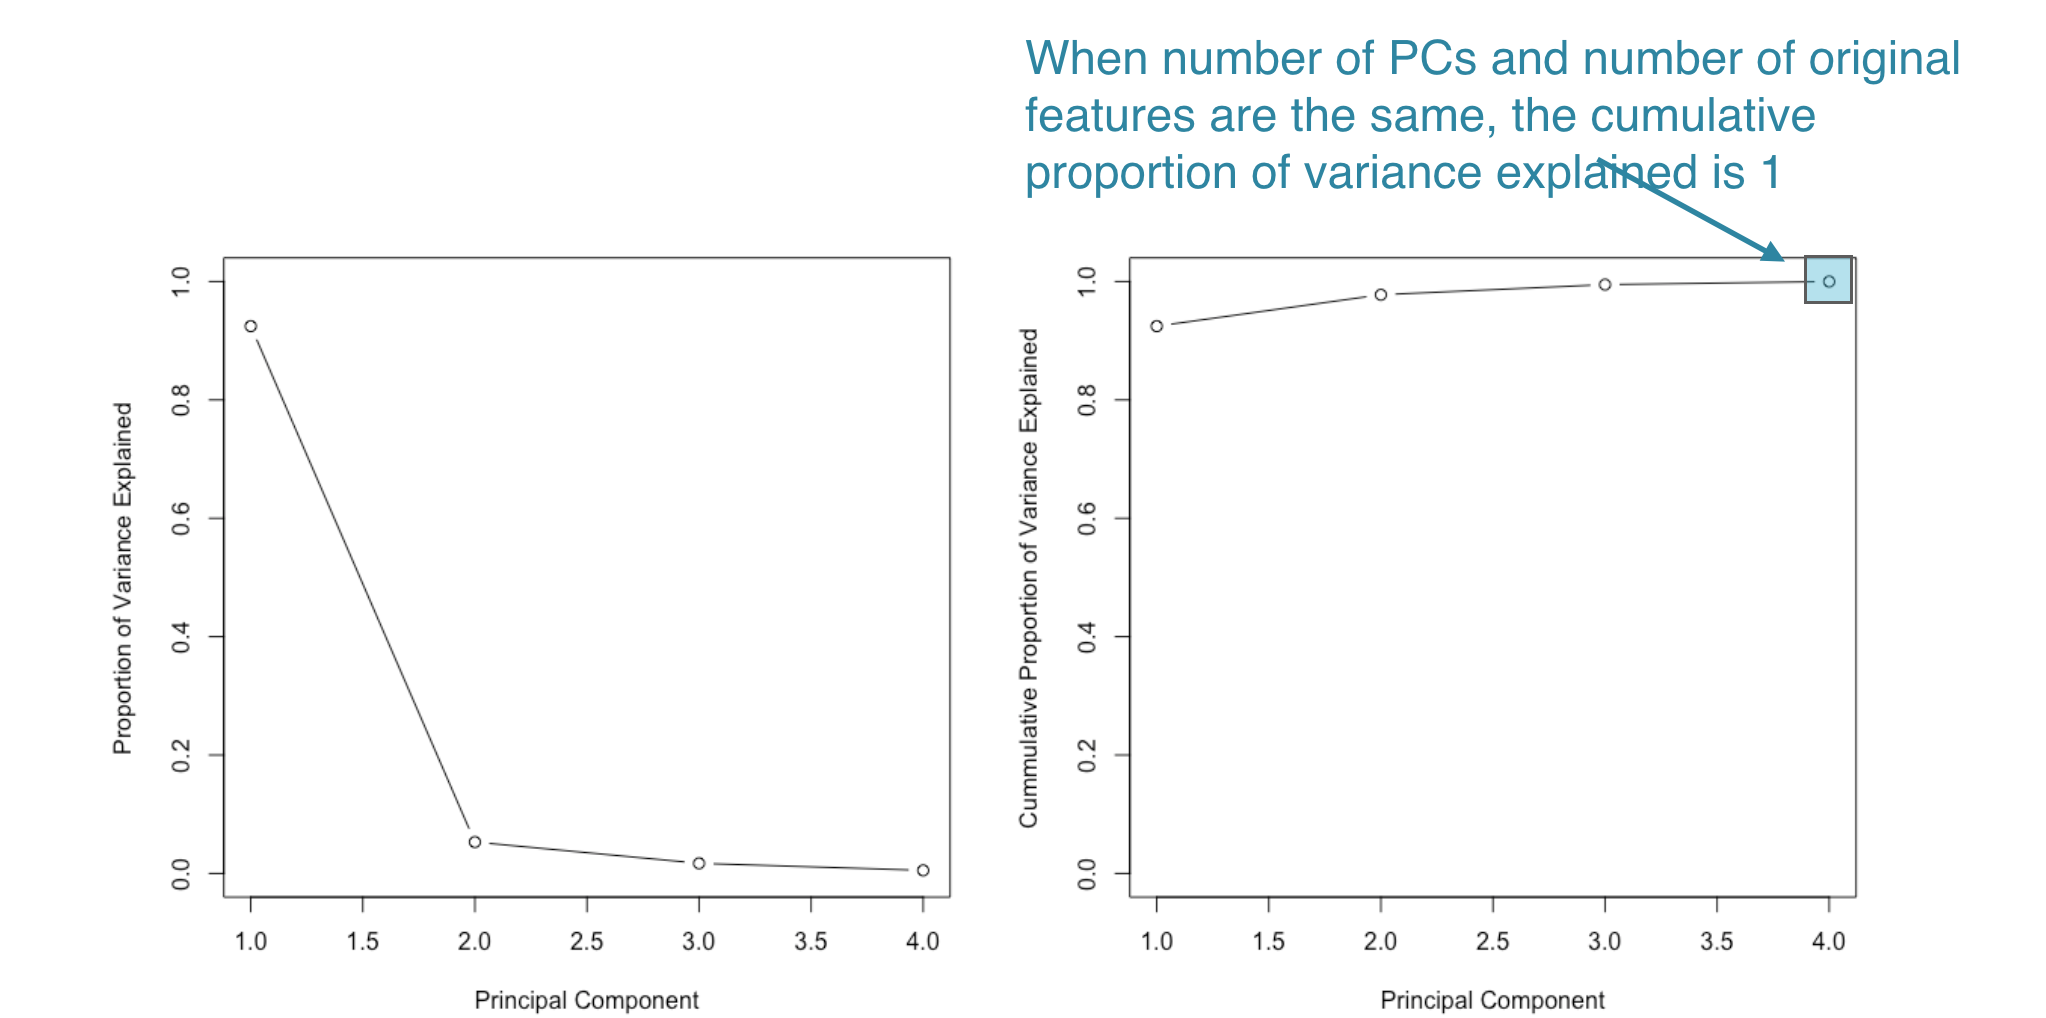
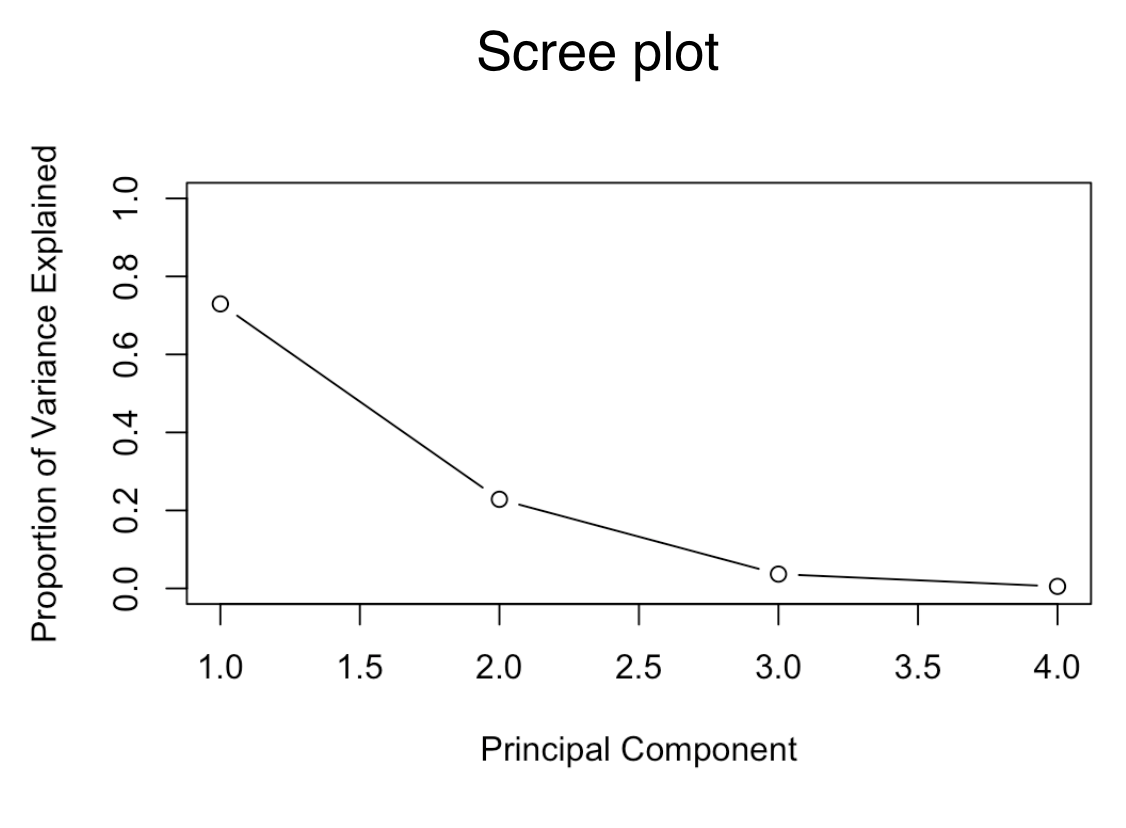
# Getting proportion of variance for a scree plot
pr.var <- pr.iris$sdev^2
pve <- pr.var / sum(pr.var)

# Plot variance explained for each principal component
plot(pve, xlab = "Principal Component",
       ylab = "Proportion of Variance Explained",
       ylim = c(0, 1), type = "b")
# Getting proportion of variance for a scree plot pr.var <- pr.iris$sdev^2 pve <- pr.var / sum(pr.var)
# Plot variance explained for each principal component plot(pve, xlab = "Principal Component", ylab = "Proportion of Variance Explained", ylim = c(0, 1), type = "b")