Cross-Validation

Maschinelles Lernen mit baumbasierten Modellen in R

Sandro Raabe

Data Scientist

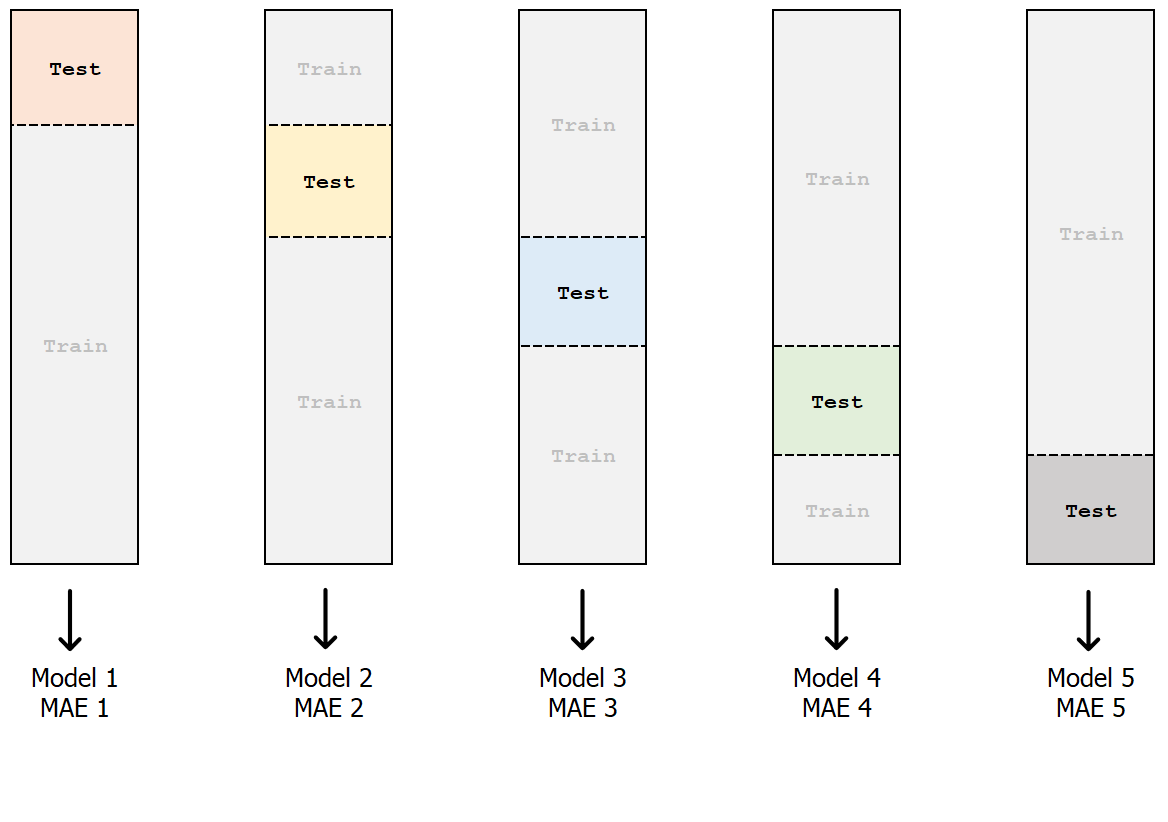
k-fold Cross-Validation
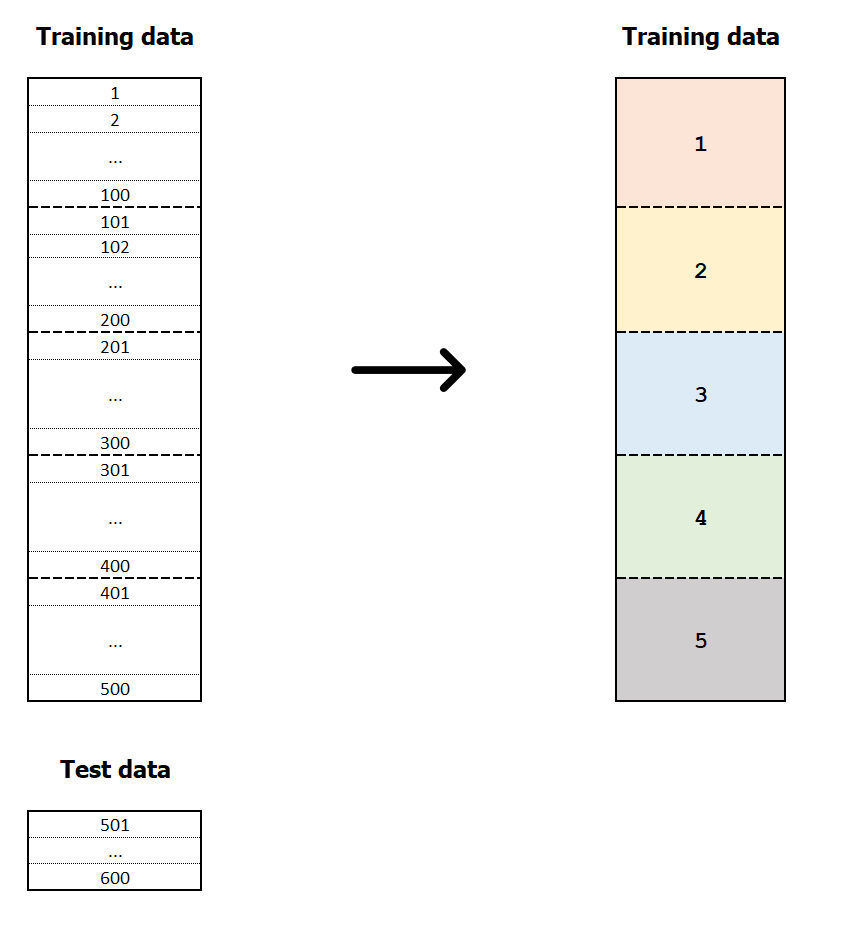
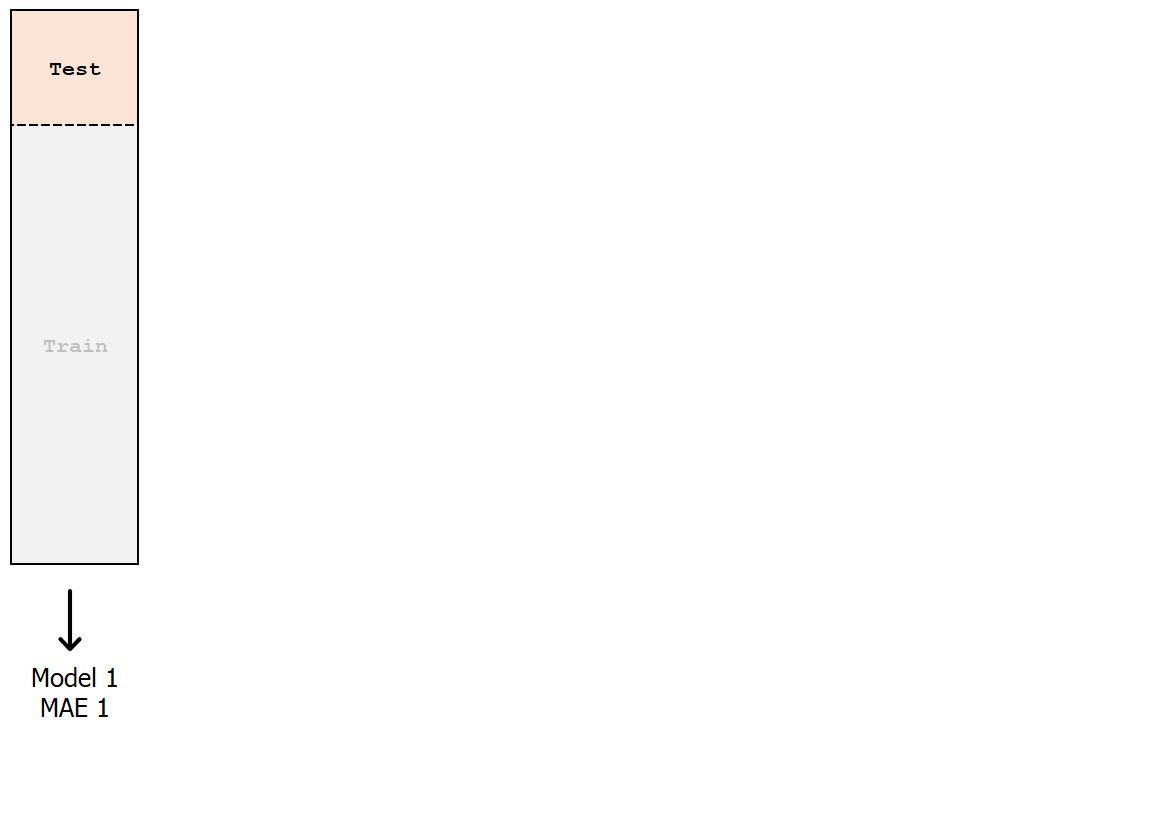
Daten in k Folds aufgeteilt

Maschinelles Lernen mit baumbasierten Modellen in R

k-fold Cross-Validation

Fold 1 als Testset

Maschinelles Lernen mit baumbasierten Modellen in R

k-fold Cross-Validation

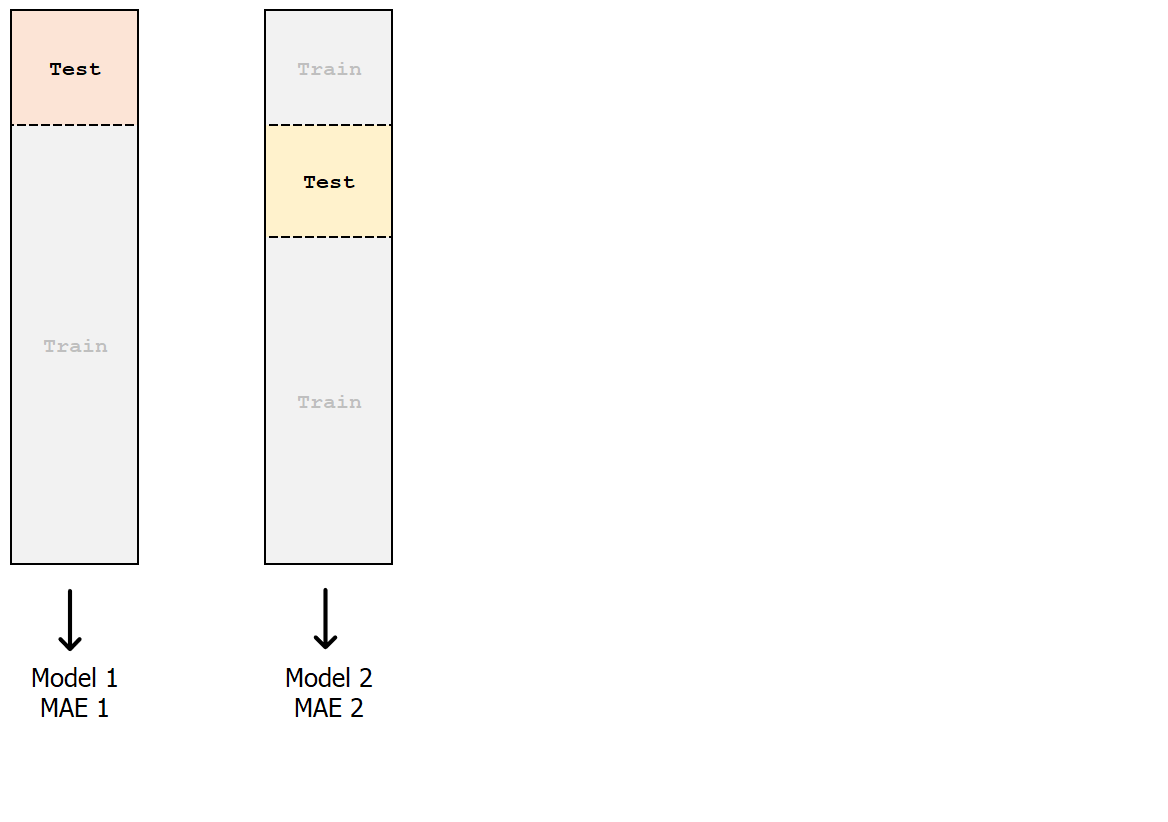
Fold 2 als Testset

Maschinelles Lernen mit baumbasierten Modellen in R

k-fold Cross-Validation

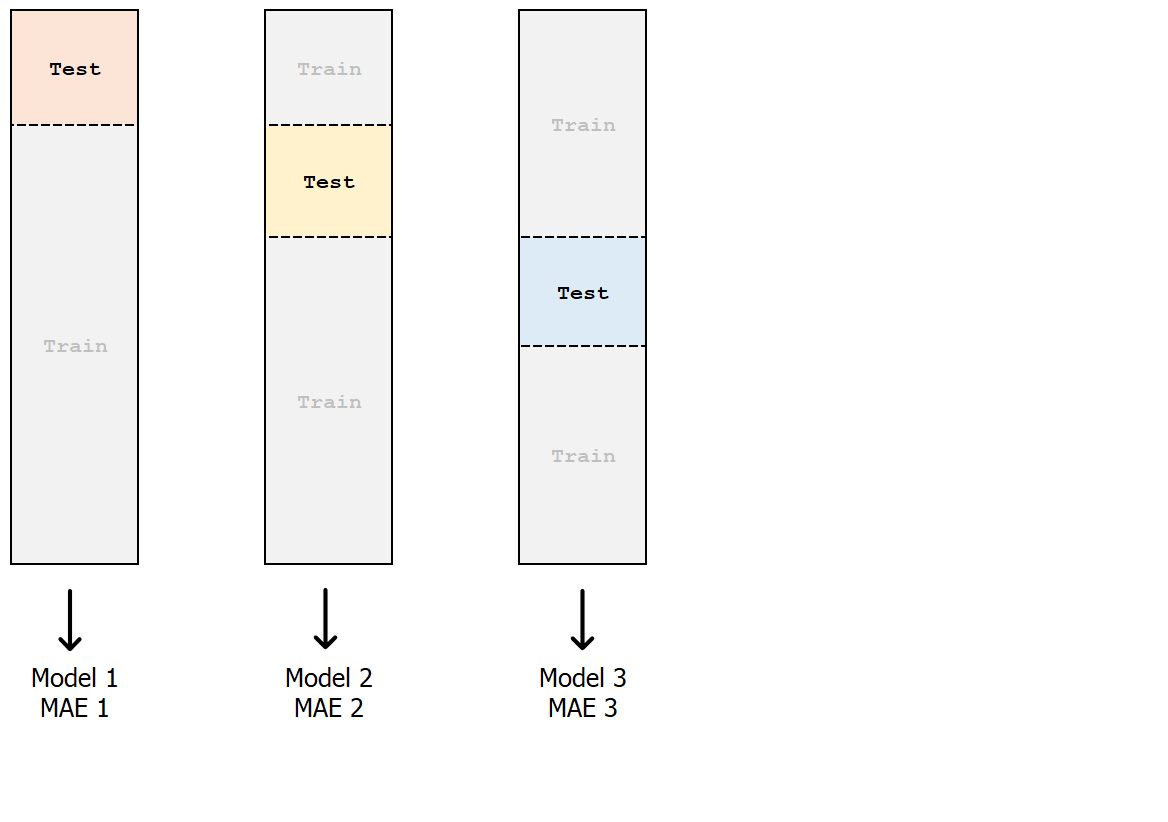
Fold 3 als Testset

Maschinelles Lernen mit baumbasierten Modellen in R

k-fold Cross-Validation

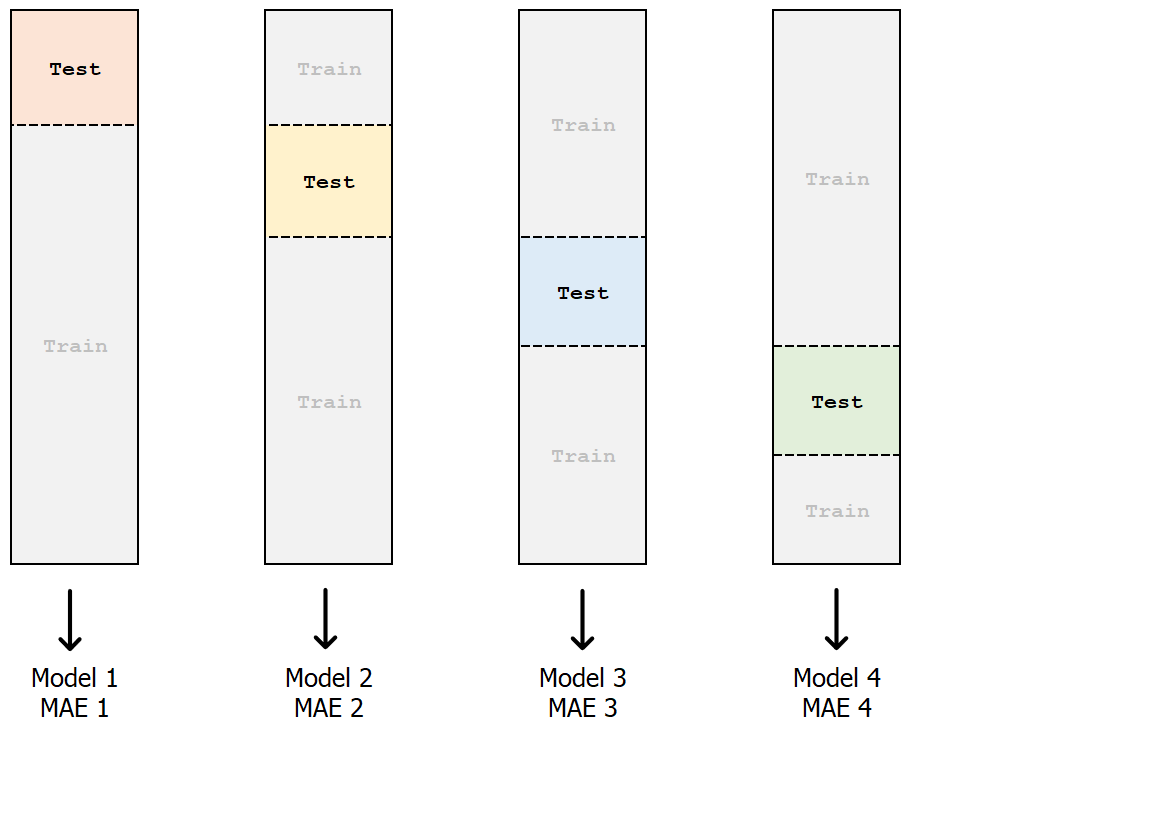
Fold 4 als Testset

Maschinelles Lernen mit baumbasierten Modellen in R

k-fold Cross-Validation

Fold 5 als Testset

Maschinelles Lernen mit baumbasierten Modellen in R

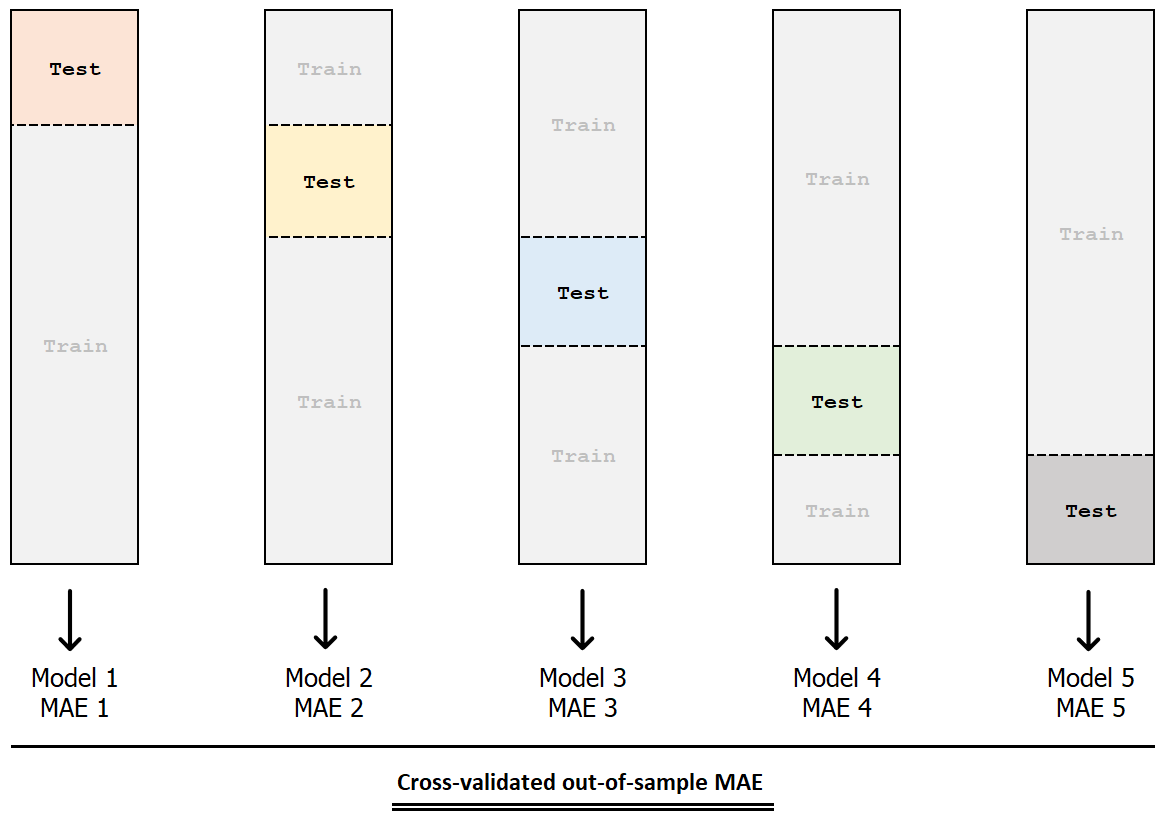
k-fold Cross-Validation

Gesamte cross-validierte MAE

Maschinelles Lernen mit baumbasierten Modellen in R

Finales Modell auf dem kompletten Datensatz fitten
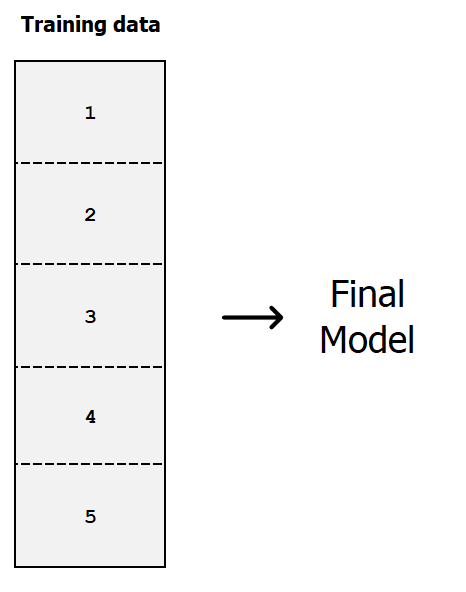
Finales Modell auf vollständigem Datensatz fitten

Maschinelles Lernen mit baumbasierten Modellen in R

Coding – Daten 10-mal aufteilen

# Random seed for reproducibility
set.seed(100)

# Create 10 folds of the dataset
chocolate_folds <- vfold_cv(chocolate_train, v = 10)
#  10-fold cross-validation
# A tibble: 10 x 2
  splits             id
1 <split [1293/144]> Fold1
2 <split [1293/144]> Fold2
3 <split [1293/144]> Fold3
4 ...
Maschinelles Lernen mit baumbasierten Modellen in R

Coding – Folds fitten

# Fit a model for every fold and calculate MAE and RMSE
fits_cv <- fit_resamples(tree_spec,

final_grade ~ .,
resamples = chocolate_folds,
metrics = metric_set(mae, rmse))
# Resampling results
# 10-fold cross-validation
# A tibble: 10 x 4
  splits             id    .metrics
  <list>             <chr> <list>
1 <split [1293/144]> Fold1 <tibble [2 x 4]>
2 <split [1293/144]> Fold2 <tibble [2 x 4]>
3 <split [1293/144]> Fold3 <tibble [2 x 4]>
4 ...
Maschinelles Lernen mit baumbasierten Modellen in R

Coding – Alle Fehler sammeln

# Collect raw errors of all model runs
all_errors <- collect_metrics(fits_cv, 
                              summarize = FALSE)

print(all_errors)
# A tibble: 20 x 3
   id      .metric  .estimate
   <chr>     <chr>      <dbl>
 1 Fold01      mae      0.362
 2 Fold01     rmse      0.442
 3 Fold02      mae      0.385
 4 Fold02     rmse      0.504
 5 ...
library(ggplot2)
ggplot(all_errors, aes(x = .estimate, 
                       fill = .metric)) +
   geom_histogram()
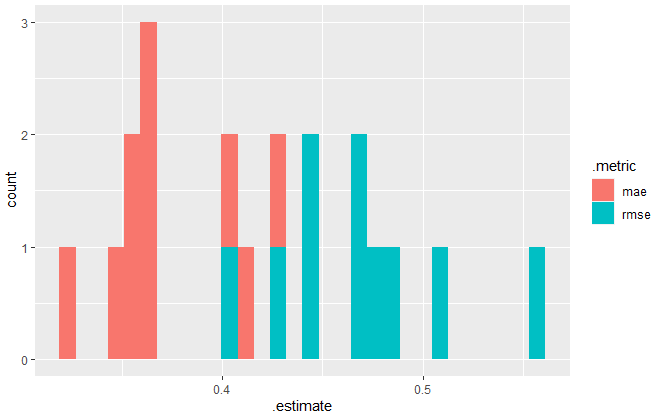
Histogramm der Fehler

Maschinelles Lernen mit baumbasierten Modellen in R

Coding – Trainingsläufe zusammenfassen

# Collect and summarize errors of all model runs
collect_metrics(fits_cv)
# A tibble: 2 x 3
  .metric   mean      n
  <chr>    <dbl>  <int>
1 mae      0.383     10
2 rmse     0.477     10
Maschinelles Lernen mit baumbasierten Modellen in R

Lass uns cross-validieren!

Maschinelles Lernen mit baumbasierten Modellen in R

Preparing Video For Download...