Marketing Analytics: Kundenabwanderung in Python vorhersagen
Mark Peterson
Director of Data Science, Infoblox
Mit der Bibliothek seaborn erstellst du leicht aussagekräftige, ansprechende Plots
Baut auf matplotlib auf
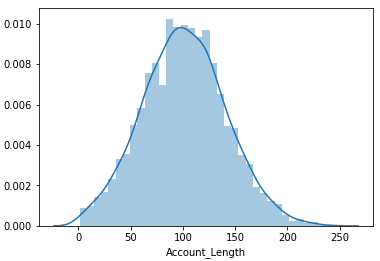
import matplotlib.pyplot as plt import seaborn as snssns.distplot(telco['Account_Length'])plt.show()

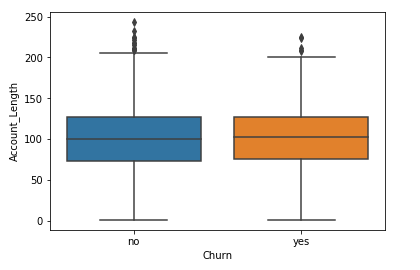
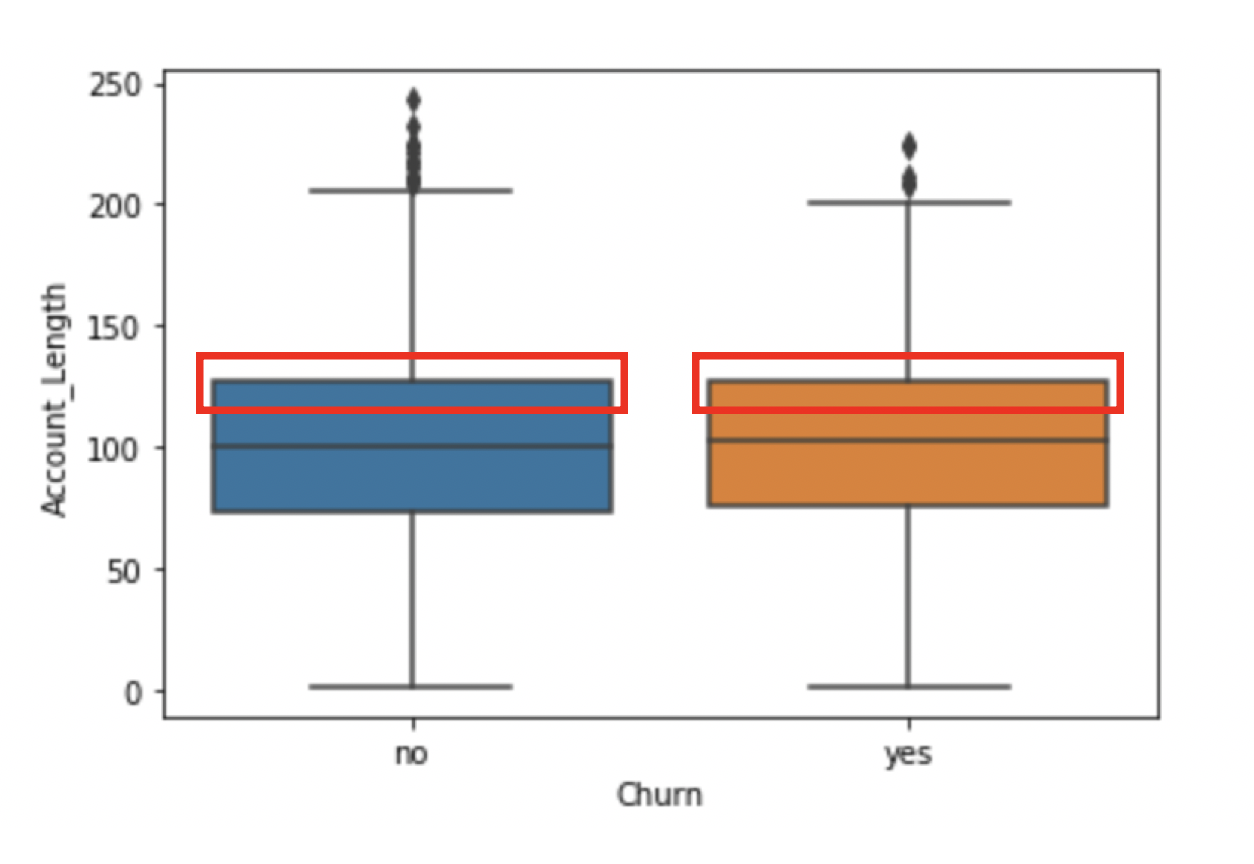
sns.boxplot(x = 'Churn',
y = 'Account_Length',
data = telco)
plt.show()

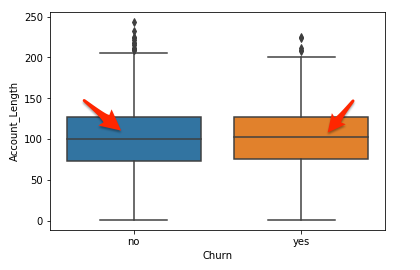
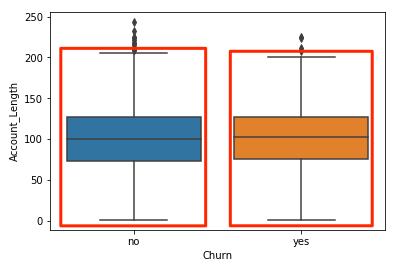
sns.boxplot(x = 'Churn',
y = 'Account_Length',
data = telco)
plt.show()

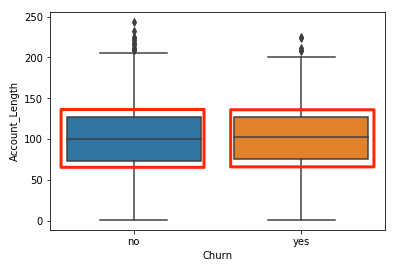
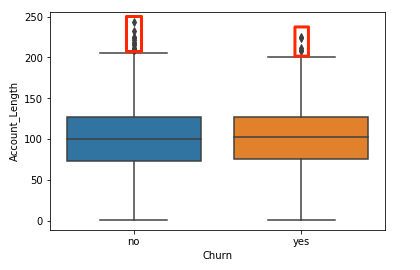
sns.boxplot(x = 'Churn',
y = 'Account_Length',
data = telco)
plt.show()

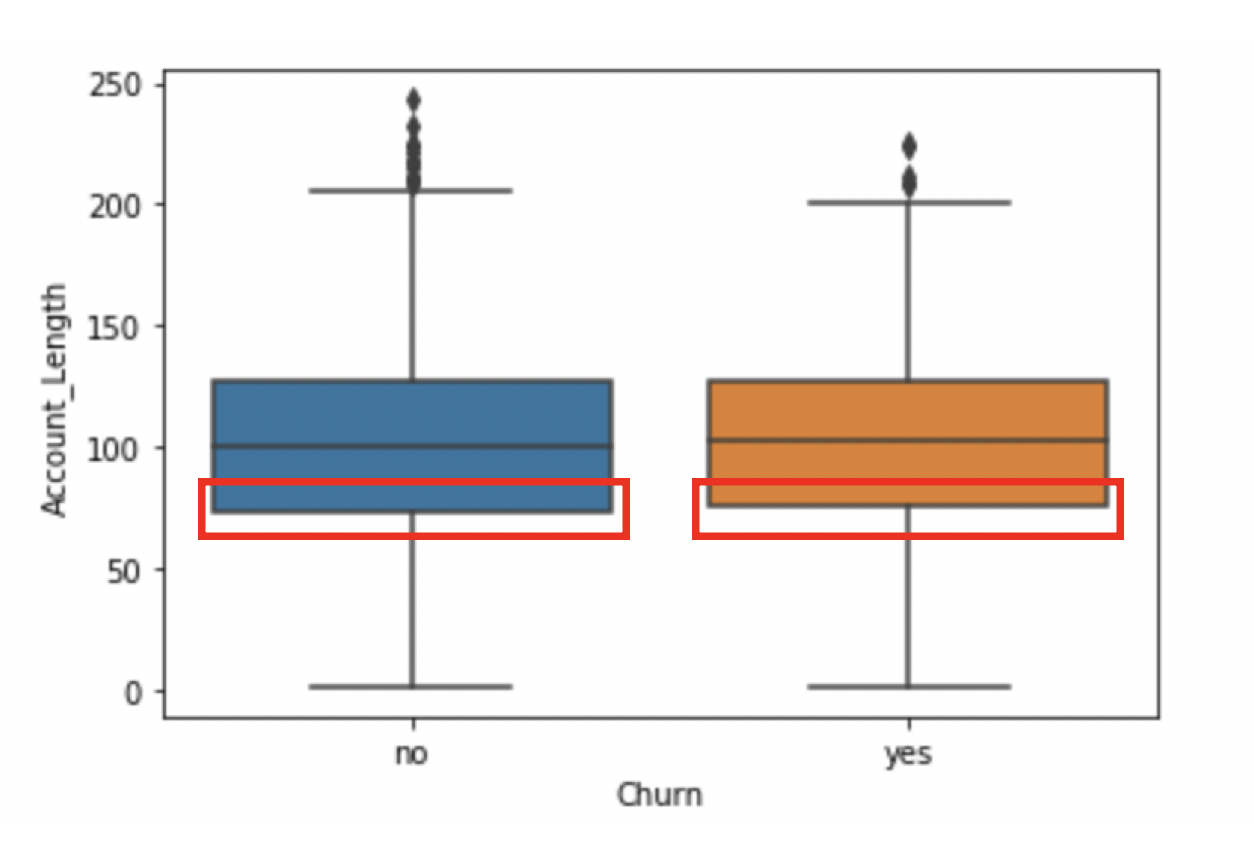
sns.boxplot(x = 'Churn',
y = 'Account_Length',
data = telco)
plt.show()

sns.boxplot(x = 'Churn',
y = 'Account_Length',
data = telco)
plt.show()

sns.boxplot(x = 'Churn',
y = 'Account_Length',
data = telco)
plt.show()

sns.boxplot(x = 'Churn',
y = 'Account_Length',
data = telco)
plt.show()

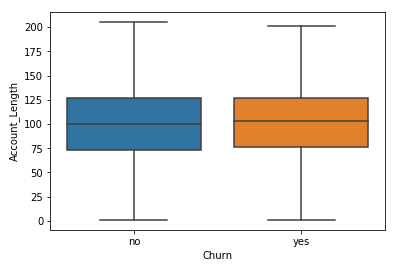
sns.boxplot(x = 'Churn',
y = 'Account_Length',
data = telco,
sym="")
plt.show()

sns.boxplot(x = 'Churn',
y = 'Account_Length',
data = telco,
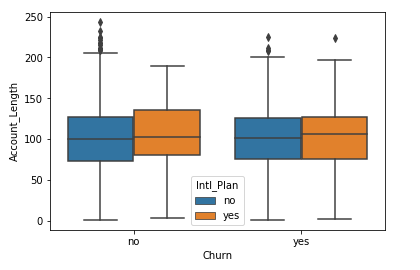
hue = 'Intl_Plan')
plt.show()

Marketing Analytics: Kundenabwanderung in Python vorhersagen