Kreditrisikomodellierung in R
Lore Dirick
Manager of Data Science Curriculum at Flatiron School


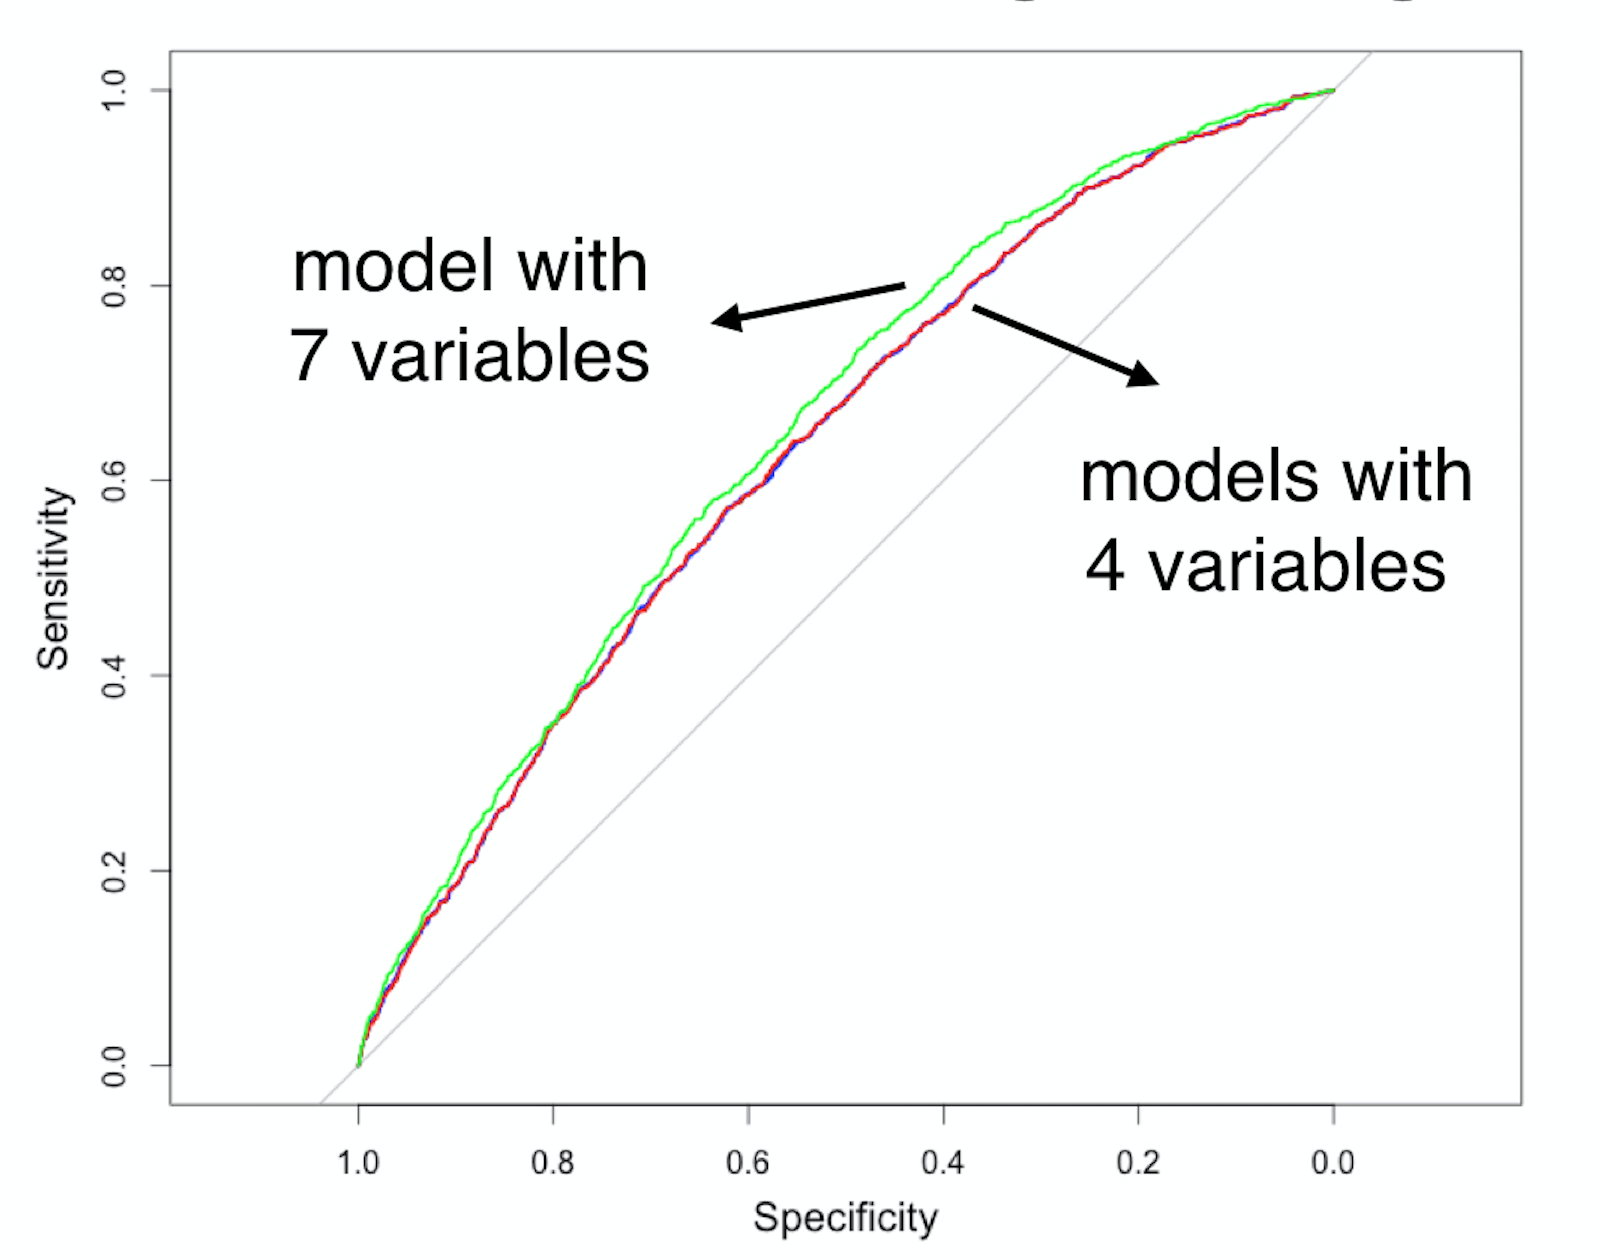
1) Starte mit einem Modell mit allen Variablen (hier 7) und berechne die AUC
log_model_full <- glm(loan_status ~ loan_amnt + grade + home_ownership +
annual_inc + age + emp_cat + ir_cat,
family = "binomial", data = training_set)
predictions_model_full <- predict(log_model_full,
newdata = test_set, type ="response")
AUC_model_full <- auc(test_set$loan_status, predictions_model_full)
Area under the curve: 0.6512
2) Baue 7 neue Modelle, wobei jeweils eine Variable entfernt wird, und mache PD-Vorhersagen mit dem Testset
log_1_remove_amnt <- glm(loan_status ~ grade + home_ownership + annual_inc + age + emp_cat + ir_cat,
family = "binomial",
data = training_set)
log_1_remove_grade <- glm(loan_status ~ loan_amnt + home_ownership + annual_inc + age + emp_cat + ir_cat,
family = "binomial",
data = training_set)
log_1_remove_home <- glm(loan_status ~ loan_amnt + grade + annual_inc + age + emp_cat + ir_cat,
family = "binomial",
data = training_set)
pred_1_remove_amnt <- predict(log_1_remove_amnt, newdata = test_set, type = "response")
pred_1_remove_grade <- predict(log_1_remove_grade, newdata = test_set, type = "response")
pred_1_remove_home <- predict(log_1_remove_home, newdata = test_set, type = "response")
...
3) Behalte das Modell mit der besten AUC (AUC Vollmodell: 0.6512)
auc(test_set$loan_status, pred_1_remove_amnt)
Area under the curve: 0.6537
auc(test_set$loan_status, pred_1_remove_grade)
Area under the curve: 0.6438
auc(test_set$loan_status, pred_1_remove_home)
Area under the curve: 0.6537
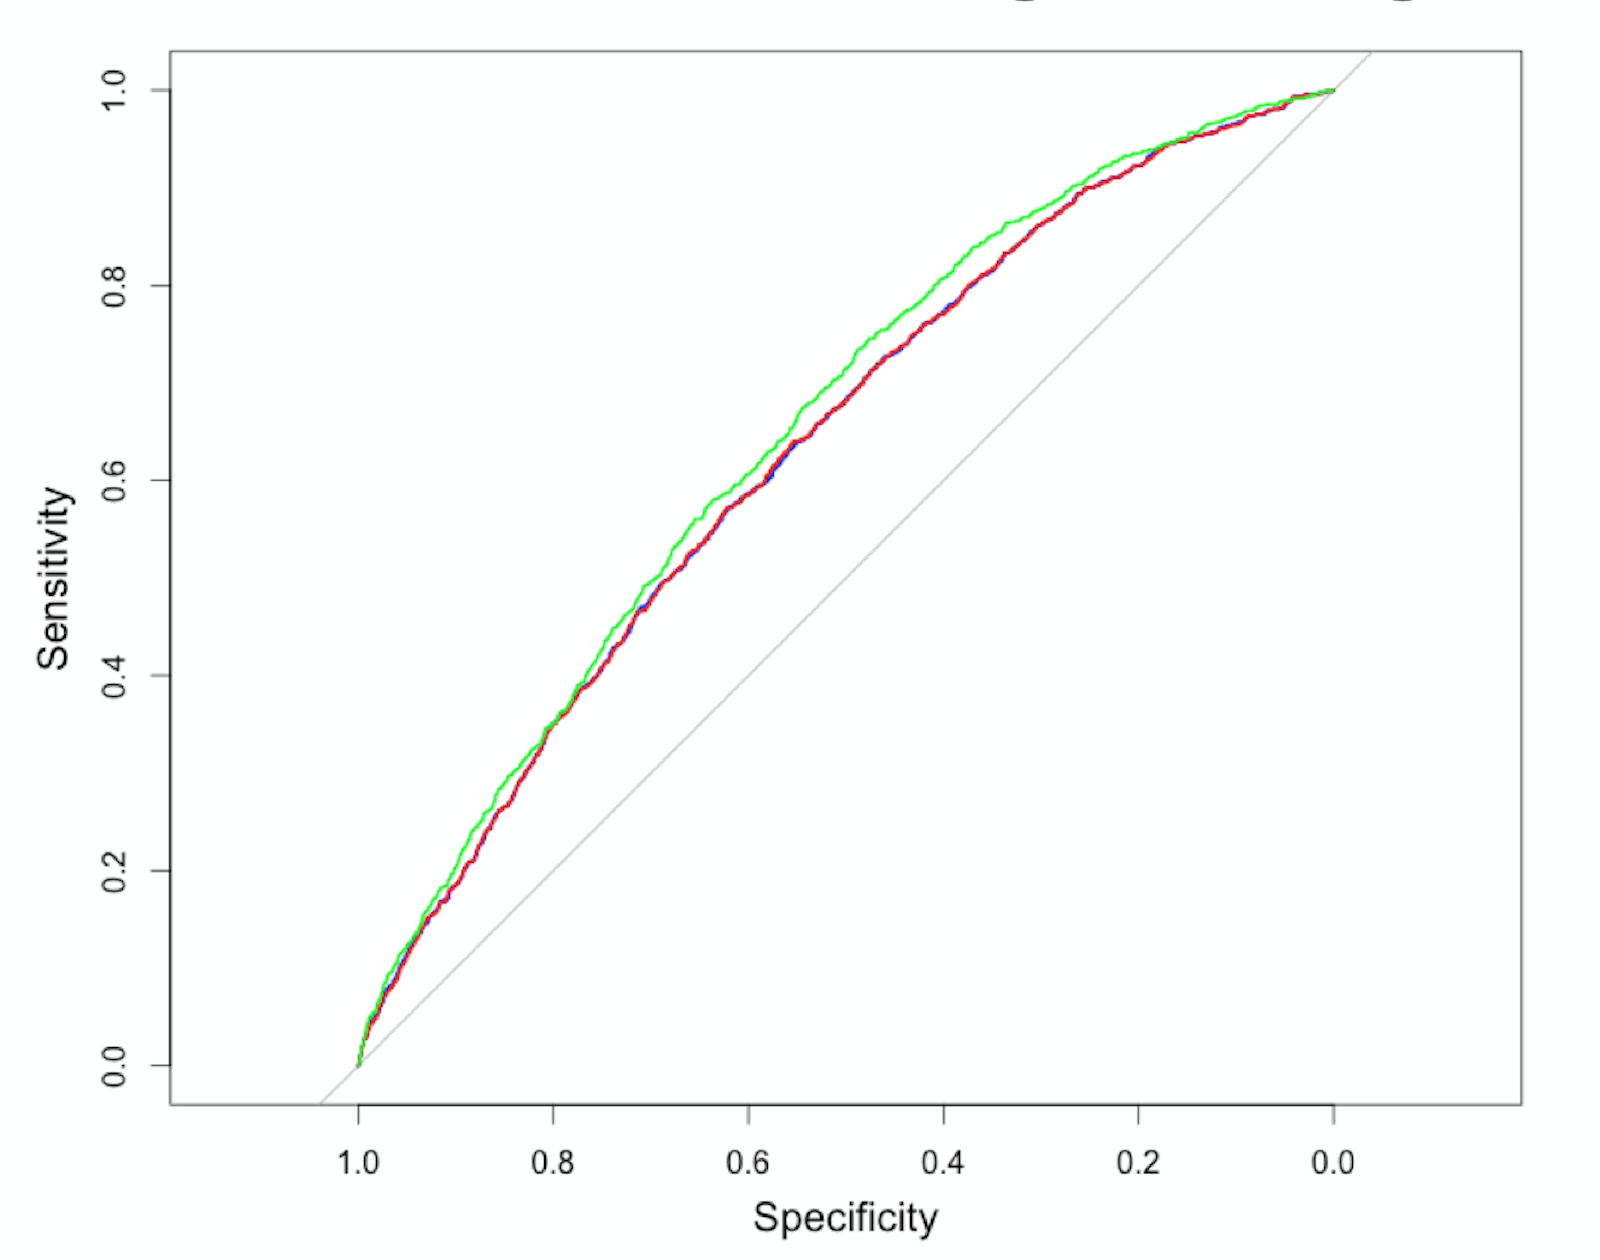
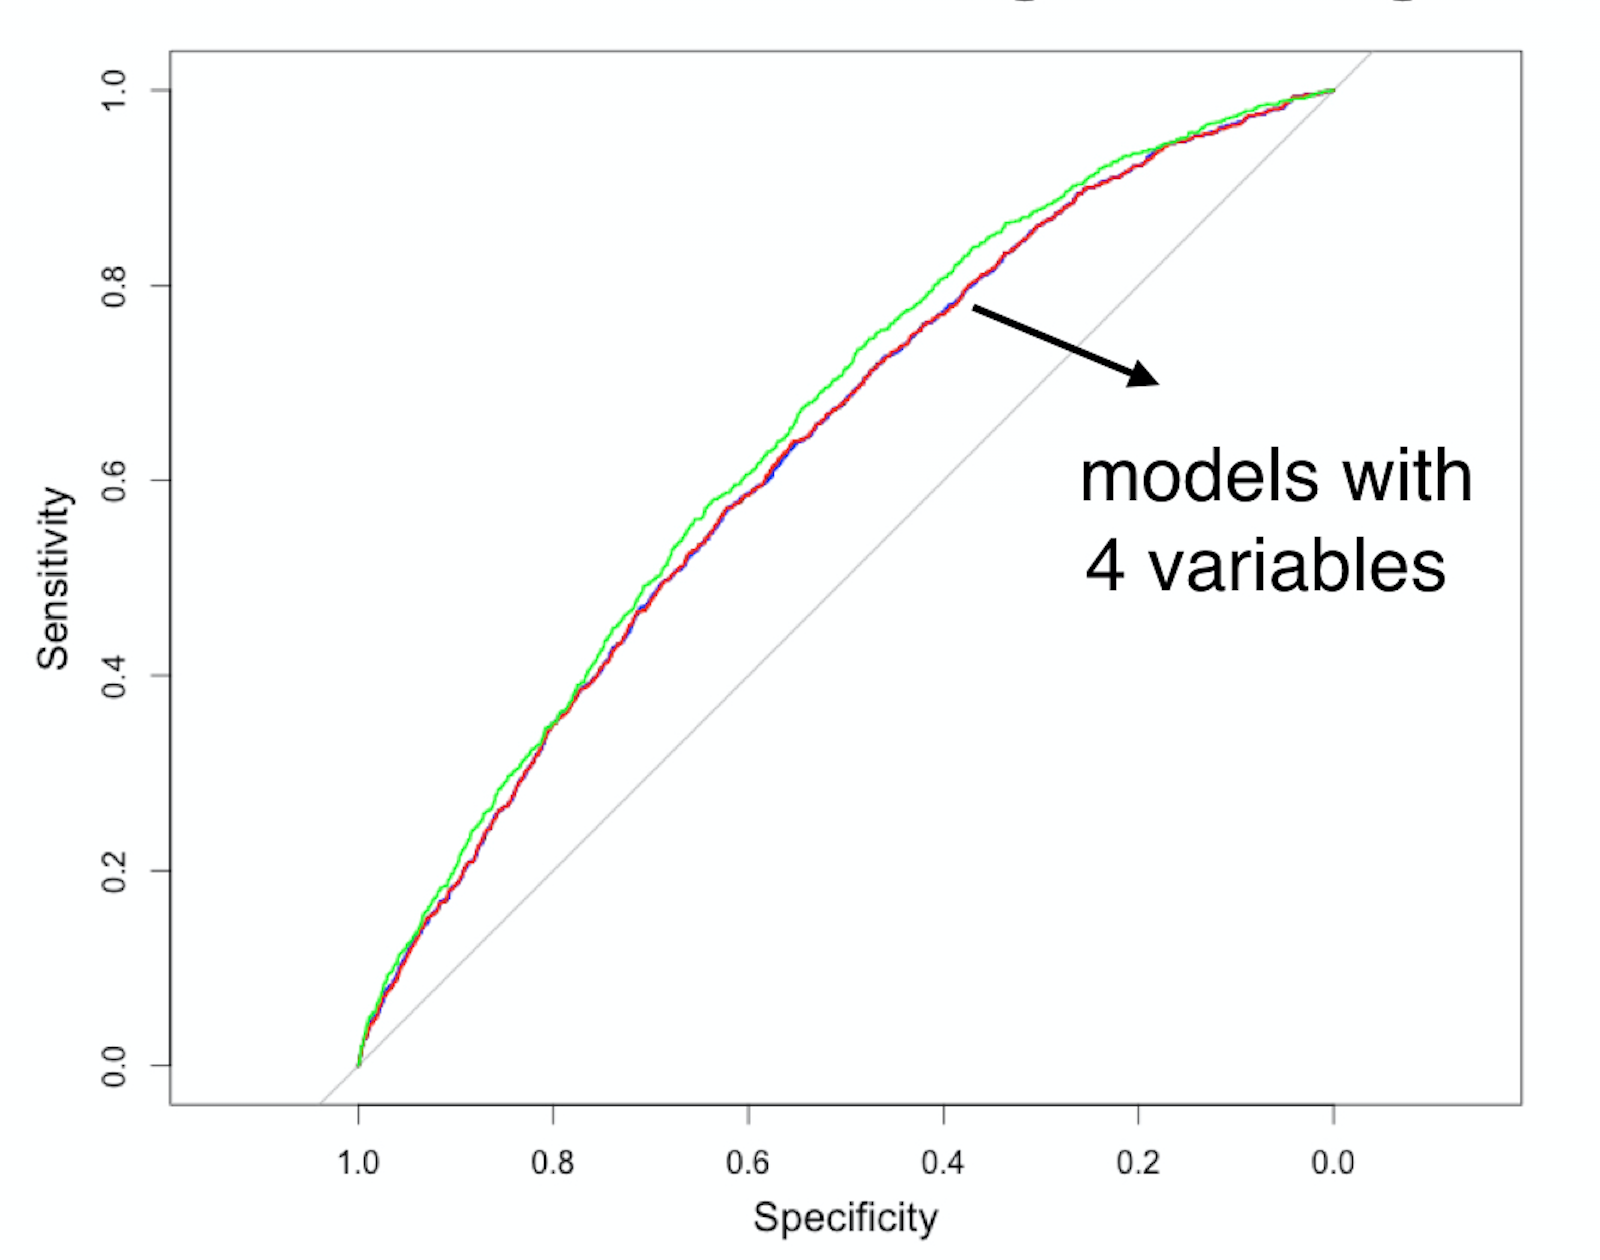
4) Wiederhole, bis die AUC (signifikant) sinkt
Kreditrisikomodellierung in R