Mathematische Modelle dynamischer Systeme
Diskrete-Ereignis-Simulation mit Python

Diogo Costa (PhD, MSc)
Adjunct Professor, University of Saskatchewan, Canada & CEO of ImpactBLUE-Scientific
Was ist ein mathematisches Modell?
Mathematische Modelle können einfach oder komplex sein.
- Digitale Annäherungen an die Realität
- Unmöglich, alle Prozesse abzubilden
George Box: "Alle Modelle sind falsch, aber einige sind nützlich."

Beispiel: Modell zur Vorhersage natürlicher Prozesse
Modell des Flussabflusses
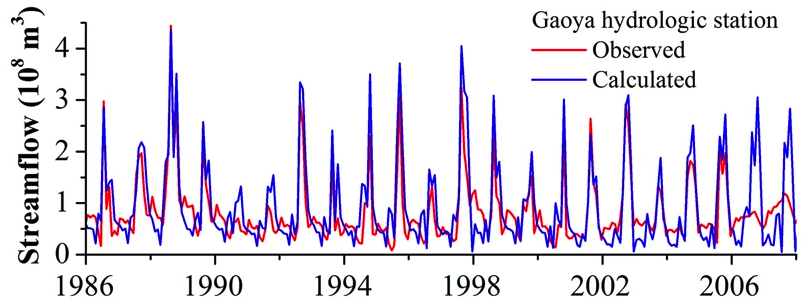
Dieses Modell sagt den Abfluss an der hydrologischen Station Goaya (China) voraus.
Die Vorhersage basiert auf Niederschlagsdaten als Modelleingabe.
1 Chen, C., He, W., Zhou, H. et al. A comparative study among machine learning and numerical models for simulating groundwater dynamics in the Heihe River Basin, northwestern China. Sci Rep 10, 3904 (2020). https://doi.org/10.1038/s41598-020-60698-9
Beispiel: Modell zur Vorhersage menschlicher Aktivitäten
Inflation vorhersagen
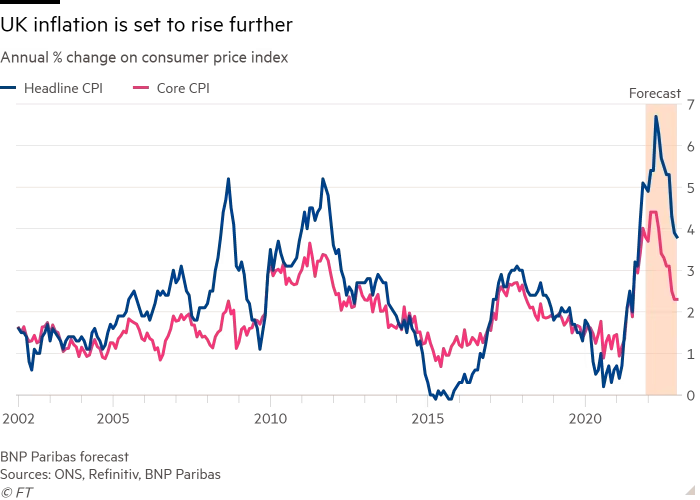
- Inflationsprognosen sind zentral, um Wirtschaftskrisen zu vermeiden
1 https://www.ft.com/content/218d35ab-b044-467a-bb62-0d17547a4350
Visualisierung von Modellergebnissen
Grafische Darstellung der Modellergebnisse: hilft, Muster und Kipppunkte zu erkennen.
Visualisierung auf Simulationsziele zuschneiden.
Nützliche Pakete:
matplotlib,seaborn,plotly.