Kumulative Animationen

Interaktive Datenvisualisierung mit plotly in R – Fortgeschrittene Themen

Adam Loy

Statistician, Carleton College
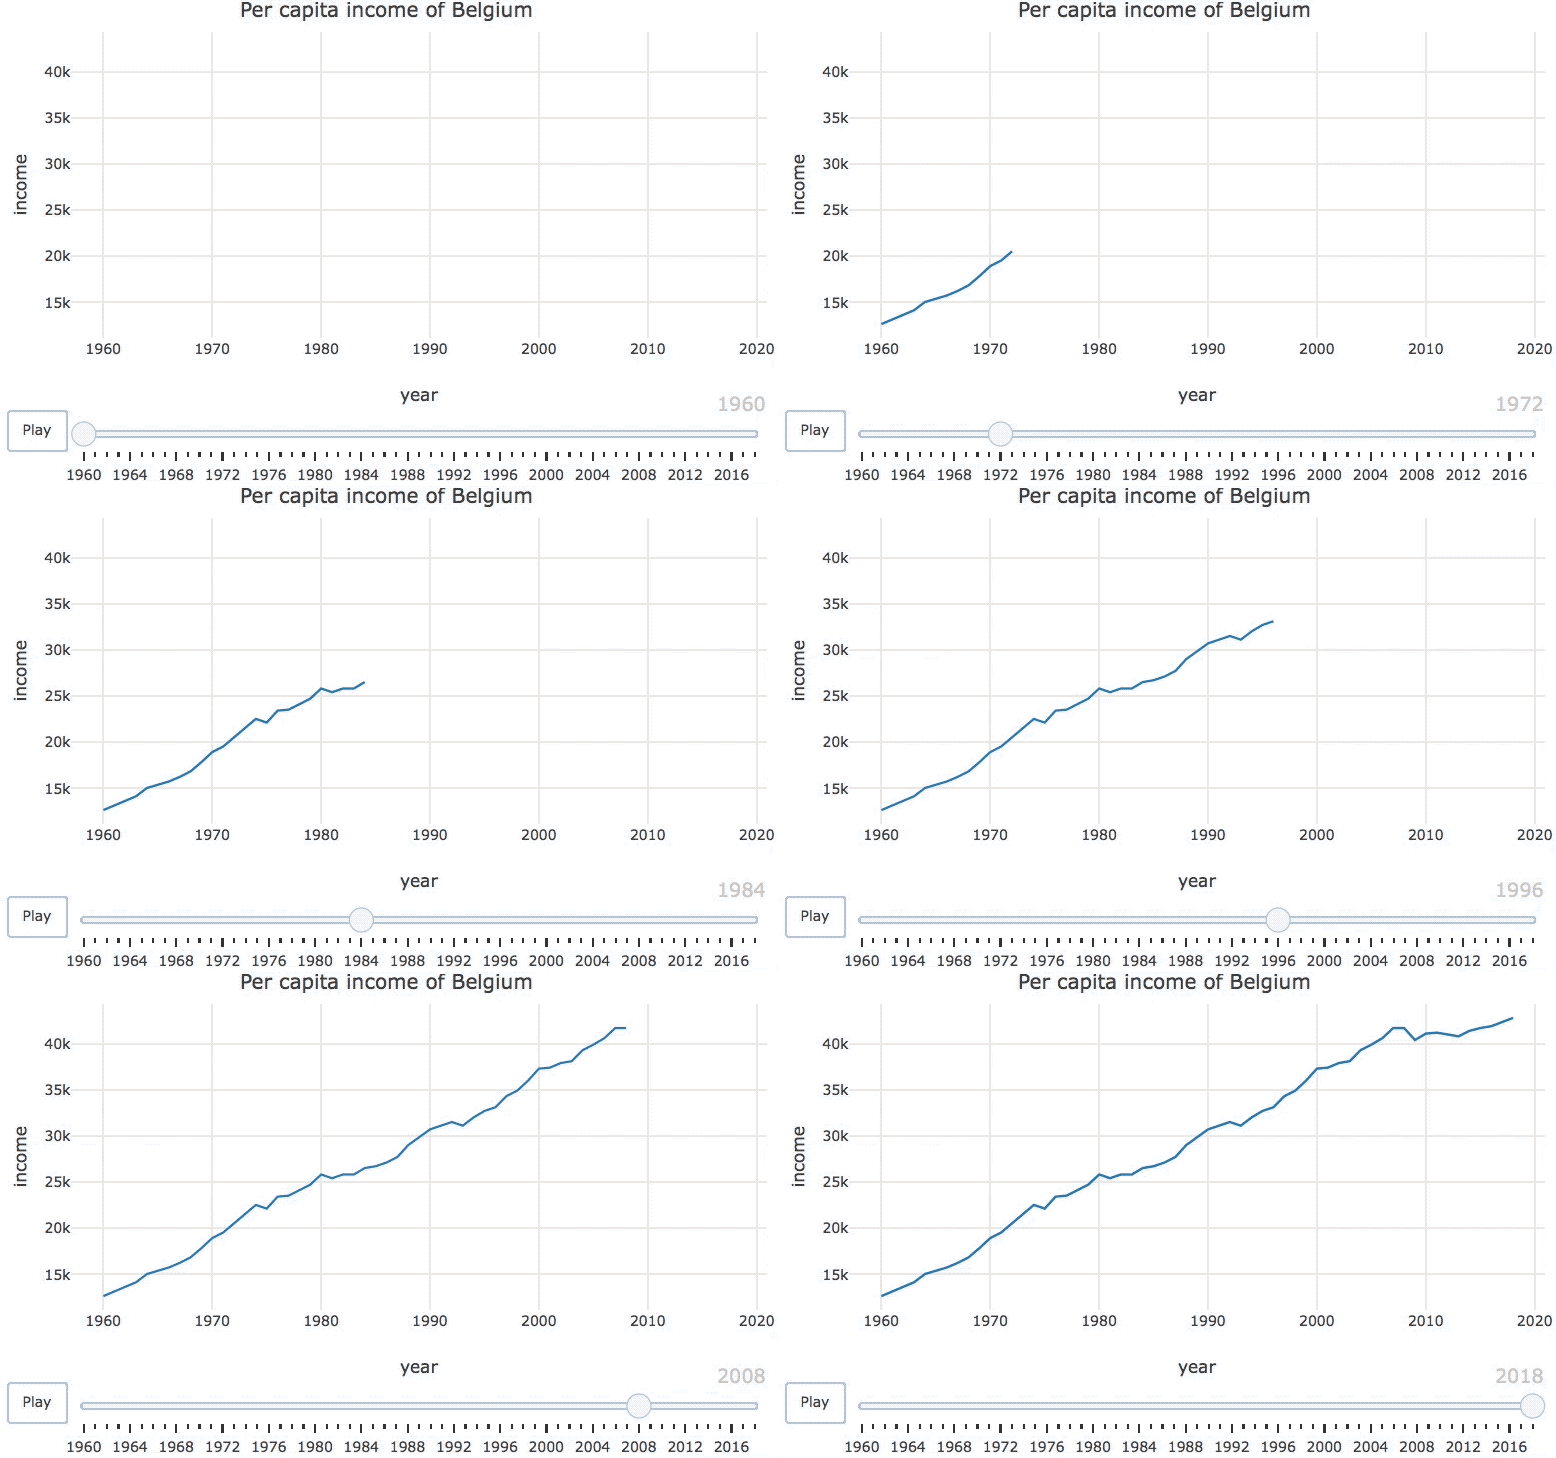
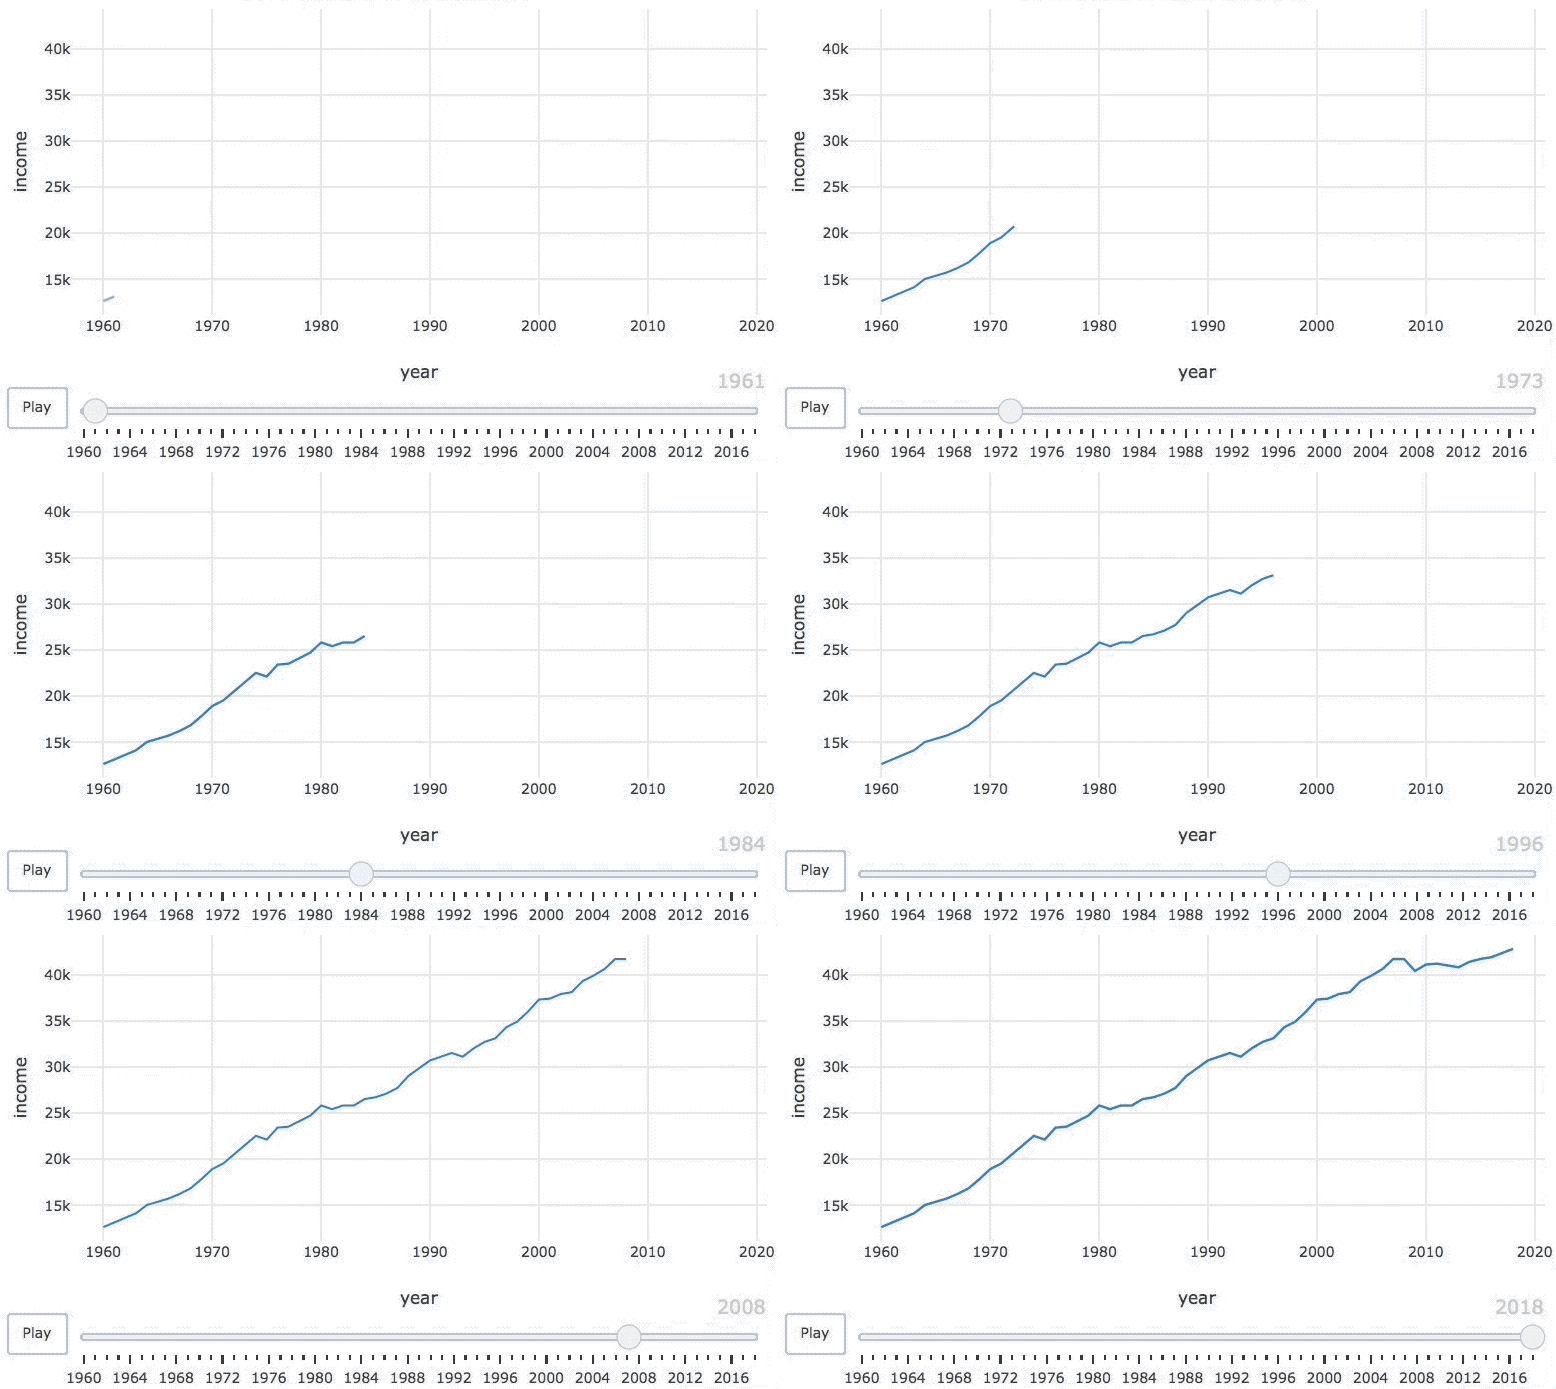
Animiertes Zeitreihendiagramm zum Pro-Kopf-Einkommen Belgiens.

Interaktive Datenvisualisierung mit plotly in R – Fortgeschrittene Themen

Belgische Einkommensdaten

belgium <- world_indicators %>%
  filter(country == "Belgium")
belgium
# A tibble: 59 x 11
  country  year income   co2 military population  urban life_expectancy four_regions
  <chr>   <dbl>  <dbl> <dbl>    <dbl>      <dbl>  <dbl>           <dbl> <chr>       
1 Belgium  1960  12600  9.93     3.4     9170000 8.46e6            69.6 europe      
2 Belgium  1961  13100 10.1      3.26    9230000 8.50e6            70.5 europe      
3 Belgium  1962  13700 10.6      3.28    9280000 8.55e6            70.2 europe      
4 Belgium  1963  14100 11.3      3.22    9340000 8.62e6            70   europe      
5 Belgium  1964  15000 11        3.21    9390000 8.72e6            70.7 europe      
# … with 54 more rows, and 2 more variables: eight_regions <chr>, six_regions <chr>
Interaktive Datenvisualisierung mit plotly in R – Fortgeschrittene Themen

Was ist das Frame?

# A tibble: 59 x 11
  country  year income   co2
  <chr>   <dbl>  <dbl> <dbl>
1 Belgium  1960  12600  9.93
2 Belgium  1961  13100 10.1 
3 Belgium  1962  13700 10.6 
4 Belgium  1963  14100 11.3 
5 Belgium  1964  15000 11   
6 Belgium  1965  15300 11.2 
# … with 53 more rows, and 7
#   more variables

Entspricht frame = ~year ??

Interaktive Datenvisualisierung mit plotly in R – Fortgeschrittene Themen

Was ist das Frame?

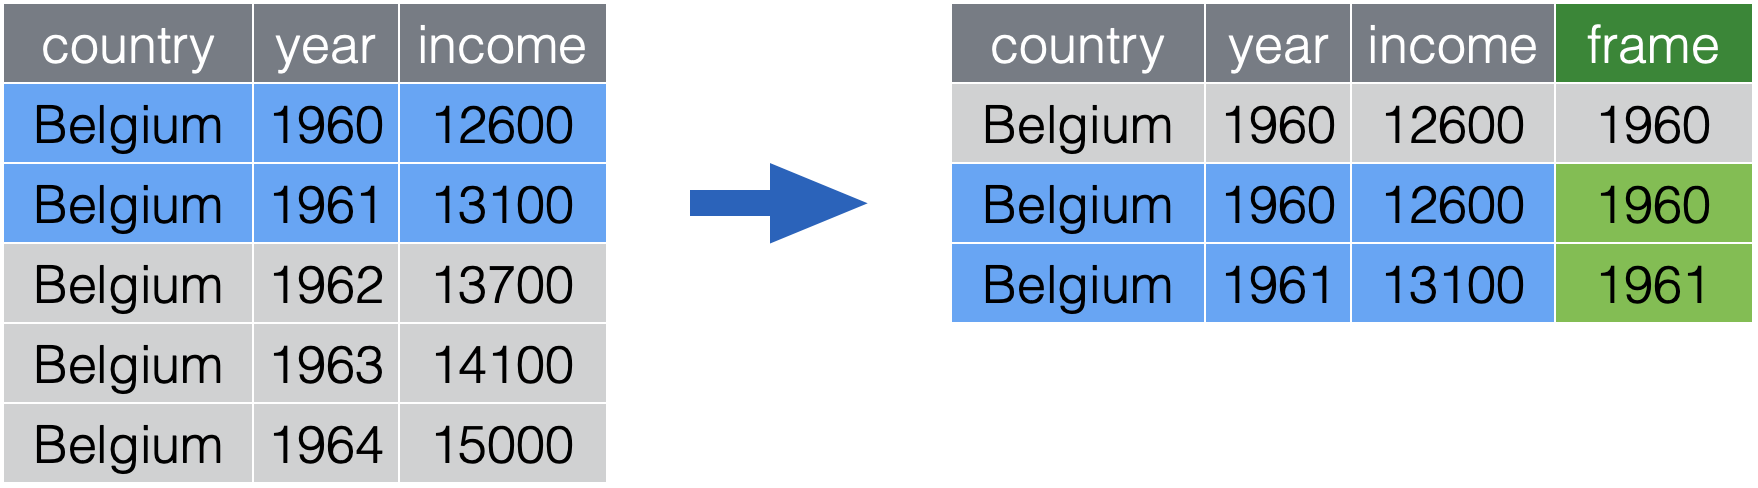
Ziel Veranschaulicht, was zwischen Frames bestehen bleibt

frame = ~year Keine persistierenden Daten bei frame = ~year.

Interaktive Datenvisualisierung mit plotly in R – Fortgeschrittene Themen

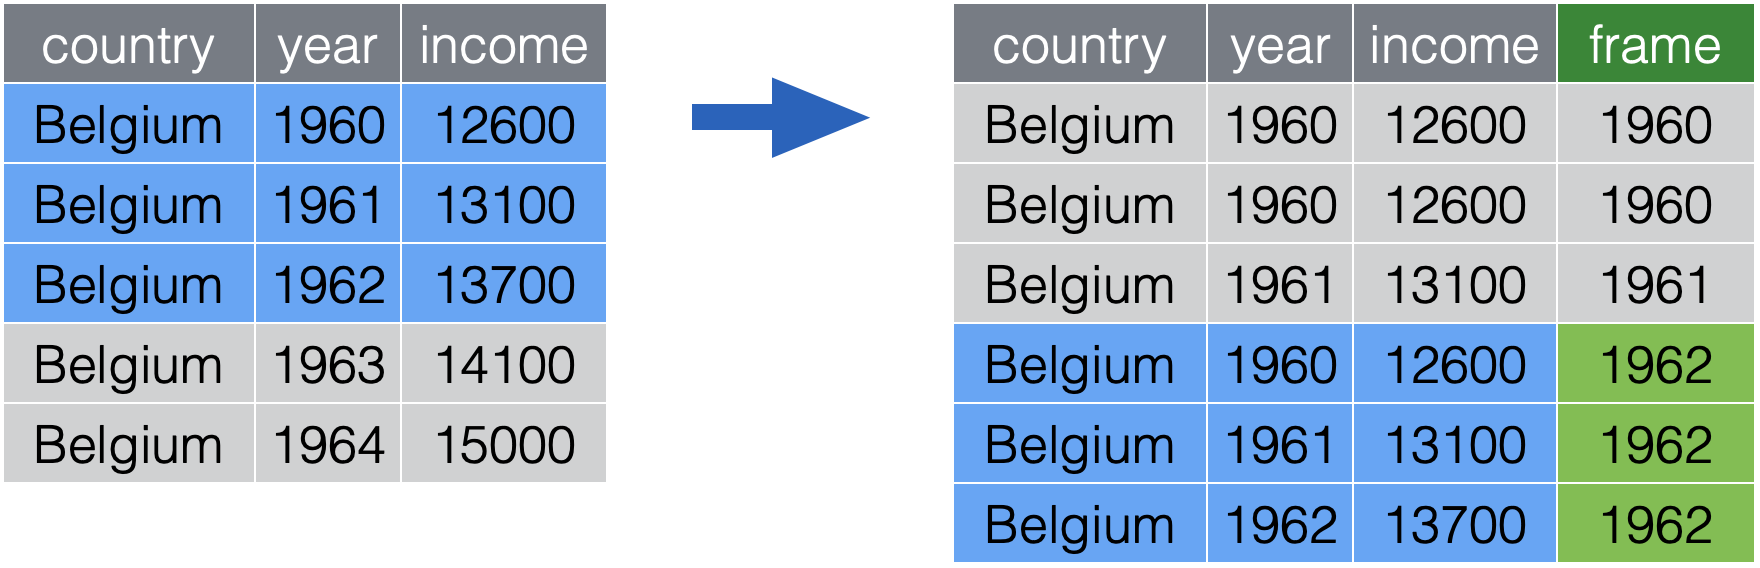
Datensätze akkumulieren

Akkumulierter Daten-Frame für 1960.

Interaktive Datenvisualisierung mit plotly in R – Fortgeschrittene Themen

Datensätze akkumulieren

Akkumulierter Daten-Frame für 1961.

Interaktive Datenvisualisierung mit plotly in R – Fortgeschrittene Themen

Datensätze akkumulieren

Akkumulierte Daten bis 1962.

Interaktive Datenvisualisierung mit plotly in R – Fortgeschrittene Themen

split()

library(dplyr)
library(purrr)

belgium %>% split(.$year)

Teile den Datensatz nach der Variablen year in eine Liste von data.frames

Interaktive Datenvisualisierung mit plotly in R – Fortgeschrittene Themen

accumulate()

library(dplyr)
library(purrr)
belgium %>%
  split(.$year) %>%
  accumulate(~bind_rows(.x, .y)) 

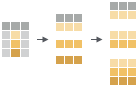
Grafik mit rekursivem Zusammenfügen von Ein-Zeilen-data.frames.

Interaktive Datenvisualisierung mit plotly in R – Fortgeschrittene Themen

name

library(dplyr)
library(purrr)
belgium %>%
  split(.$year) %>%
  accumulate(~bind_rows(.x, .y)) %>%
  set_names(1960:2018) 

Grafik mit rekursivem Zusammenfügen von Ein-Zeilen-data.frames.

Interaktive Datenvisualisierung mit plotly in R – Fortgeschrittene Themen

combine

library(dplyr)
library(purrr)
belgium %>%
  split(.$year) %>%
  accumulate(~bind_rows(.x, .y)) %>%
  set_names(1960:2018) %>%
  bind_rows(.id = "frame")

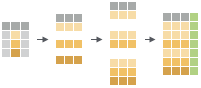
Grafik: die Liste von Data Frames wird zeilenweise zusammengefügt.

Interaktive Datenvisualisierung mit plotly in R – Fortgeschrittene Themen
# A tibble: 1,770 x 12
   frame country  year income   co2 military population  urban life_expectancy
   <chr> <chr>   <dbl>  <dbl> <dbl>    <dbl>      <dbl>  <dbl>           <dbl>
 1 1960  Belgium  1960  12600  9.93     3.4     9170000 8.46e6            69.6
 2 1961  Belgium  1960  12600  9.93     3.4     9170000 8.46e6            69.6
 3 1961  Belgium  1961  13100 10.1      3.26    9230000 8.50e6            70.5
 4 1962  Belgium  1960  12600  9.93     3.4     9170000 8.46e6            69.6
 5 1962  Belgium  1961  13100 10.1      3.26    9230000 8.50e6            70.5
 6 1962  Belgium  1962  13700 10.6      3.28    9280000 8.55e6            70.2
 7 1963  Belgium  1960  12600  9.93     3.4     9170000 8.46e6            69.6
 8 1963  Belgium  1961  13100 10.1      3.26    9230000 8.50e6            70.5
 9 1963  Belgium  1962  13700 10.6      3.28    9280000 8.55e6            70.2
10 1963  Belgium  1963  14100 11.3      3.22    9340000 8.62e6            70  
# … with 1,760 more rows, and 3 more variables: four_regions <chr>,
#   eight_regions <chr>, six_regions <chr>
Interaktive Datenvisualisierung mit plotly in R – Fortgeschrittene Themen

animate

library(dplyr)
library(purrr)
belgium %>%
  split(.$year) %>%
  accumulate(~bind_rows(.x, .y)) %>%
  set_names(1960:2018) %>%
  bind_rows(.id = "frame") %>%
  plot_ly(x = ~year, y = ~income) %>%
  add_lines(
    frame = ~frame, showlegend = FALSE
  )

Animation des Pro-Kopf-Einkommens in Belgien über die Zeit.

Interaktive Datenvisualisierung mit plotly in R – Fortgeschrittene Themen

Lass uns üben!

Interaktive Datenvisualisierung mit plotly in R – Fortgeschrittene Themen

Preparing Video For Download...