Subplots

Interaktive Datenvisualisierung mit Bokeh

George Boorman

Core Curriculum Manager, DataCamp

Warum Subplots?
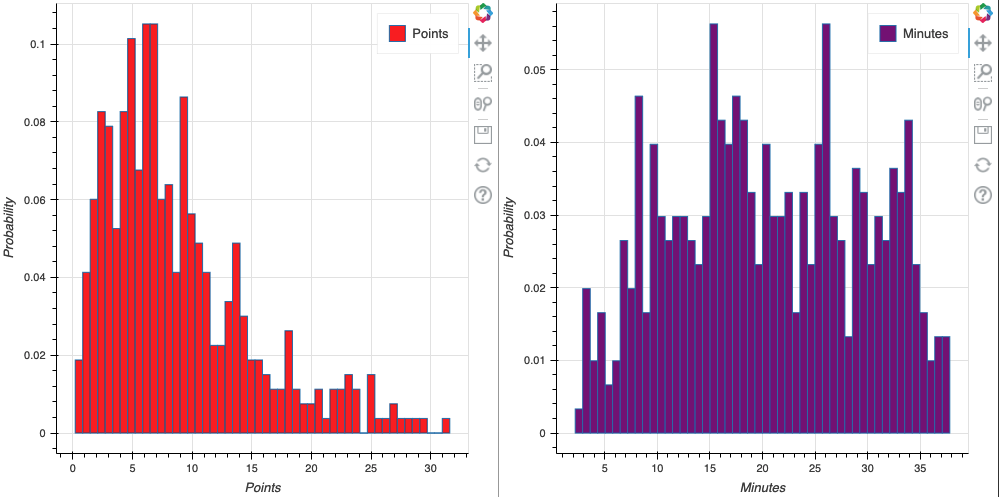
Histogramme

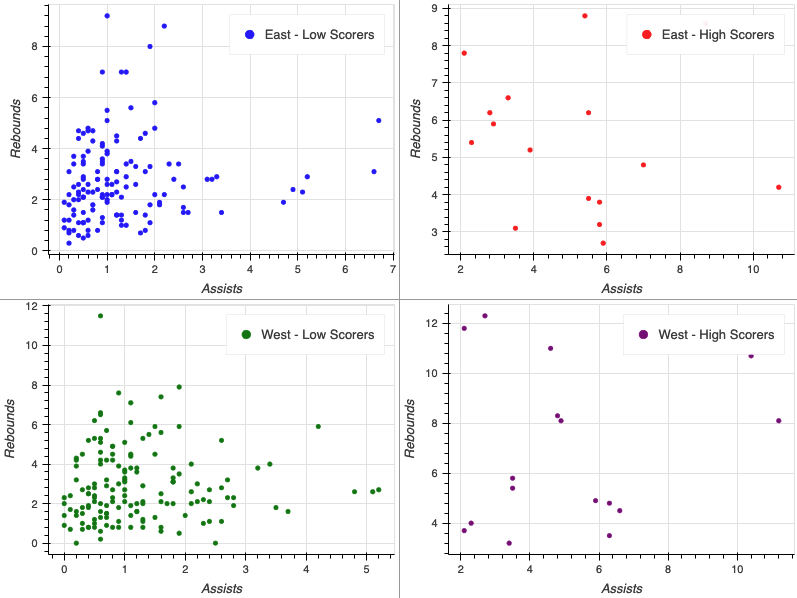
High_vs_Low_Reihe_Subplot

Interaktive Datenvisualisierung mit Bokeh

Eine Reihe bauen

from bokeh.layouts import row

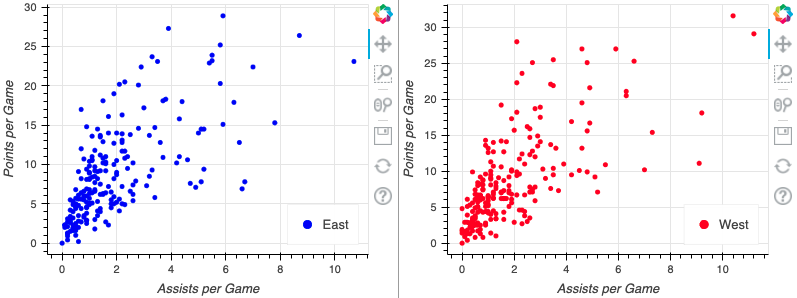
east_source = ColumnDataSource(data=east) west_source = ColumnDataSource(data=west) fig_one = figure(x_axis_label="Assists per Game", y_axis_label="Points per Game") fig_two = figure(x_axis_label="Assists per Game", y_axis_label="Points per Game")
fig_one.circle(x="assists", y="points", source=east_source, color="blue", legend_label="East") fig_two.circle(x="assists", y="points", source=west_source, color="blue", legend_label="West")
output_file(filename="row_plots.html")
show(row(fig_one, fig_two))
Interaktive Datenvisualisierung mit Bokeh

Reihen-Subplot

nba_subplot

Interaktive Datenvisualisierung mit Bokeh

Spalten-Subplot

from bokeh.layouts import column

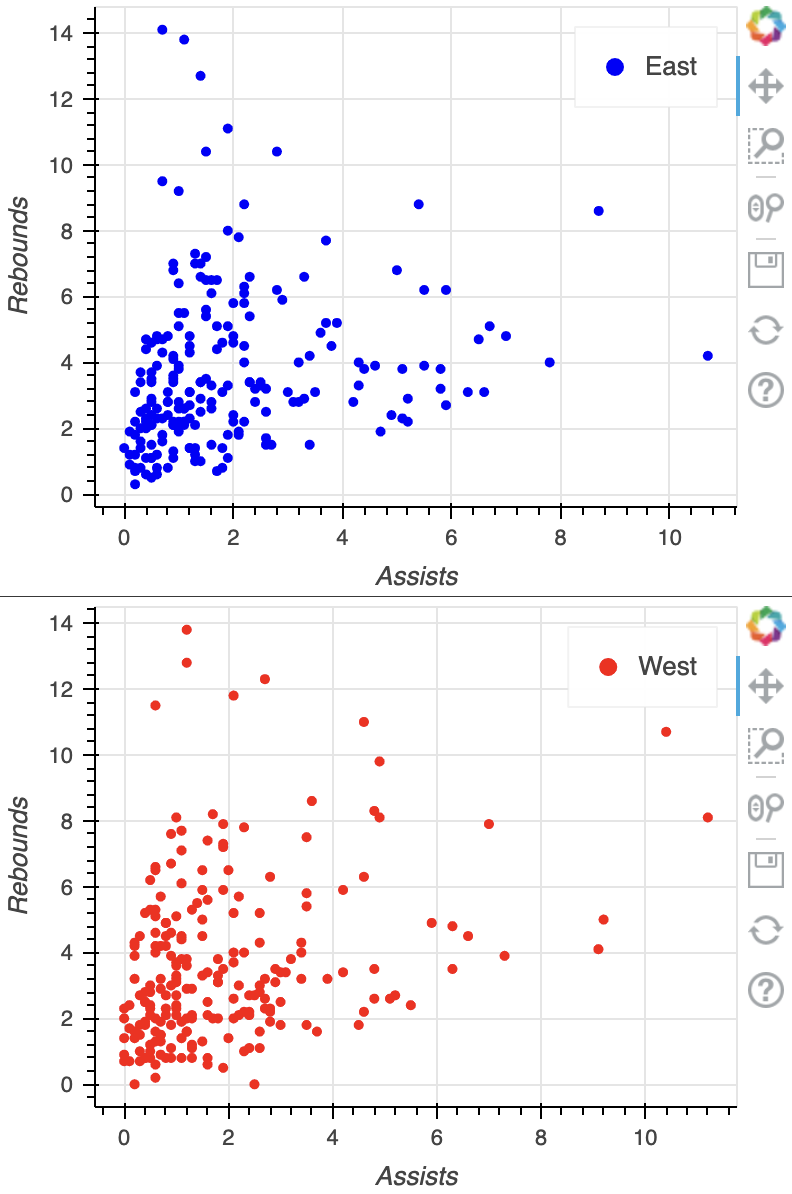
fig_one = figure(x_axis_label="Assists", y_axis_label="Rebounds") fig_two = figure(x_axis_label="Assists", y_axis_label="Rebounds") fig_one.circle(x="assists", y="rebounds", source=east_source, color="blue", legend_label="East") fig_two.circle(x="assists", y="rebounds", source=east_source, color="blue", legend_label="East")
output_file(filename="column_plots.html") show(column(fig_one, fig_two))

einfaches_Spalten-Diagramm

Interaktive Datenvisualisierung mit Bokeh

Ein Gridplot bauen

from bokeh.layouts import gridplot

positions = ["PG", "SG", "SF", "PF"]
plots = []
for position in positions:
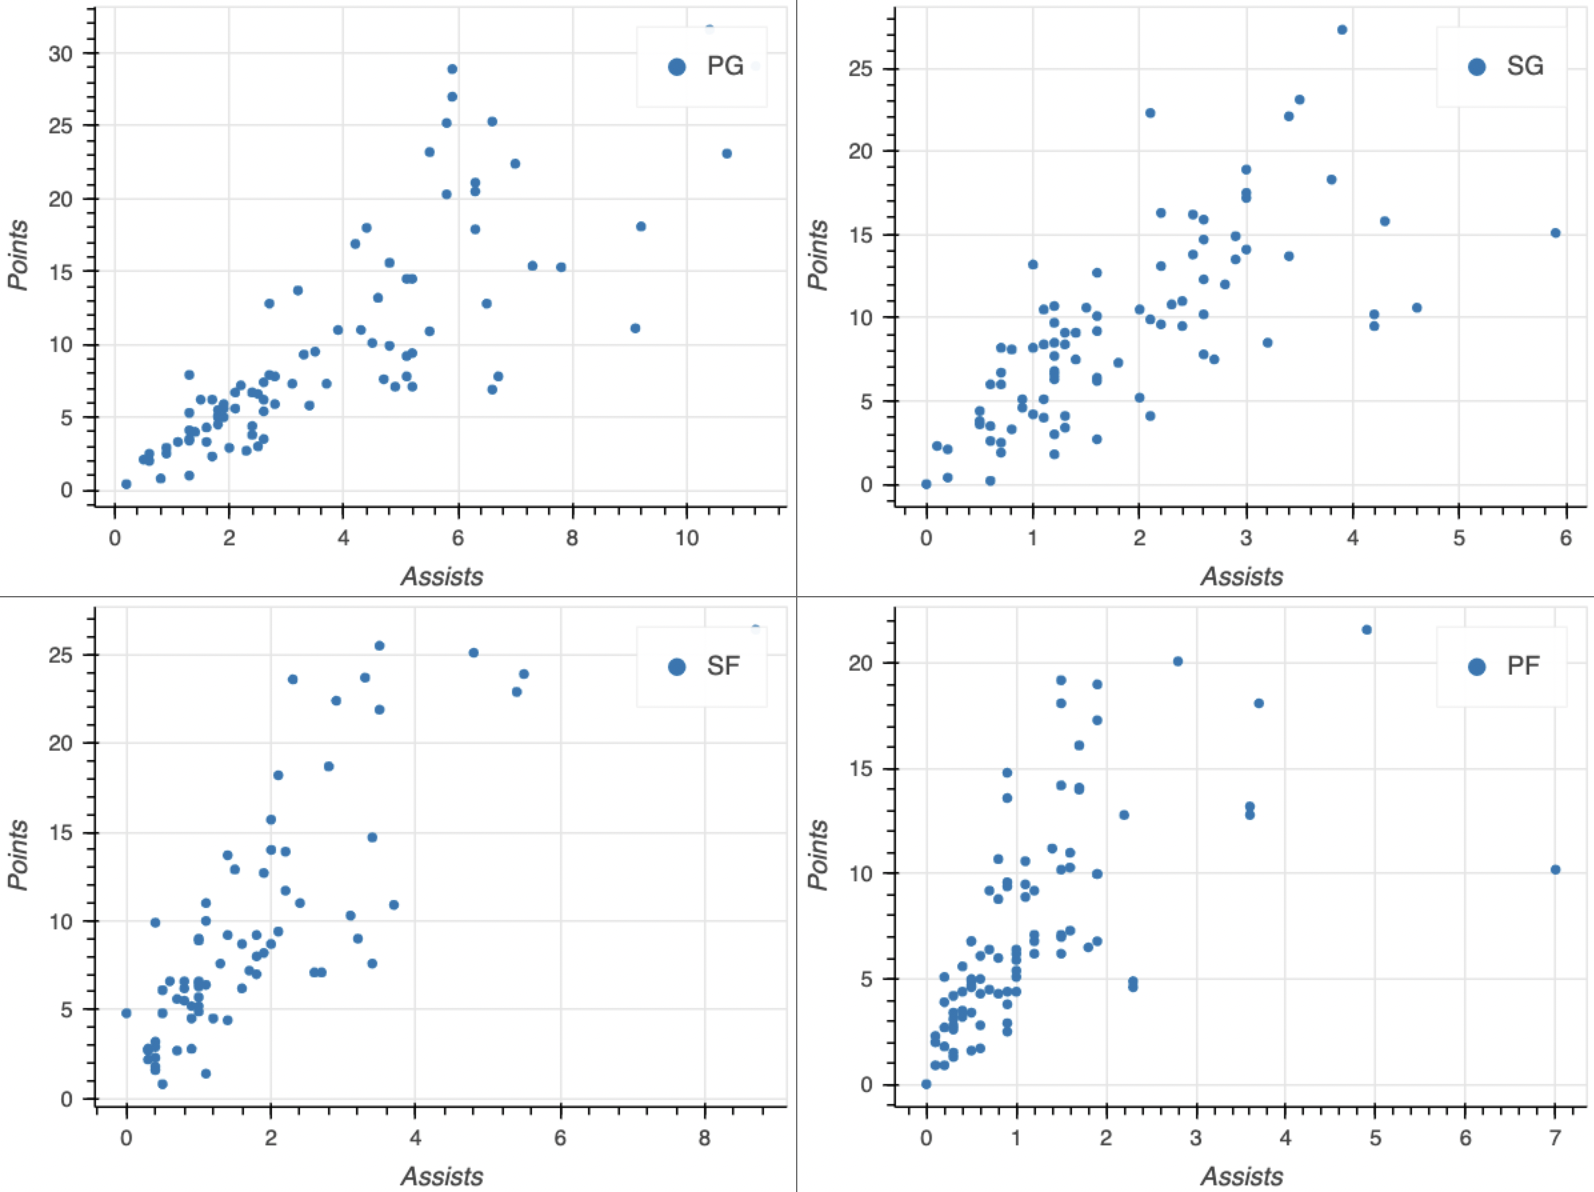
nba_positions = nba.loc[nba["position"] == position] source = ColumnDataSource(data=nba_positions)
fig = figure(x_axis_label="Assists", y_axis_label="Points")
fig.circle(x="assists", y="points", source=source, legend_label=position)
plots.append(fig)
output_file(filename="nba_gridplot.html") show(gridplot(plots, ncols=2))
Interaktive Datenvisualisierung mit Bokeh

Gridplot

Gridplot

Interaktive Datenvisualisierung mit Bokeh

Diagrammgröße anpassen

fig = figure(x_axis_label="Assists", y_axis_label="Rebounds",

width=750, height=300)
fig.circle(x="assists", y="rebounds", source=source) output_file(filename="custom_size_plot.html") show(fig)
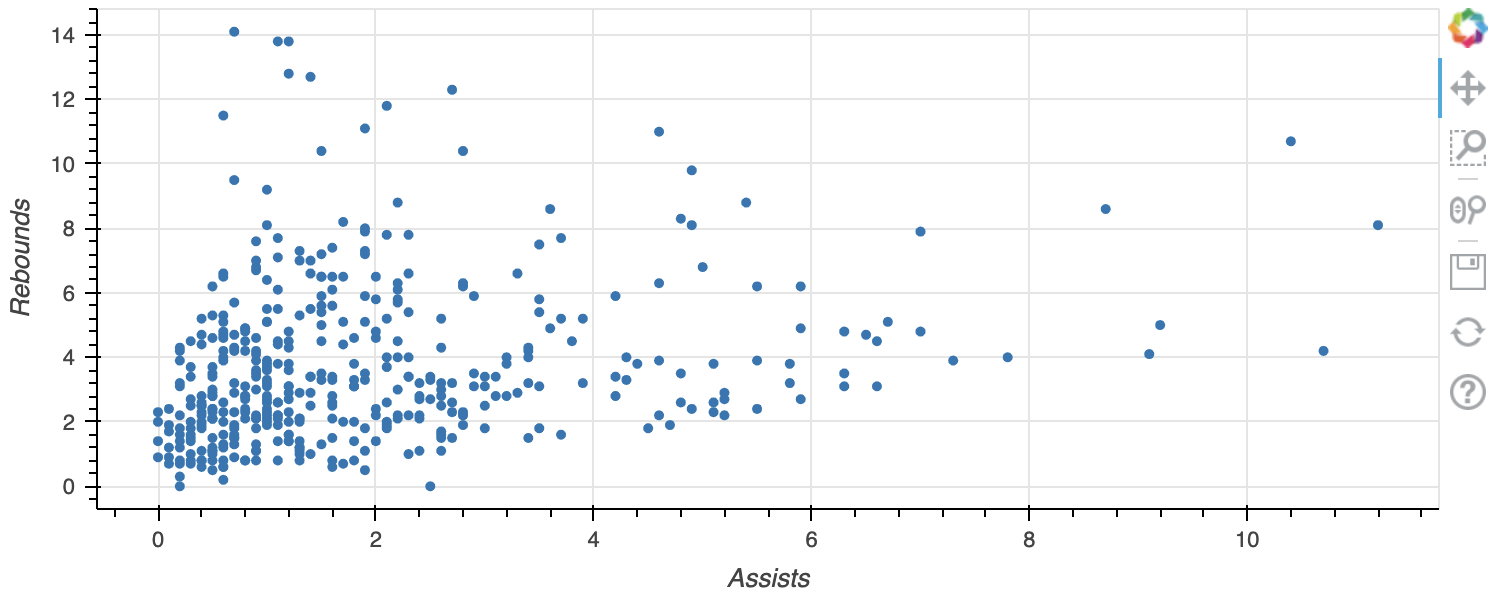
benutzerdefinierte_Größe_Diagramm

Interaktive Datenvisualisierung mit Bokeh

Lass uns üben!

Interaktive Datenvisualisierung mit Bokeh

Preparing Video For Download...