Creación de paneles con shinydashboard
Png Kee Seng
Researcher
dashboardBody() y suele guardarse como bodybody <- dashboardBody(...)

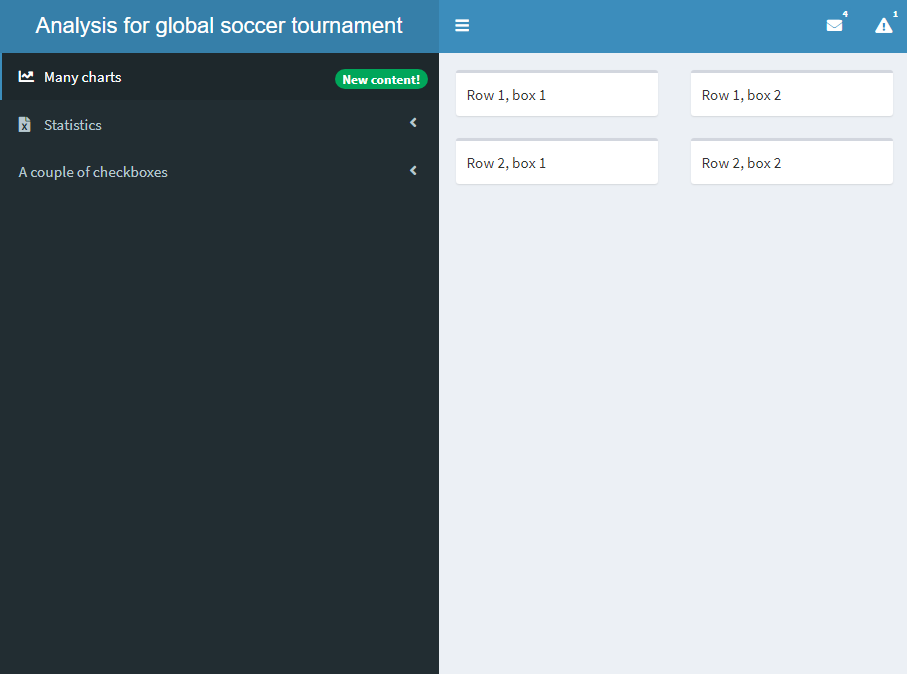
fluidRow()box()
body <- dashboardBody(fluidRow(box("Fila 1, caja 1"), box("Fila 1, caja 2")), fluidRow(box("Fila 2, caja 1"), box("Fila 2, caja 2")))

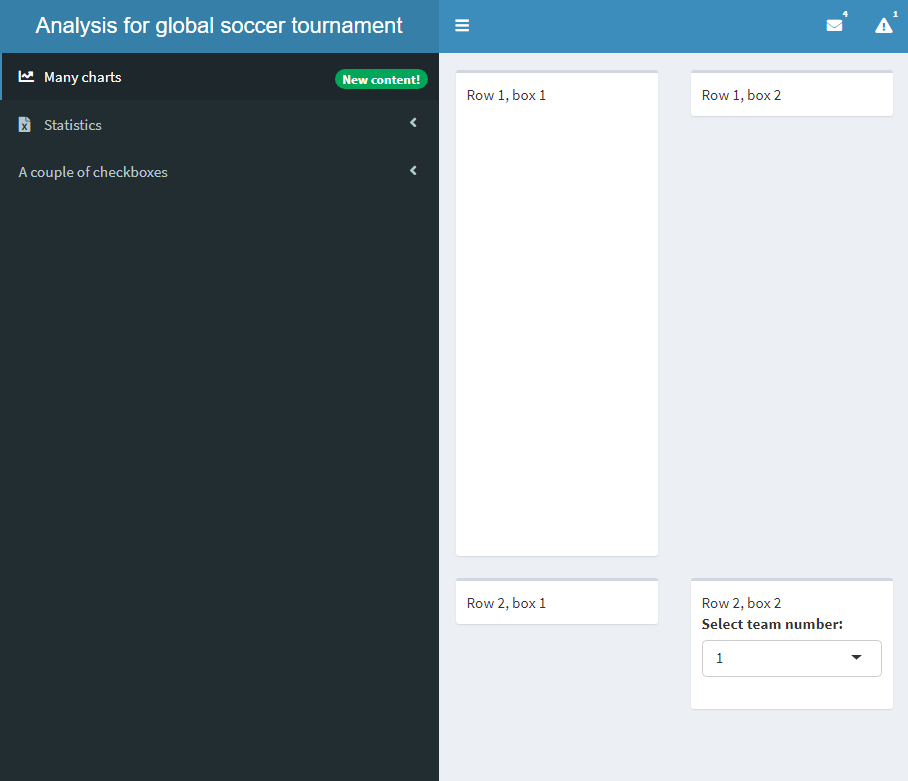
body <- dashboardBody( fluidRow(box("Fila 1, caja 1",plotOutput('plot')),box("Fila 1, caja 2")), fluidRow(box("Fila 2, caja 1"), box("Fila 2, caja 2",selectInput("select", "Selecciona número de equipo:", choices = c(1,2)))))
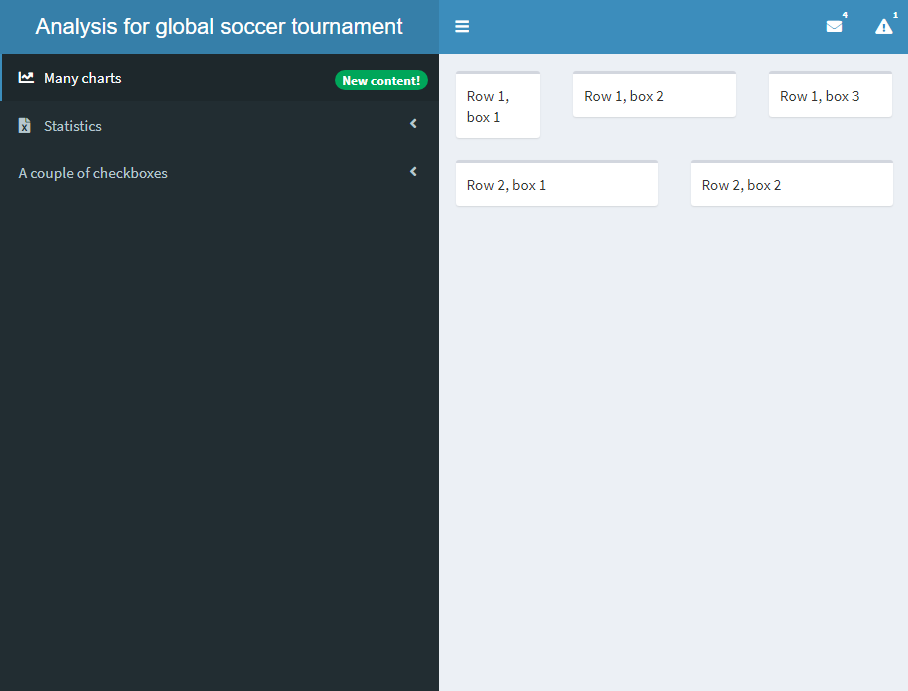
widthbox()
body <- dashboardBody(
fluidRow(box("Fila 1, caja 1"),
box("Fila 1, caja 2"),
box("Fila 1, caja 3")),
fluidRow(box("Fila 2, caja 1"),
box("Fila 2, caja 2"))
)
body <- dashboardBody(
fluidRow(box("Fila 1, caja 1", width = 3),
box("Fila 1, caja 2", width = 5),
box("Fila 1, caja 3", width = 4)),
fluidRow(box("Fila 2, caja 1"),
box("Fila 2, caja 2"))
)
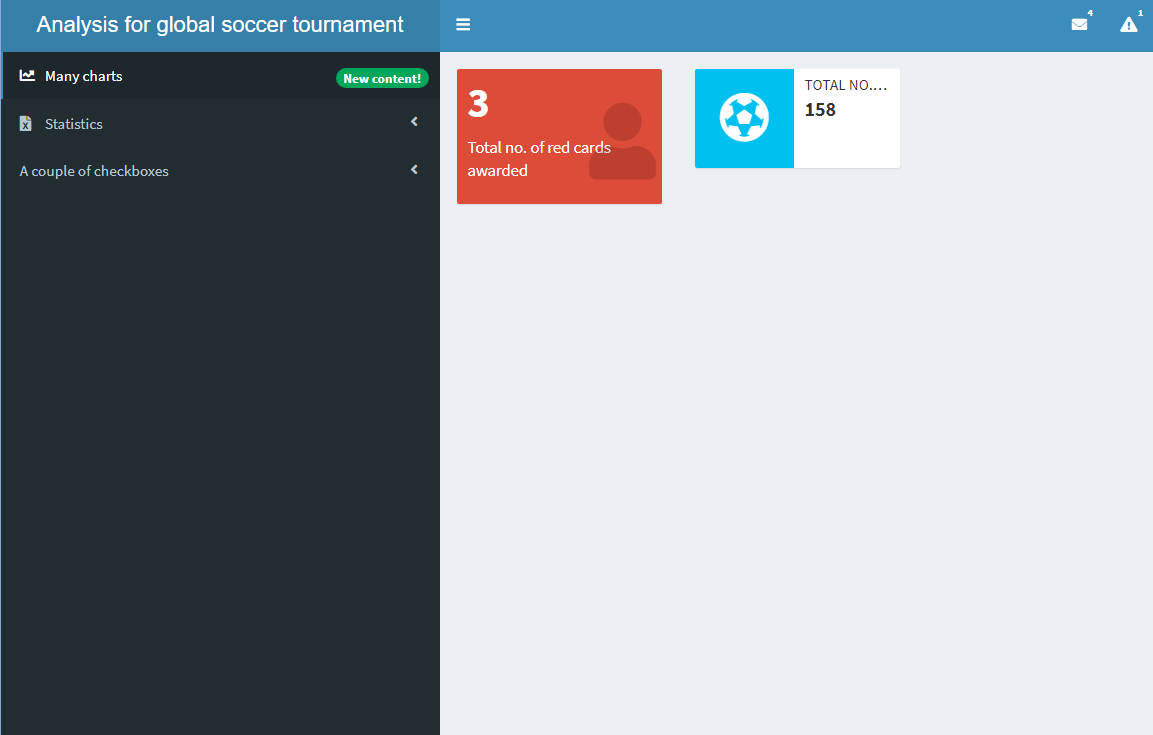
valueBox()infoBox()
body <- dashboardBody( fluidRow(valueBox(value = 3, subtitle = "N.º total de tarjetas rojas", icon = icon("user"), color = "red"),infoBox(value = 158, title = "N.º total de goles", icon = icon("futbol")) ))
valueBox() e infoBox():
valueBoxOutput() e infoBoxOutput()renderValueBox() y renderInfoBox()valueBox() e infoBox()
body <- dashboardBody(
fluidRow(valueBoxOutput(outputId = "valuebox1"),
infoBoxOutput(outputId = "infobox1")
))
server <- function(input, output){
output$valuebox1 <- renderValueBox(
valueBox(3, "N.º total de tarjetas rojas",
icon = icon("user"), color = "red"))
output$infobox1 <- renderInfoBox(
infoBox(158,
title = "N.º total de goles",
icon = icon("futbol")))
}
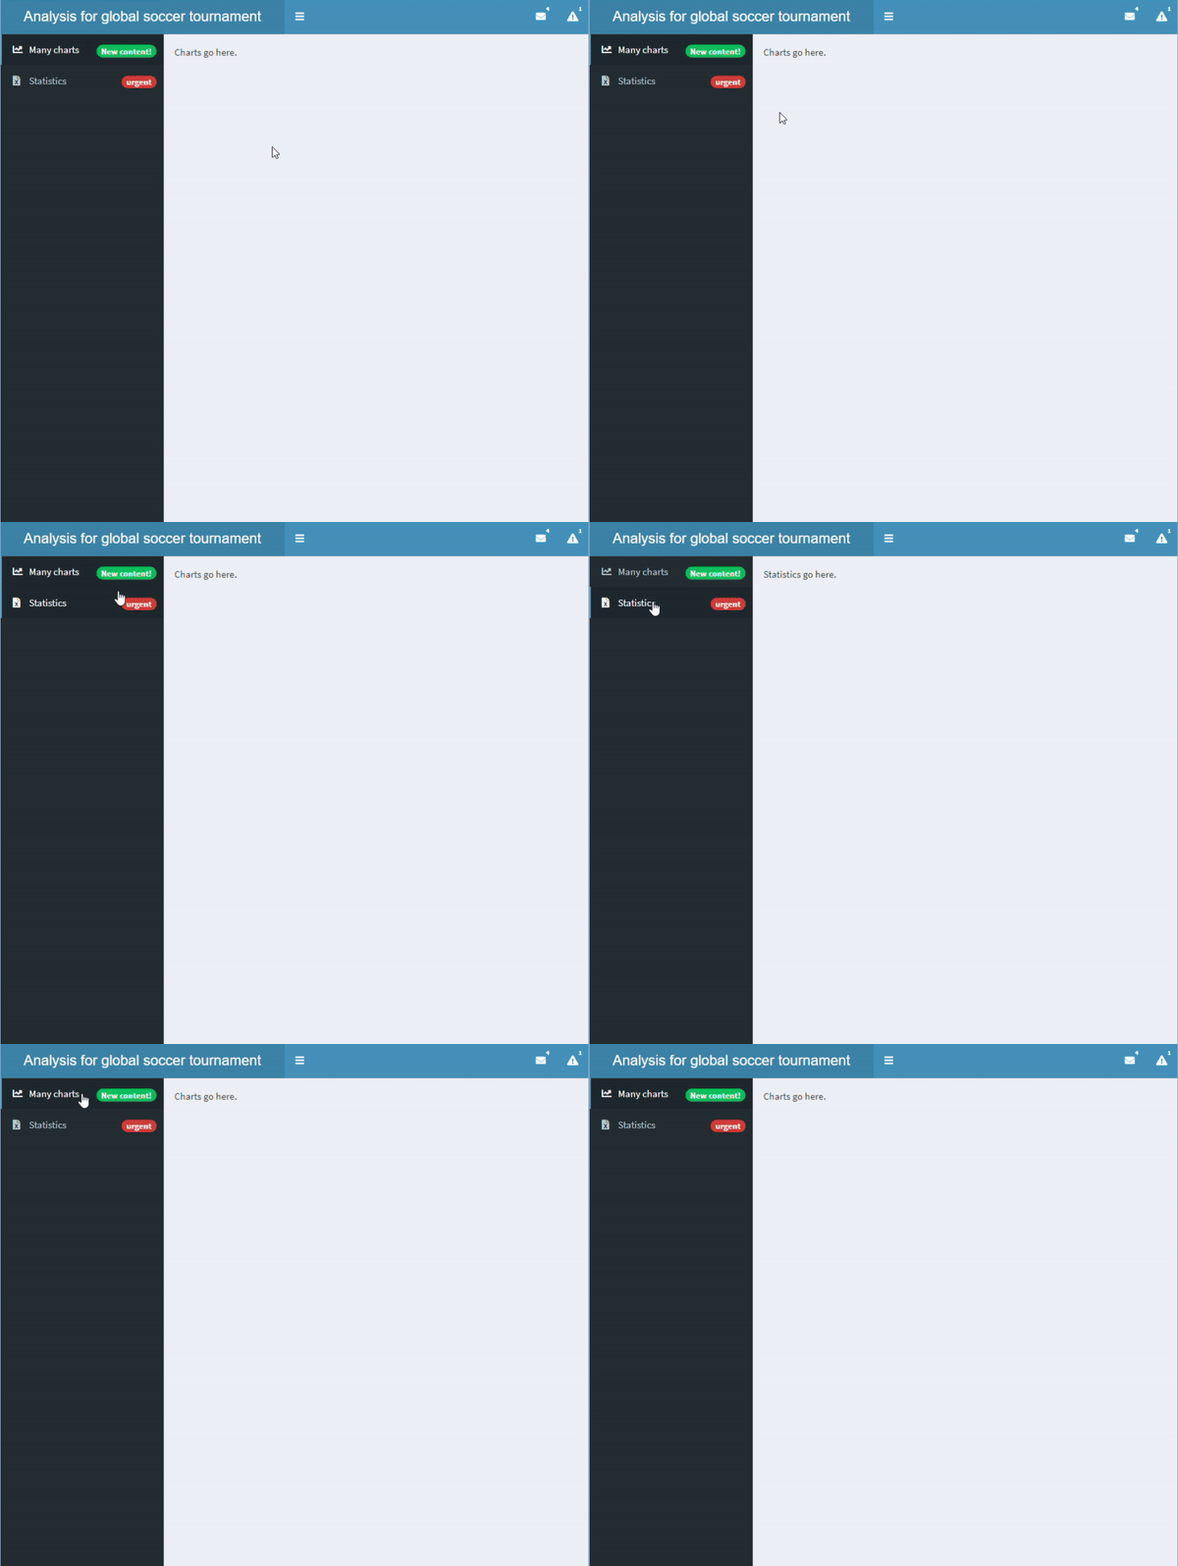
plotOutput():renderPlot():server()ggplot()valueBoxOutput():renderValueBox():server()valueBox()tabItems()tabItem()menuItem()-tabItem() deben coincidir
sidebar <- dashboardSidebar( sidebarMenu( id = "pages",menuItem("Many charts", tabName = "charts", icon = icon("chart-line"), badgeLabel = "New content!", badgeColor = "green"),menuItem("Statistics", icon = icon("file-excel"), tabName = "statistics", badgeLabel = "urgent", badgeColor = "red") ))body <- dashboardBody( tabItems(tabItem("charts", "Aquí van los gráficos." ), tabItem("statistics", "Aquí van las estadísticas." )))
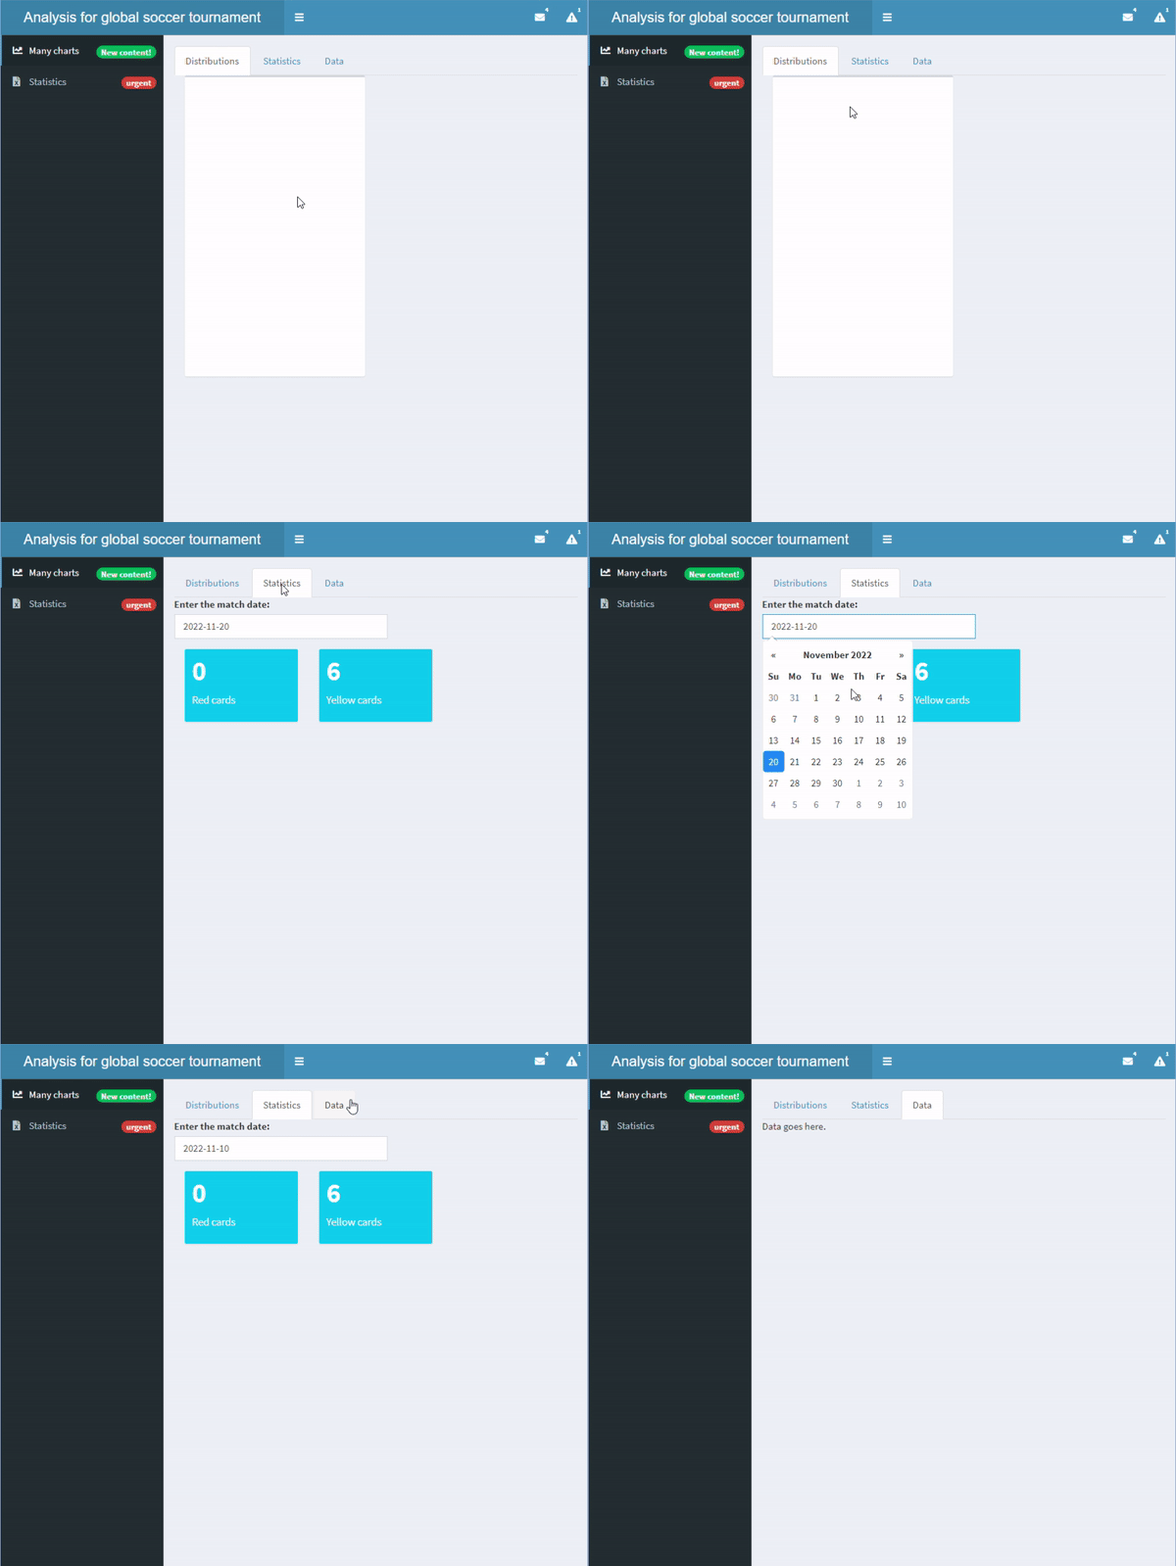
tabsetPanel()tabPanel()tabItems() y tabItem()
body <- dashboardBody(tabsetPanel(tabPanel("Distributions", box(plotOutput("dist"))), tabPanel("Statistics", dateInput("matchdate", "Introduce la fecha del partido:", value = "2022-11-20"), valueBoxOutput("red"), valueBoxOutput("yellow")), tabPanel("Data", "Aquí van los datos.", tableOutput("data"))))server <- function(input, output){ output$red <- renderValueBox(valueBox(0, "Tarjetas rojas")) output$yellow <- renderValueBox(valueBox(6, "Tarjetas amarillas")) }
Creación de paneles con shinydashboard