Análisis de datos del censo de EE. UU. en R
Kyle Walker
Instructor

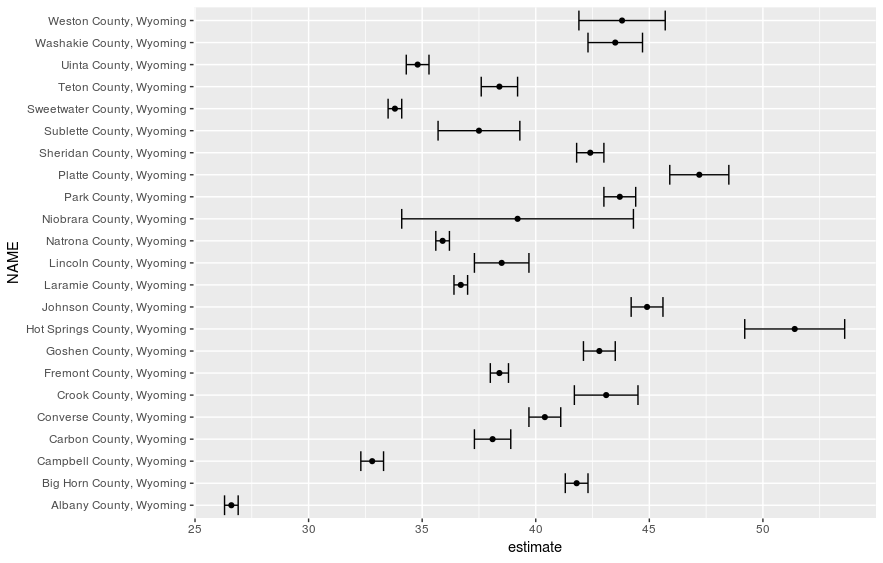
geom_errorbar() y geom_errorbarh()library(tidycensus)
library(tidyverse)
wyoming_age <- get_acs(geography = "county",
variables = c(medianage = "B01002_001"),
state = "WY")
ggplot(wyoming_age, aes(x = estimate, y = NAME)) +
geom_errorbarh(aes(xmin = estimate - moe,
xmax = estimate + moe)) +
geom_point()

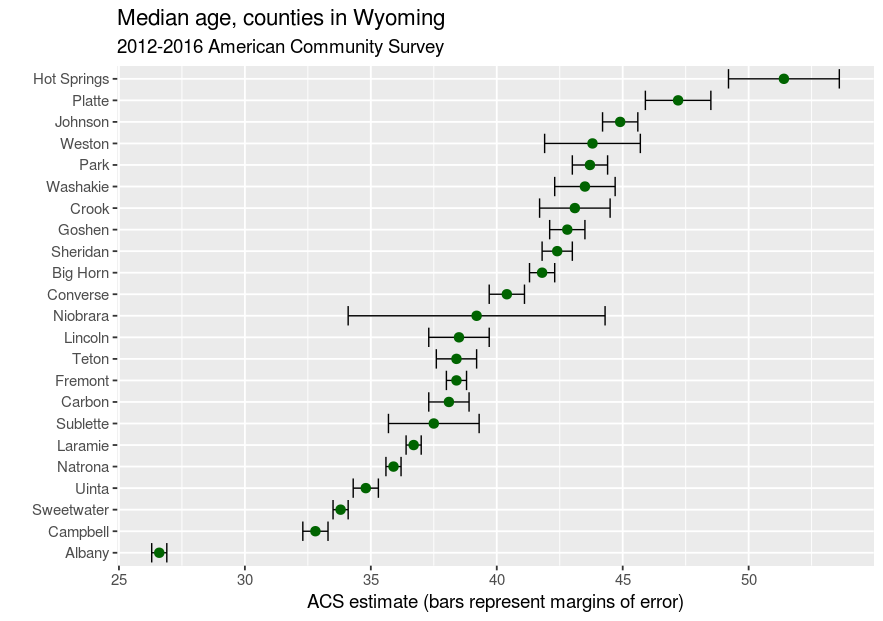
wyoming_age2 <- wyoming_age %>% mutate(NAME = str_replace(NAME, " County, Wyoming", ""))ggplot(wyoming_age2, aes(x = estimate, y = reorder(NAME, estimate))) + geom_errorbarh(aes(xmin = estimate - moe, xmax = estimate + moe)) + geom_point(size = 3, color = "darkgreen") + theme_grey(base_size = 14) + labs(title = "Edad mediana, condados de Wyoming", subtitle = "American Community Survey 2012-2016", x = "Estimación de la ACS (las barras representan márgenes de error)", y = "")

Análisis de datos del censo de EE. UU. en R