Calculating quantiles and histograms
Data Transformation with Polars

Liam Brannigan
Data Scientist & Polars Contributor
Quantiles and histograms
reviews = pl.read_csv("restaurants_quantiles.csv")
shape: (15, 4)
| business         | location      | review | price |
| ---              | ---           | ---    | ---   |
| str              | str           | f64    | i64   |
|------------------|---------------|--------|-------|
| 7burgers         | Wakey Wakey   | 4.2    | 15    |
| Bang Bang Burger | Forest Rd.    | 3.8    | 12    |
| ...              | ...           | ...    | ...   |
| The Old Ivy      | Angel         | 4.1    | 28    |
| Franco Manca     | Brixton Rd.   | 4.0    | 22    |
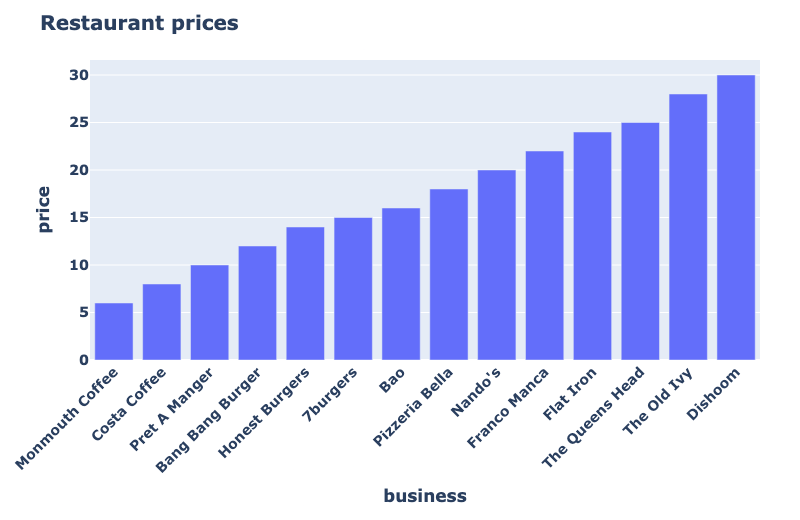
Quantile-based categorization
Quantile-based categorization
Quantile-based categorization
Reviews dataset
reviews = pl.read_csv("restaurants_quantiles.csv")
shape: (15, 4)
| business         | location      | review | price |
| ---              | ---           | ---    | ---   |
| str              | str           | f64    | i64   |
|------------------|---------------|--------|-------|
| 7burgers         | Wakey Wakey   | 4.2    | 15    |
| Bang Bang Burger | Forest Rd.    | 3.8    | 12    |
| ...              | ...           | ...    | ...   |
| The Old Ivy      | Angel         | 4.1    | 28    |
| Franco Manca     | Brixton Rd.   | 4.0    | 22    |
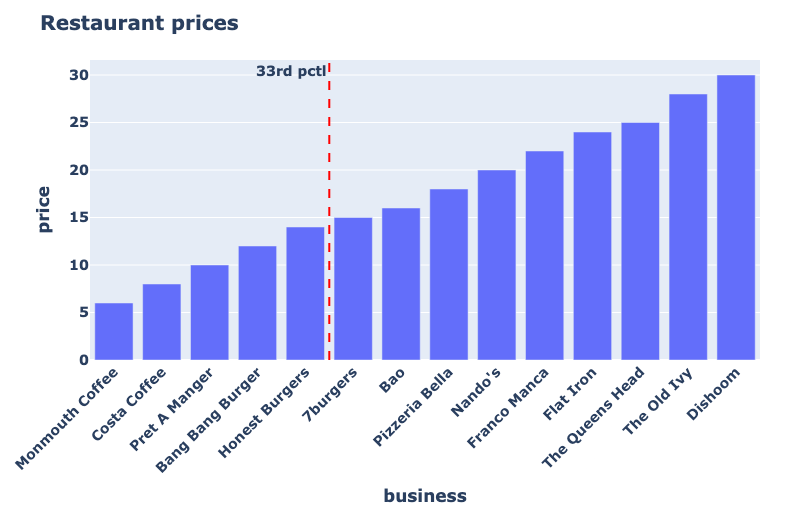
Compute quantiles
reviews.select(


)
Compute quantiles
reviews.select(
    pl.col("price")

)
Compute quantiles
reviews.select(
    pl.col("price").quantile(0.33)

)
Compute quantiles
reviews.select(
    pl.col("price").quantile(0.33).alias("budget_cutoff"),

)
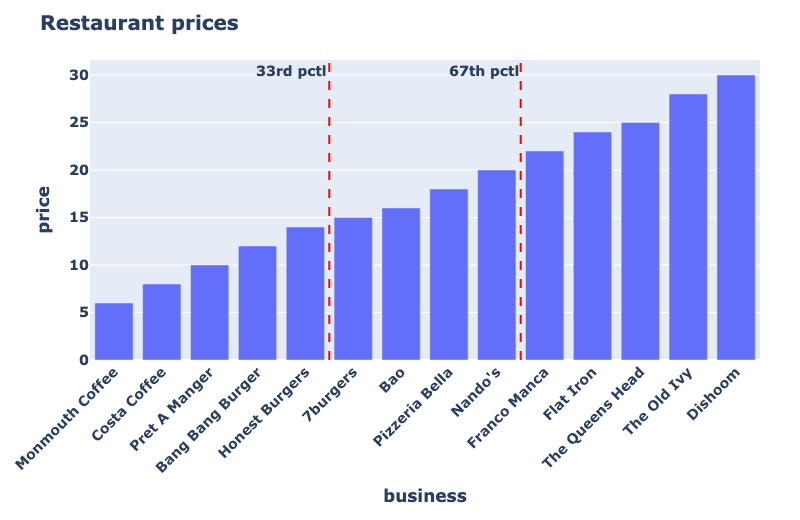
Compute quantiles
reviews.select(
    pl.col("price").quantile(0.33).alias("budget_cutoff"),
    pl.col("price").quantile(0.67).alias("mid_cutoff")
)
shape: (1, 2)
| budget_cutoff | mid_cutoff |
| ---           | ---        |
| f64           | f64        |
|---------------|------------|
| 14.0          | 20.0       |
Using quantiles to create categories
reviews.with_columns(
    pl.when(pl.col("price") <= pl.col("price").quantile(0.33)).then(pl.lit("budget"))


)
Using quantiles to create categories
reviews.with_columns(
    pl.when(pl.col("price") <= pl.col("price").quantile(0.33)).then(pl.lit("budget"))
    .when(pl.col("price") <= pl.col("price").quantile(0.67)).then(pl.lit("mid"))

)
Using quantiles to create categories
reviews.with_columns(
    pl.when(pl.col("price") <= pl.col("price").quantile(0.33)).then(pl.lit("budget"))
    .when(pl.col("price") <= pl.col("price").quantile(0.67)).then(pl.lit("mid"))
    .otherwise(pl.lit("premium")).alias("price_band")
)
shape: (15, 5)
| business         | location      | review | price | price_band |
| ---              | ---           | ---    | ---   | ---        |
| str              | str           | f64    | i64   | str        |
|------------------|---------------|--------|-------|------------|
| 7burgers         | Wakey Wakey   | 4.2    | 15    | mid        |
| Bang Bang Burger | Forest Rd.    | 3.8    | 12    | budget     |
| ...              | ...           | ...    | ...   | ...        |
Quantile versus Fixed breaks
$$
Quantile thresholds
- Based on current data
- Balanced group sizes
- Adapts as data changes
$$
Fixed thresholds
- Example: 10 and 20 pounds
- Unknown group sizes
- Easy to understand
Categories with fixed thresholds
reviews.with_columns(


)
Categories with fixed thresholds
reviews.with_columns(
    pl.col("price")

)
Categories with fixed thresholds
reviews.with_columns(
    pl.col("price")
    .cut(
)
Categories with fixed thresholds
reviews.with_columns(
    pl.col("price")
    .cut(breaks=[10, 20]
)
Categories with fixed thresholds
reviews.with_columns(
    pl.col("price")
    .cut(breaks=[10, 20], labels=["budget", "mid", "premium"])
)
Categories with fixed thresholds
reviews.with_columns(
    pl.col("price")
    .cut(breaks=[10, 20], labels=["budget", "mid", "premium"]).alias("price_band")
)
shape: (15, 5)
| business         | location      | review | price | price_band |
| ---              | ---           | ---    | ---   | ---        |
| str              | str           | f64    | i64   | cat        |
|------------------|---------------|--------|-------|------------|
| 7burgers         | Wakey Wakey   | 4.2    | 15    | mid        |
| Costa Coffee     | City Point    | 4.5    | 8     | budget     |
| The Queens Head  | Denman St.    | 4.7    | 25    | premium    |
| ...              | ...           | ...    | ...   | ...        |
Build a histogram
reviews["price"]
Build a histogram
reviews["price"].hist()
shape: (10, 3)
| breakpoint | category     | count |
| ---        | ---          | ---   |
| f64        | cat          | u32   |
|------------|--------------|-------|
| 8.4        | [6.0, 8.4]   | 3     |
| 10.8       | (8.4, 10.8]  | 1     |
| ...        | ...          | ...   |
| 27.6       | (25.2, 27.6] | 0     |
| 30.0       | (27.6, 30.0] | 2     |
Build a histogram with defined bin count
reviews["price"].hist(bin_count=5)
shape: (5, 3)
| breakpoint | category      | count |
| ---        | ---           | ---   |
| f64        | cat           | u32   |
|------------|---------------|-------|
| 10.8       | [6.0, 10.8]   | 4     |
| 15.6       | (10.8, 15.6]  | 3     |
| 20.4       | (15.6, 20.4]  | 3     |
| 25.2       | (20.4, 25.2]  | 3     |
| 30.0       | (25.2, 30.0]  | 2     |
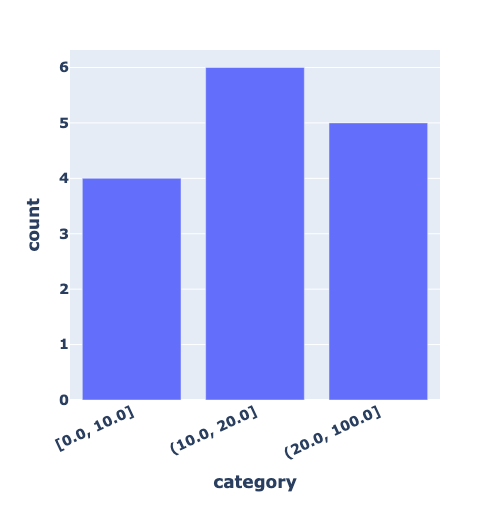
Build a histogram with defined breakpoints
reviews["price"].hist(bins=[0, 10, 20, 100])
shape: (3, 3)
| breakpoint | category       | count |
| ---        | ---            | ---   |
| f64        | cat            | u32   |
|------------|----------------|-------|
| 10.0       | [0.0, 10.0]    | 4     |
| 20.0       | (10.0, 20.0]   | 6     |
| 100.0      | (20.0, 100.0]  | 5     |
Plot the histogram
import plotly.express as pxhist = reviews["price"].hist(bins=[0, 10, 20, 100])
Plot the histogram
import plotly.express as px


hist = reviews["price"].hist(bins=[0, 10, 20, 100])
fig = px.bar(hist, x="category", y="count")
fig.show()
Plot the histogram
Let's practice!
Data Transformation with Polars

