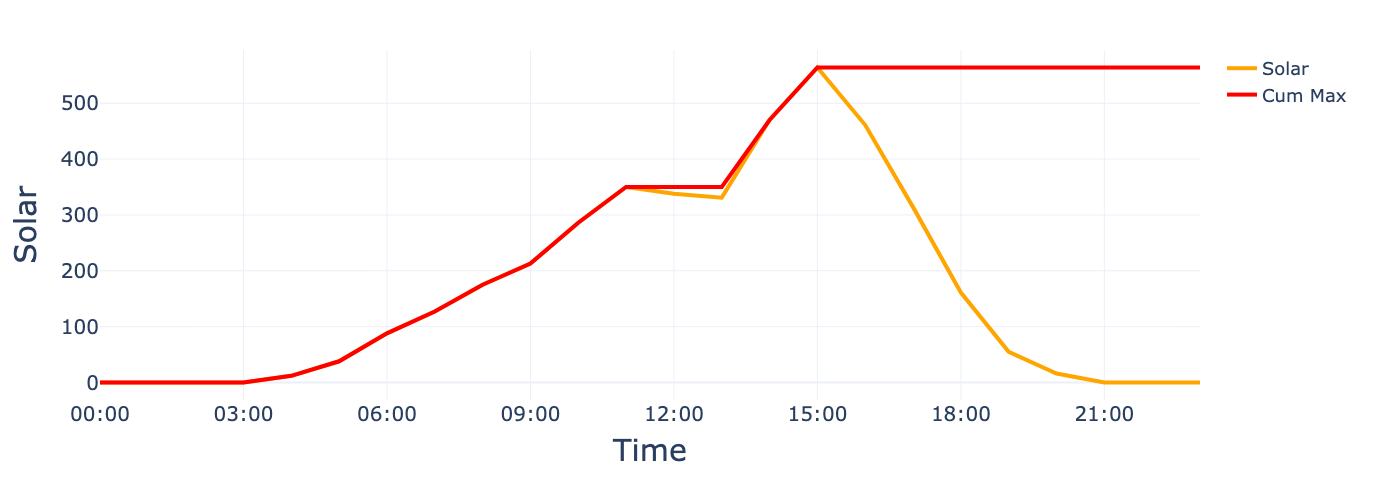
Rolling and cumulative aggregations
Data Transformation with Polars

Liam Brannigan
Data Scientist & Polars Contributor
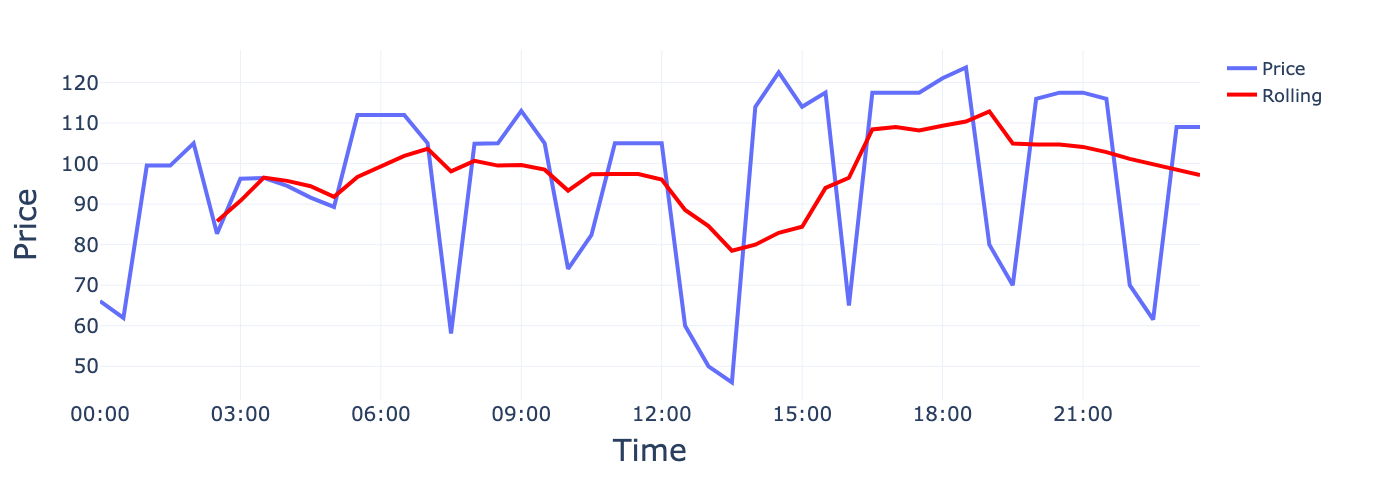
Why rolling statistics?
Why rolling statistics?
Why cumulative statistics?
- Task: calculate cumulative values
Why cumulative statistics?