Activity of zebrafish and melatonin
Case Studies in Statistical Thinking

Justin Bois
Lecturer, Caltech
![]()
Warming up with zebrafish
![]()
1 Movie courtesy of David Prober, Caltech
Nomenclature
- Mutant: Has the mutation on both chromosomes
- Wild type: Does not have the mutation
Activity of fish, day and night
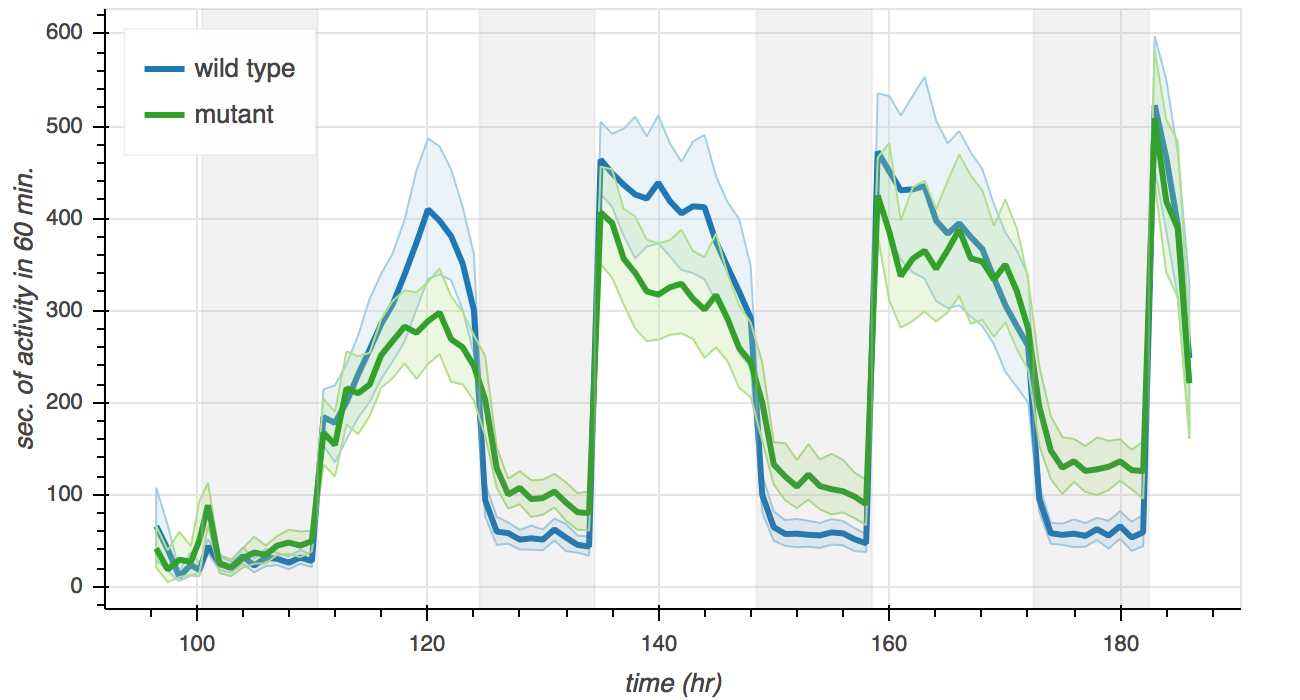
1 Data courtesy of Avni Gandhi, Grigorios Oikonomou, and David Prober, Caltech
Active bouts: a metric for wakefulness
- Active bout: A period of time where a fish is consistently active
- Active bout length: Number of consecutive minutes with activity
Probability distributions and stories
- Probability distribution: A mathematical description of outcomes
- A probability distribution has a story
The Exponential distribution
- Poisson process: The timing of the next event is completely independent of when the previous event happened
- Story of the Exponential distribution: The waiting time between arrivals of a Poisson process is Exponentially distributed
The Exponential CDF
x, y = ecdf(nuclear_incident_times)

_ = plt.plot(x, y, marker='.', linestyle='none')
![]()
1 Data source: Wheatley, Sovacool, and Sornette, Nuclear Events Database
The Exponential CDF
x, y = ecdf(nuclear_incident_times)

_ = plt.plot(x, y, marker='.', linestyle='none')
![]()
1 Data source: Wheatley, Sovacool, and Sornette, Nuclear Events Database
Using the dc_stat_think module
x, y = dcst.ecdf(nuclear_incident_times)
% pip install dc_stat_think

