Bootstrap confidence intervals
Case Studies in Statistical Thinking

Justin Bois
Lecturer, Caltech
EDA is the first step
"Exploratory data analysis can never be the whole story, but nothing else can serve as a foundation stone, as the first step."
--John Tukey
Active bout length ECDFs
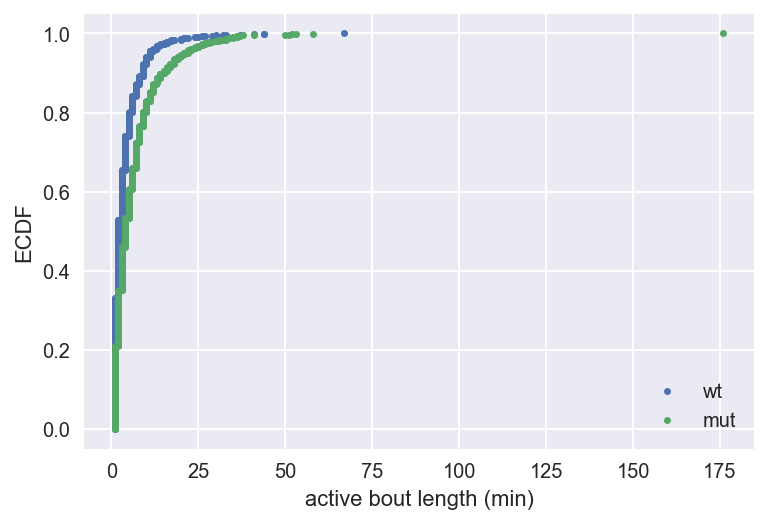
1 Data courtesy of Avni Gandhi, Grigorios Oikonomou, and David Prober, Caltech
Optimal parameter value
- Optimal parameter value: The value of the parameter of a probability distribution that best describes the data
- Optimal parameter for the Exponential distribution: Computed from the mean of the data
np.mean(nuclear_incident_times)
87.140350877192986
![]()
1 Data source: Wheatley, Sovacool, and Sornette, Nuclear Events Database
Bootstrap sample
A resampled array of the data
# Resample nuclear_incident_times with replacement
bs_sample = np.random.choice(
  nuclear_incident_times,
  replace=True,
  size=len(inter_times)
)
Bootstrap replicates
![]()
1 Data source: Wheatley, Sovacool, and Sornette, Nuclear Events Database
Bootstrap replicates
![]()
1 Data source: Wheatley, Sovacool, and Sornette, Nuclear Events Database
Bootstrap replicates
![]()
1 Data source: Wheatley, Sovacool, and Sornette, Nuclear Events Database
Bootstrap replicates
![]()
1 Data source: Wheatley, Sovacool, and Sornette, Nuclear Events Database
Bootstrap replicates
Bootstrap replicate: A statistic computed from a bootstrap sample
dcst.draw_bs_reps()
Function to draw bootstrap replicates from a dataset
# Draw 10000 replicates of the mean from
# nuclear_incident_times
bs_reps = dcst.draw_bs_reps(
  nuclear_incident_times, np.mean, size=10000
)
The bootstrap confidence interval
![]()
1 Data source: Wheatley, Sovacool, and Sornette, Nuclear Events Database
The bootstrap confidence interval
If we repeated measurements over and over again, p% of the observed values would lie within the p% confidence interval
The bootstrap confidence interval
np.percentile(bs_reps, [2.5, 97.5])
array([ 73.31505848, 102.39181287])

