Modelagem de Risco de Crédito em R
Lore Dirick
Manager of Data Science Curriculum at Flatiron School


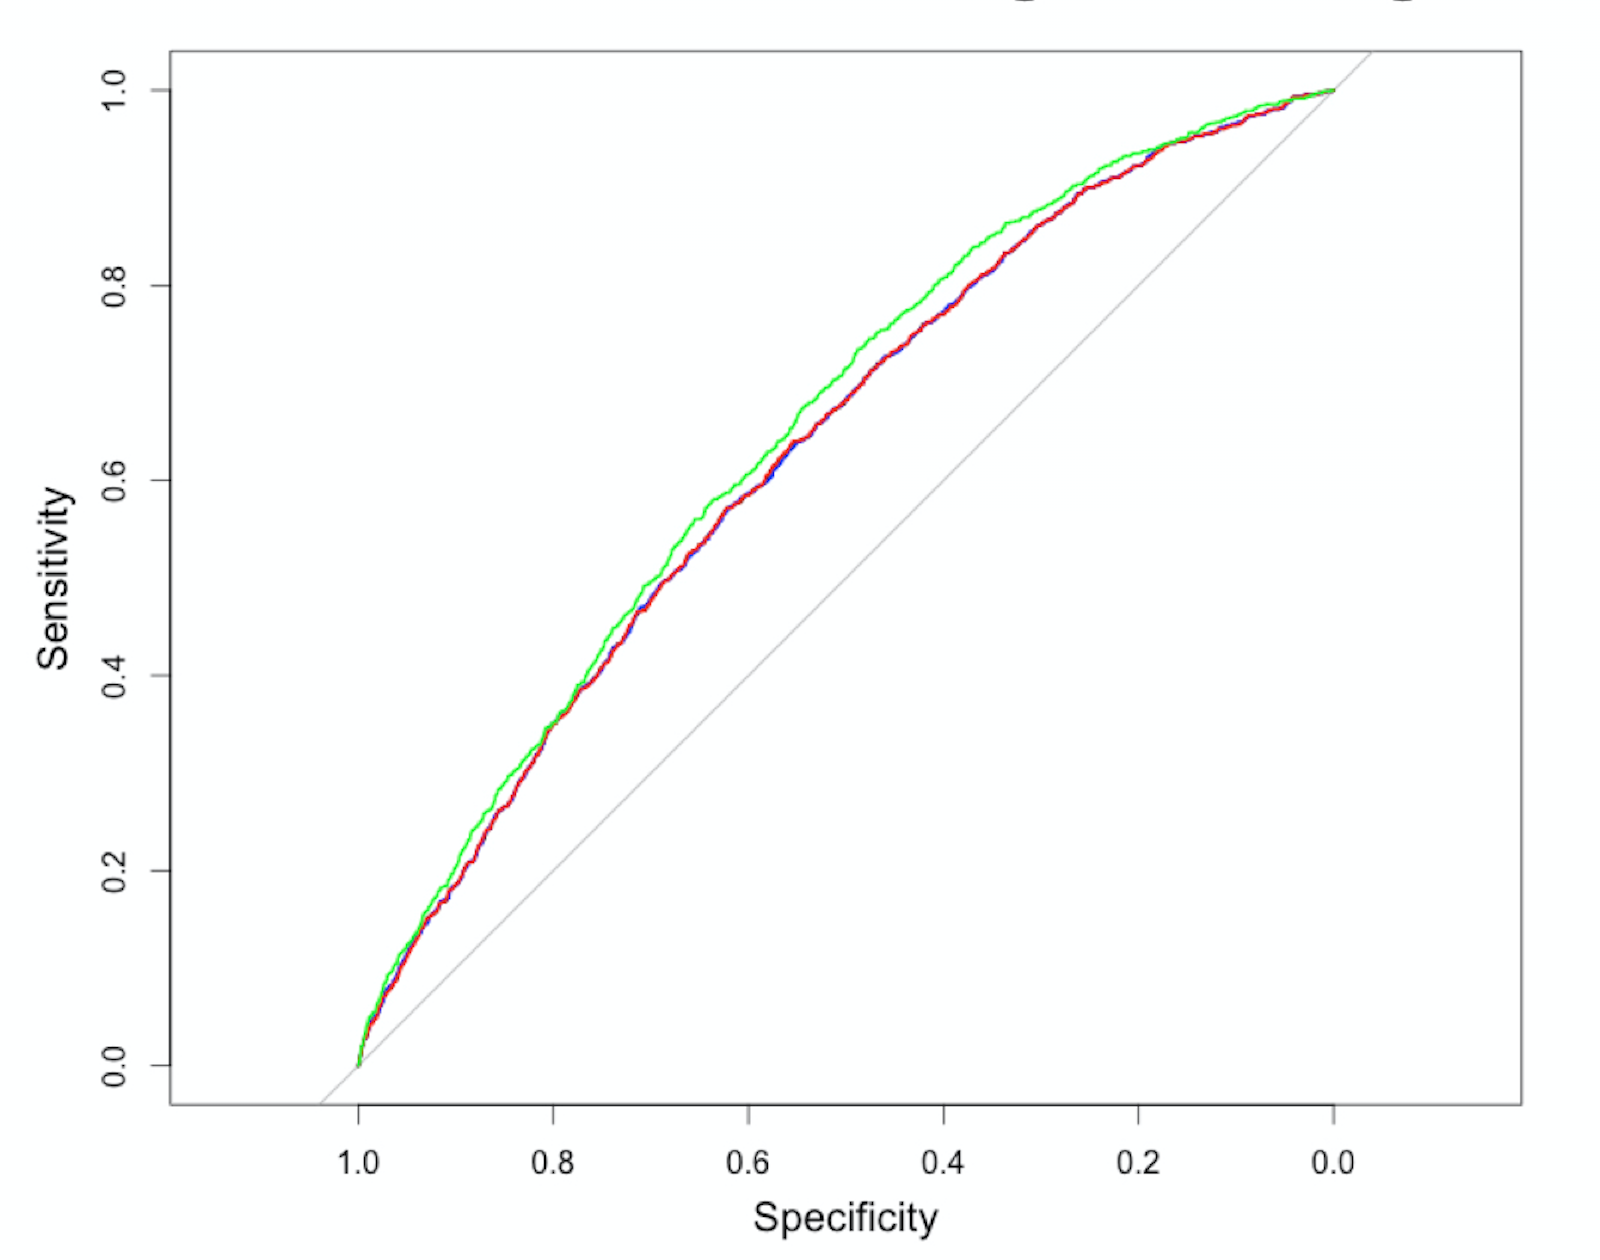
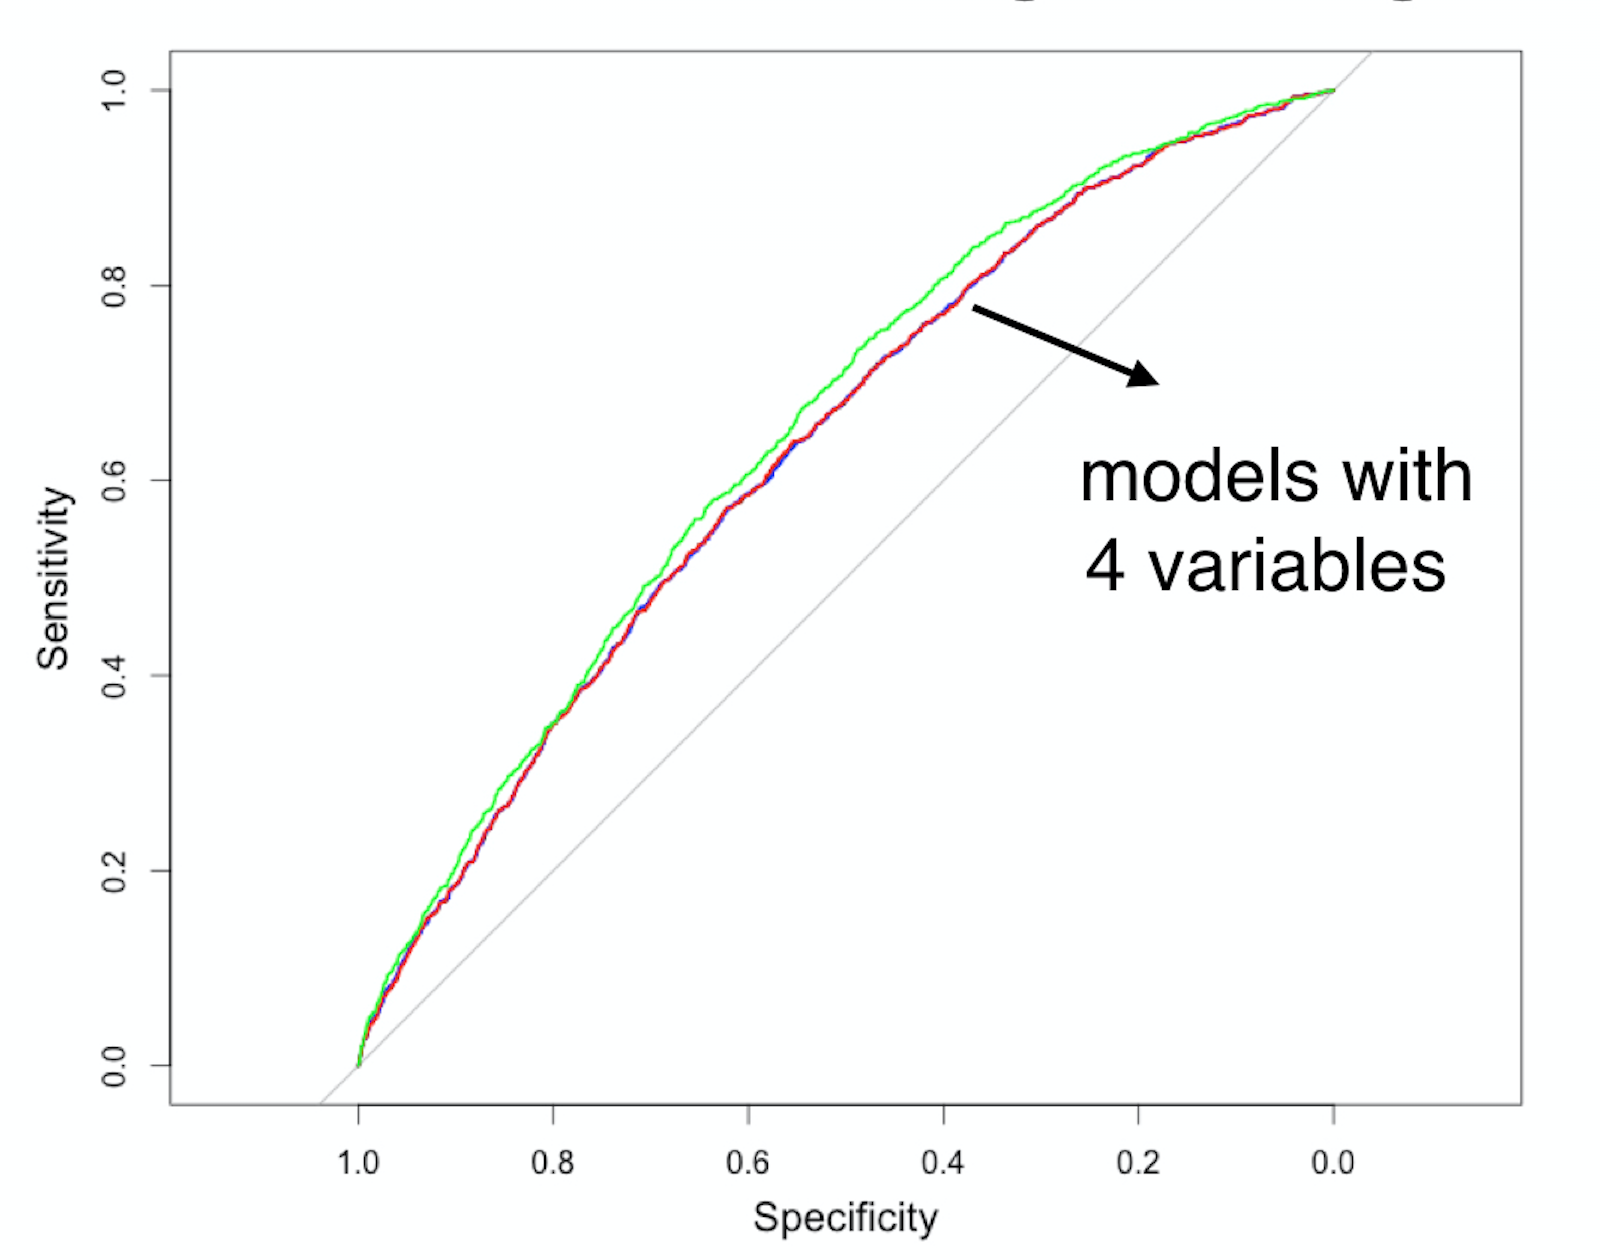
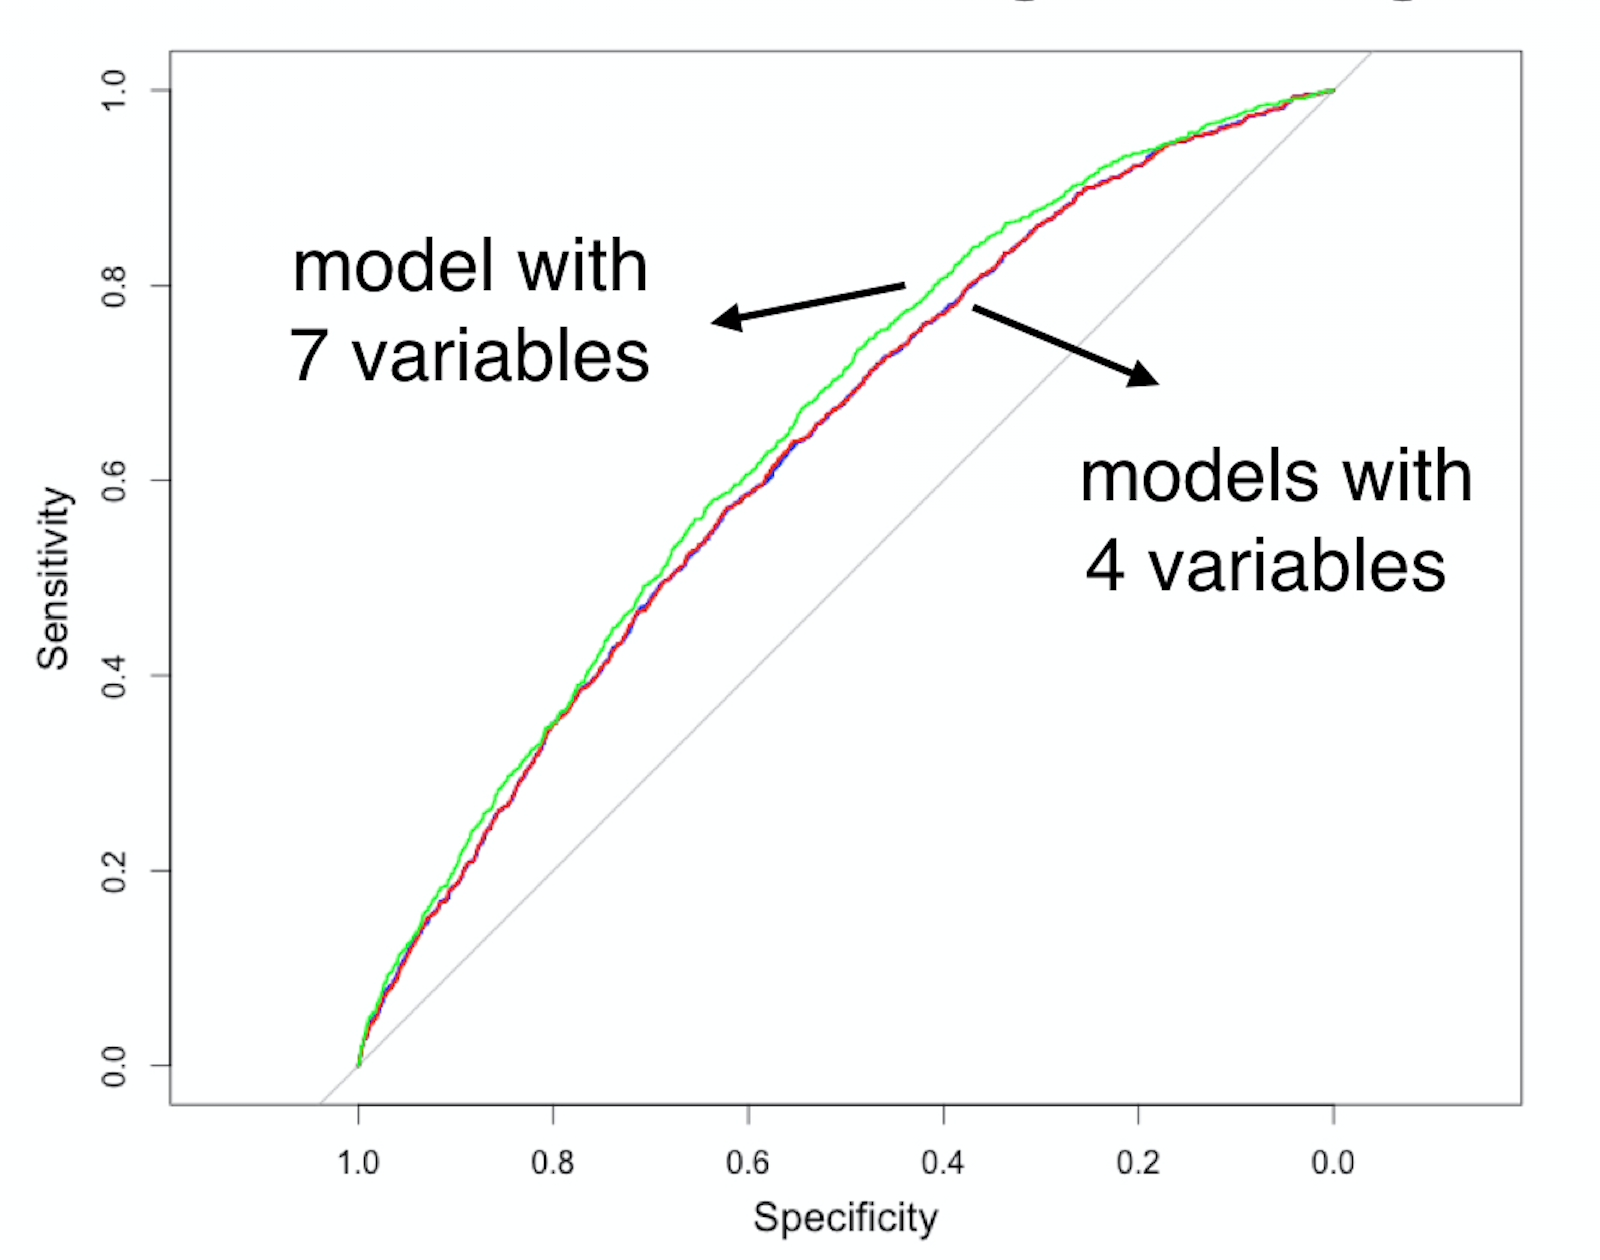
1) Comece com um modelo incluindo todas as variáveis (no nosso caso, 7) e calcule o AUC
log_model_full <- glm(loan_status ~ loan_amnt + grade + home_ownership +
annual_inc + age + emp_cat + ir_cat,
family = "binomial", data = training_set)
predictions_model_full <- predict(log_model_full,
newdata = test_set, type ="response")
AUC_model_full <- auc(test_set$loan_status, predictions_model_full)
Area under the curve: 0.6512
2) Construa 7 novos modelos, removendo uma variável de cada vez, e faça previsões de PD usando o conjunto de teste
log_1_remove_amnt <- glm(loan_status ~ grade + home_ownership + annual_inc + age + emp_cat + ir_cat,
family = "binomial",
data = training_set)
log_1_remove_grade <- glm(loan_status ~ loan_amnt + home_ownership + annual_inc + age + emp_cat + ir_cat,
family = "binomial",
data = training_set)
log_1_remove_home <- glm(loan_status ~ loan_amnt + grade + annual_inc + age + emp_cat + ir_cat,
family = "binomial",
data = training_set)
pred_1_remove_amnt <- predict(log_1_remove_amnt, newdata = test_set, type = "response")
pred_1_remove_grade <- predict(log_1_remove_grade, newdata = test_set, type = "response")
pred_1_remove_home <- predict(log_1_remove_home, newdata = test_set, type = "response")
...
3) Fique com o modelo que teve o melhor AUC (AUC do modelo completo: 0.6512)
auc(test_set$loan_status, pred_1_remove_amnt)
Area under the curve: 0.6537
auc(test_set$loan_status, pred_1_remove_grade)
Area under the curve: 0.6438
auc(test_set$loan_status, pred_1_remove_home)
Area under the curve: 0.6537
4) Repita até o AUC cair (significativamente)
Modelagem de Risco de Crédito em R