Visualização Interativa de Dados Intermediária com plotly em R
Adam Loy
Statistician, Carleton College
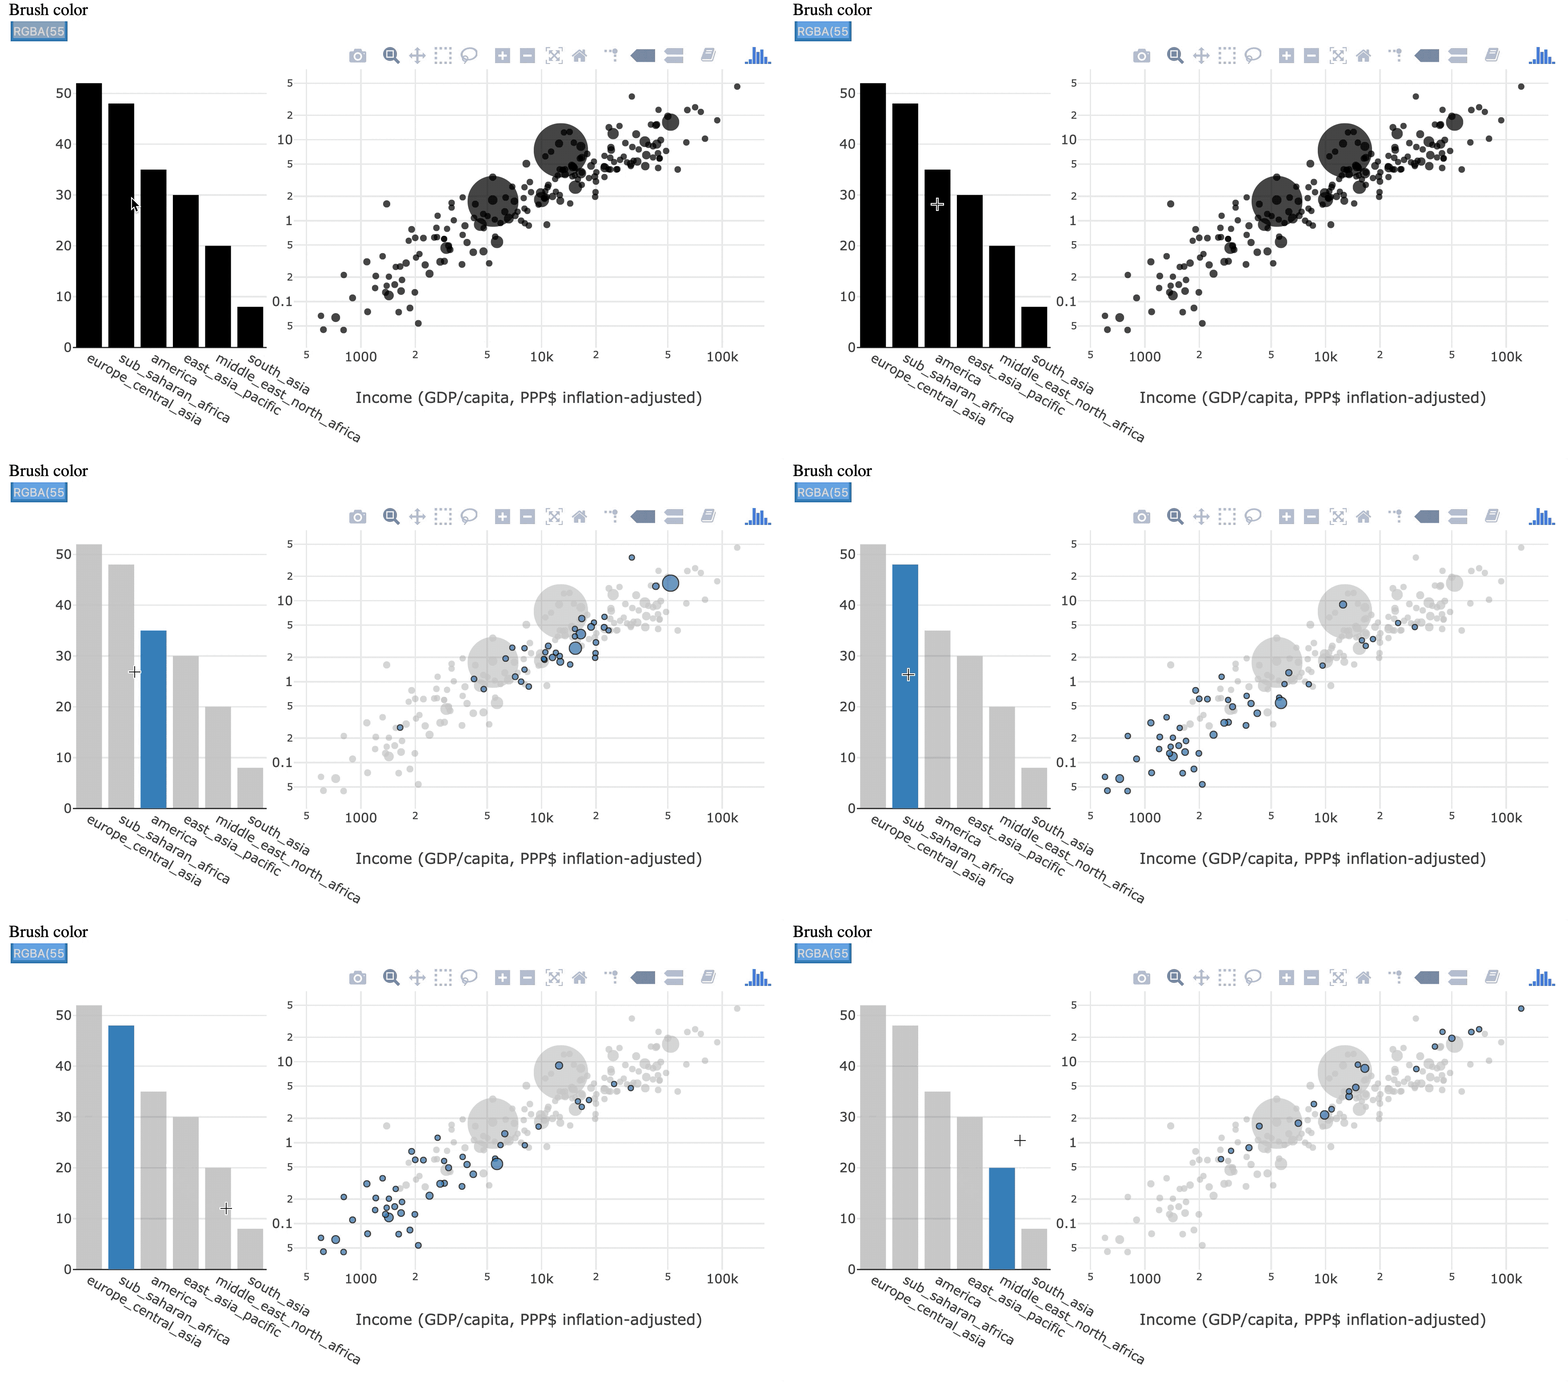
Seleção transitória
casos selecionados antes são esquecidos

Seleção persistente
casos selecionados se acumulam


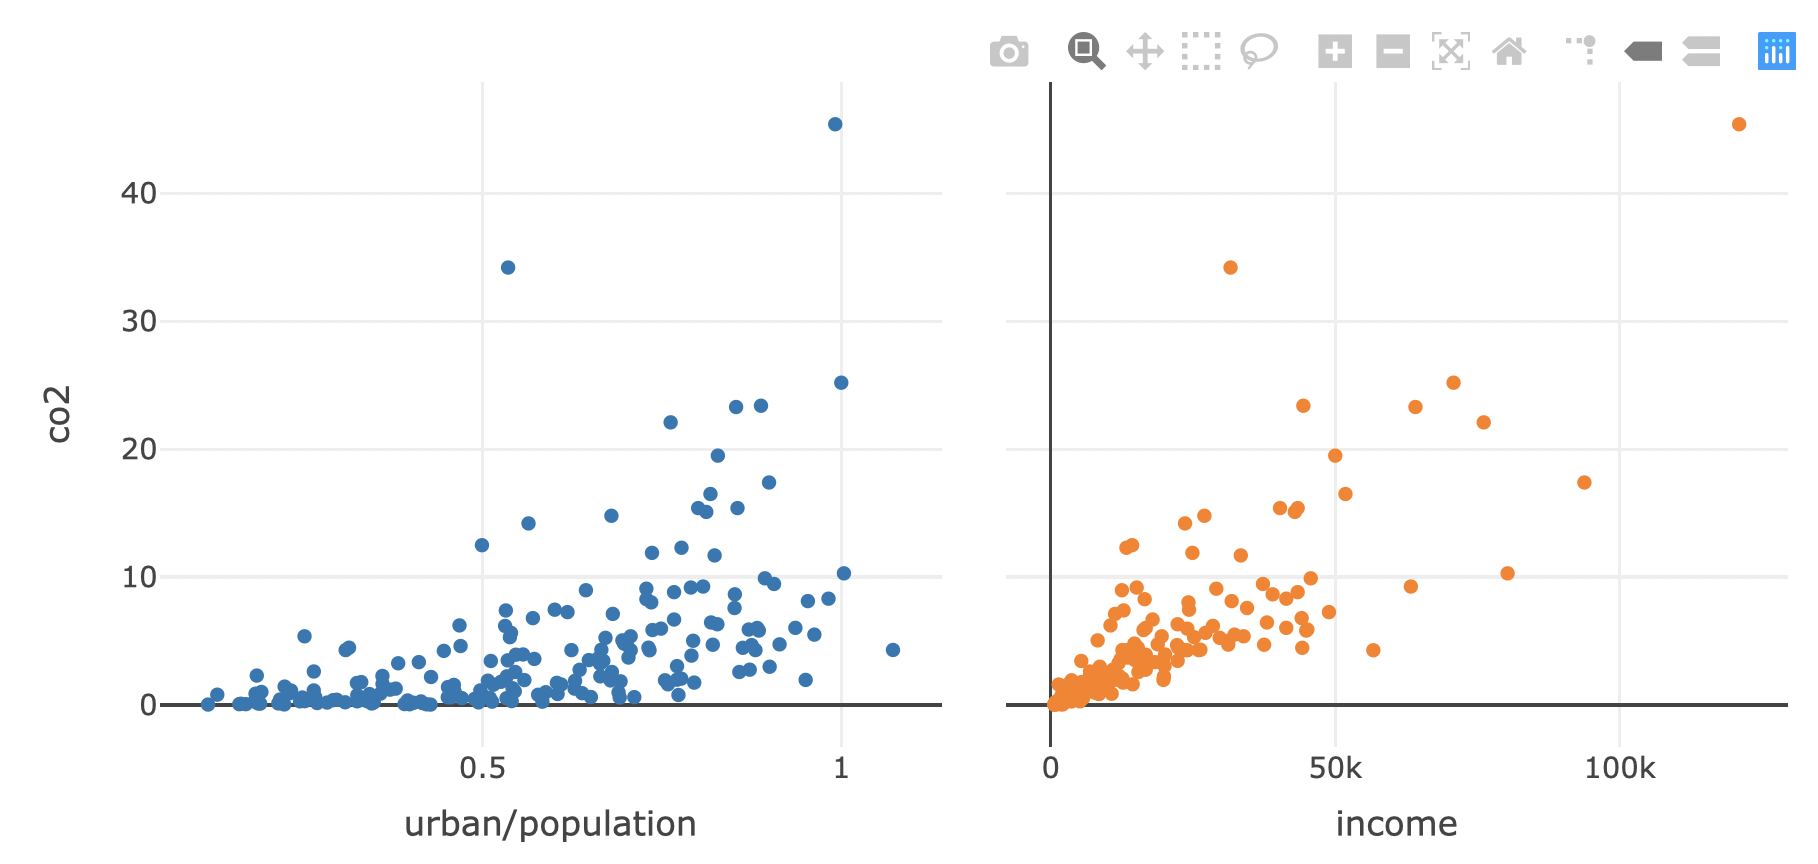
shared_data <- world2014 %>% SharedData$new()
p1 <- shared_data %>%
plot_ly(x=~urban/population, y = ~co2, text = ~country) %>%
add_markers()
p2 <- shared_data %>%
plot_ly(x=~income, y = ~co2, text = ~country) %>%
add_markers()
subplot(p1, p2, titleX = TRUE, shareY = TRUE) %>%
hide_legend()
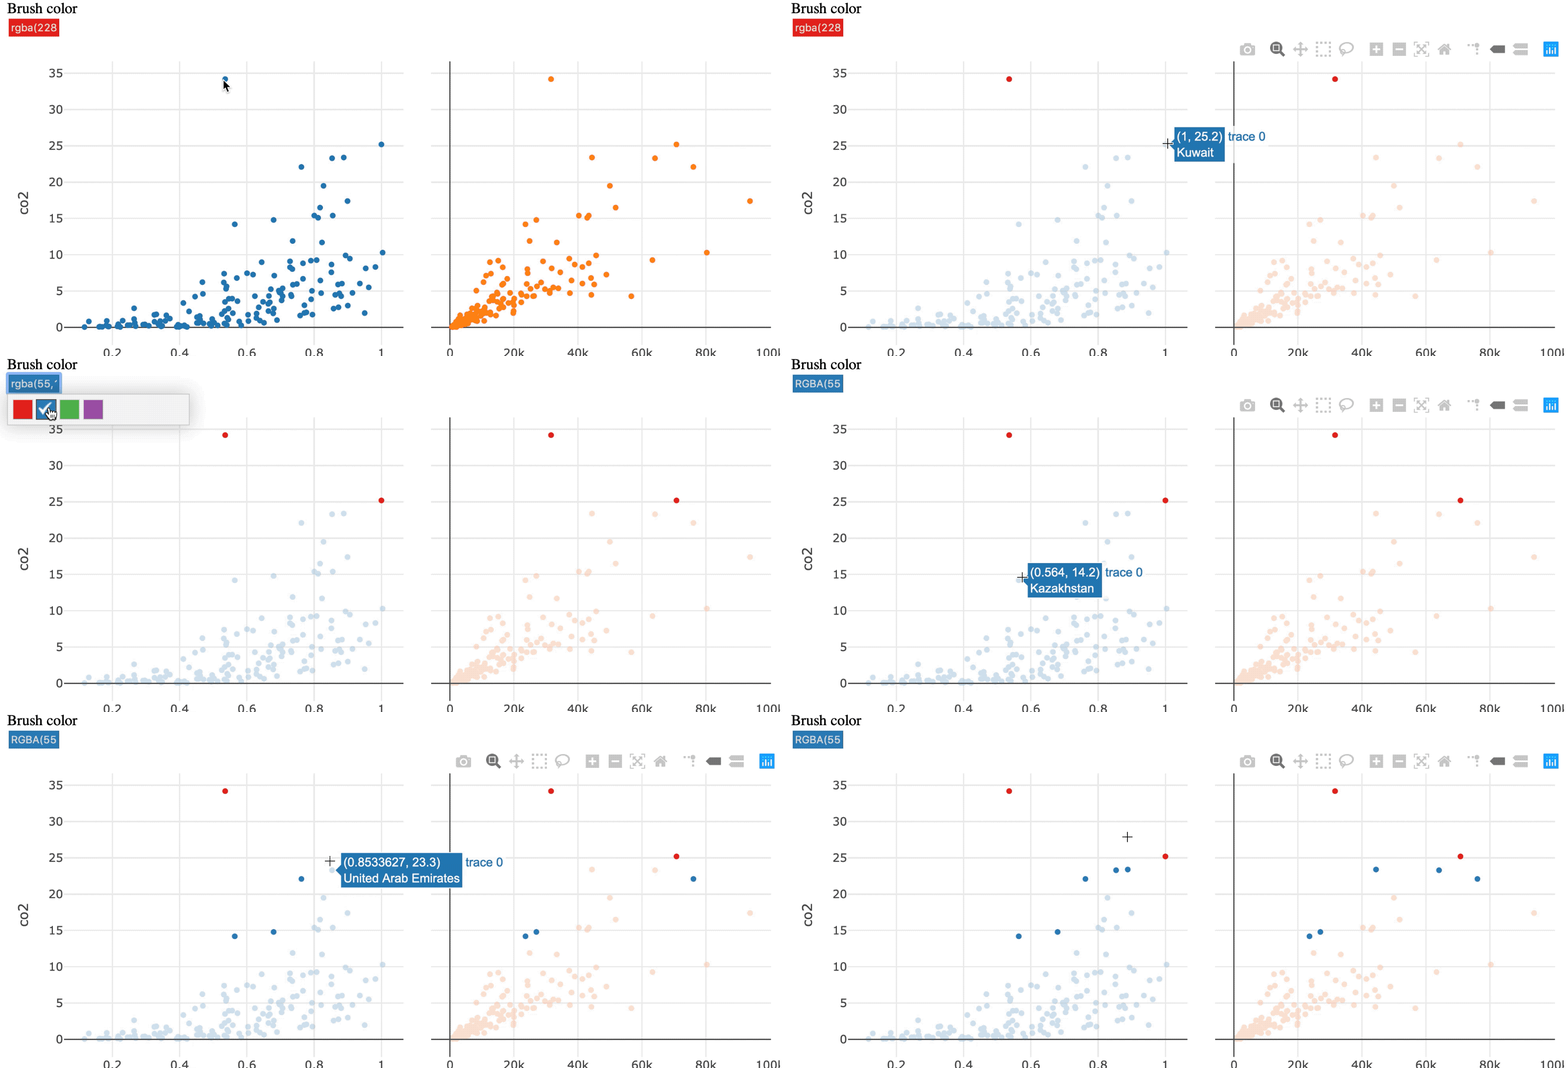
Ative a seleção persistente com highlight()
subplot(p1, p2, titleX = TRUE, shareY = TRUE) %>%
hide_legend() %>%
highlight(persistent = TRUE)
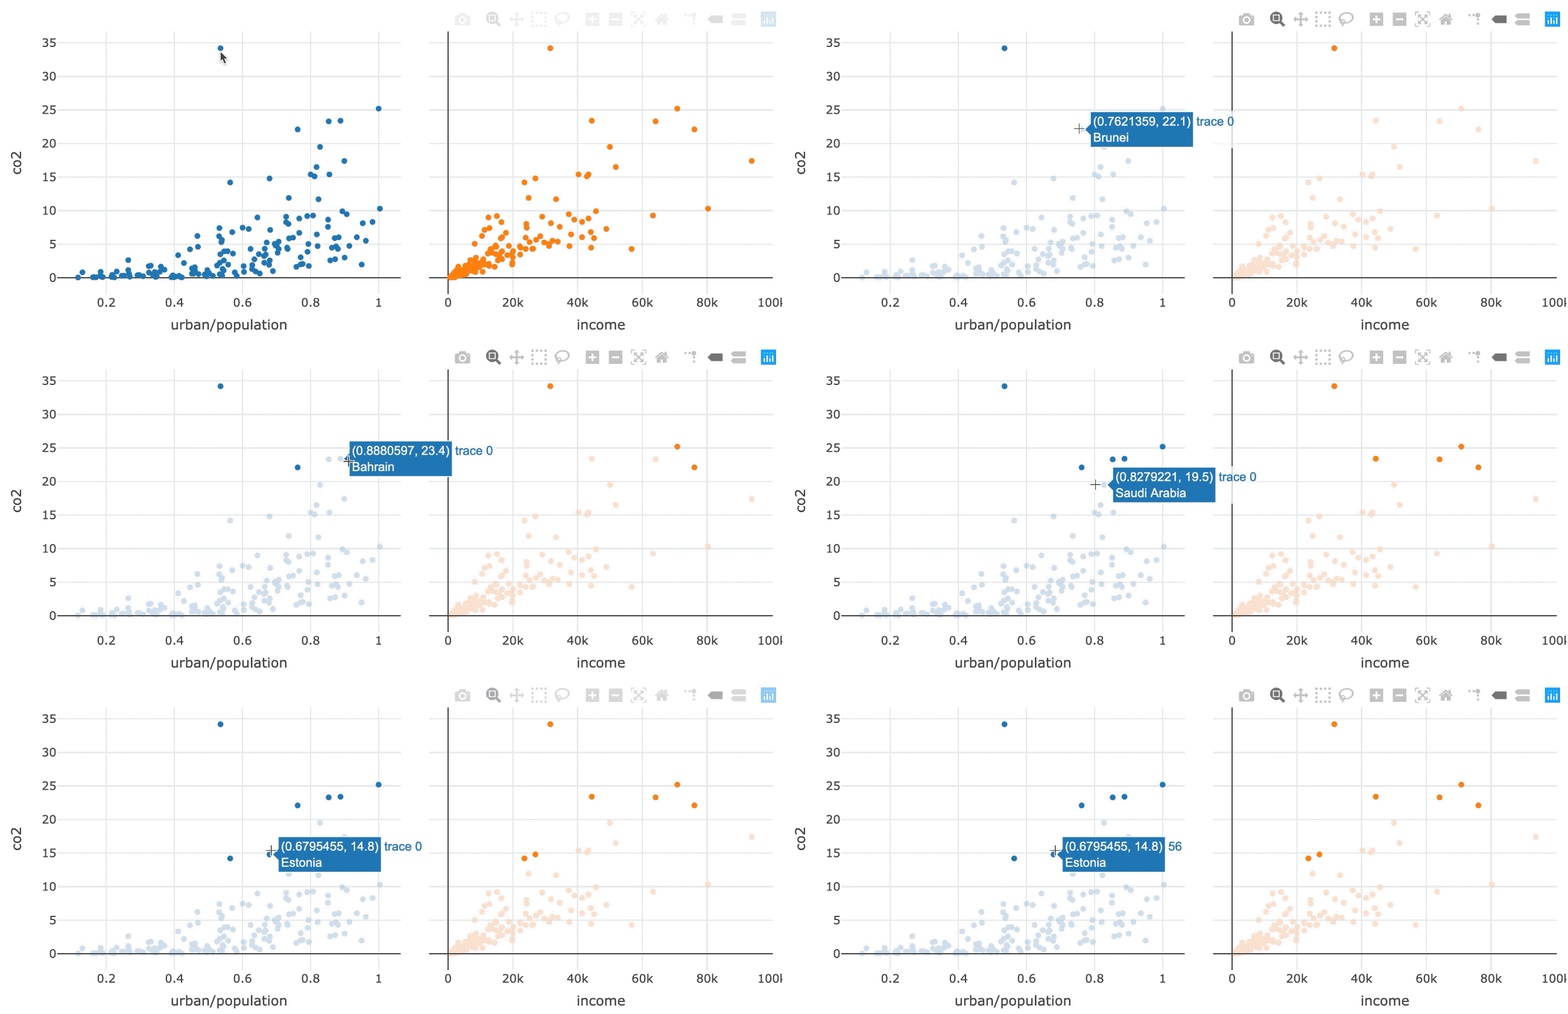

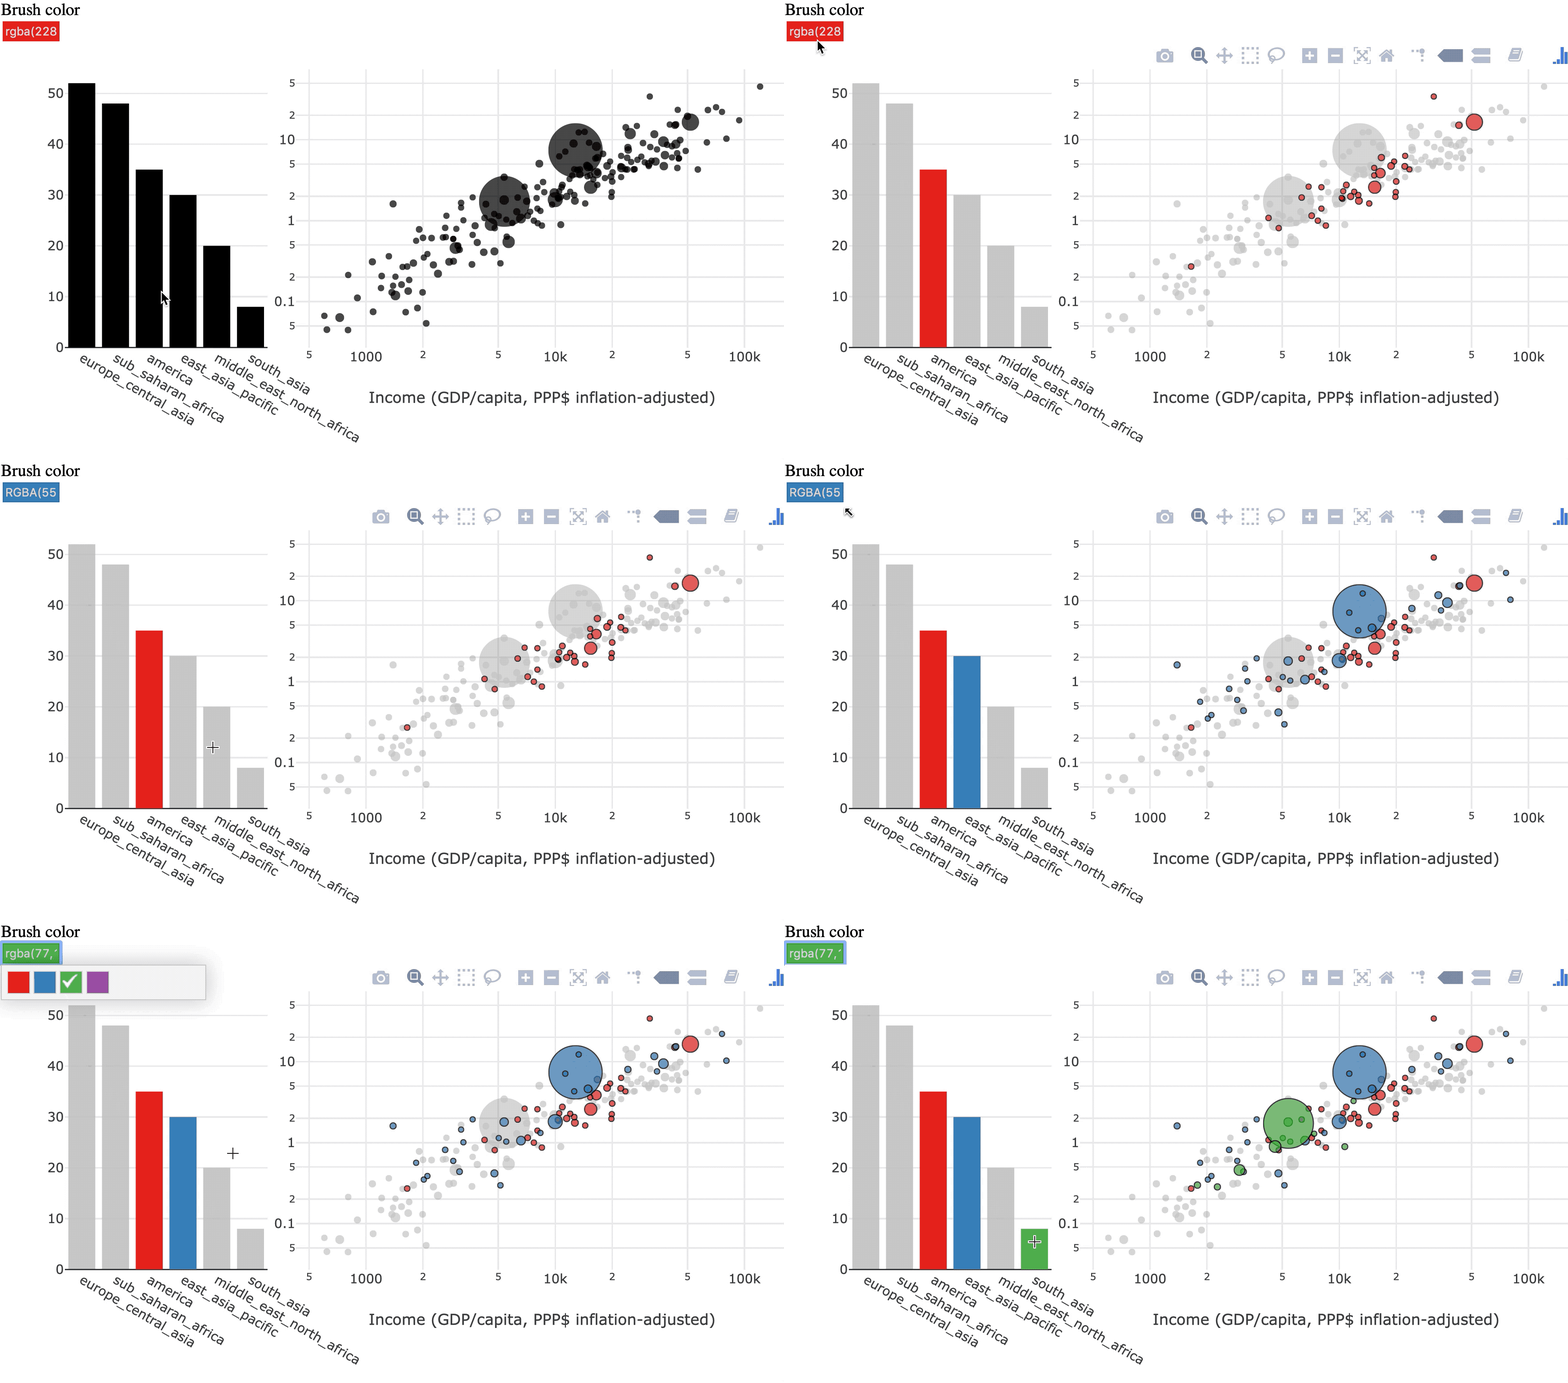
Adicione dynamic = TRUE para ativar um seletor de cores
subplot(p1, p2, titleX = TRUE, shareY = TRUE) %>%
hide_legend() %>%
highlight(persistent = TRUE, dynamic = TRUE)
Manipulação direta
seleção feita interagindo com os elementos gráficos

Manipulação indireta
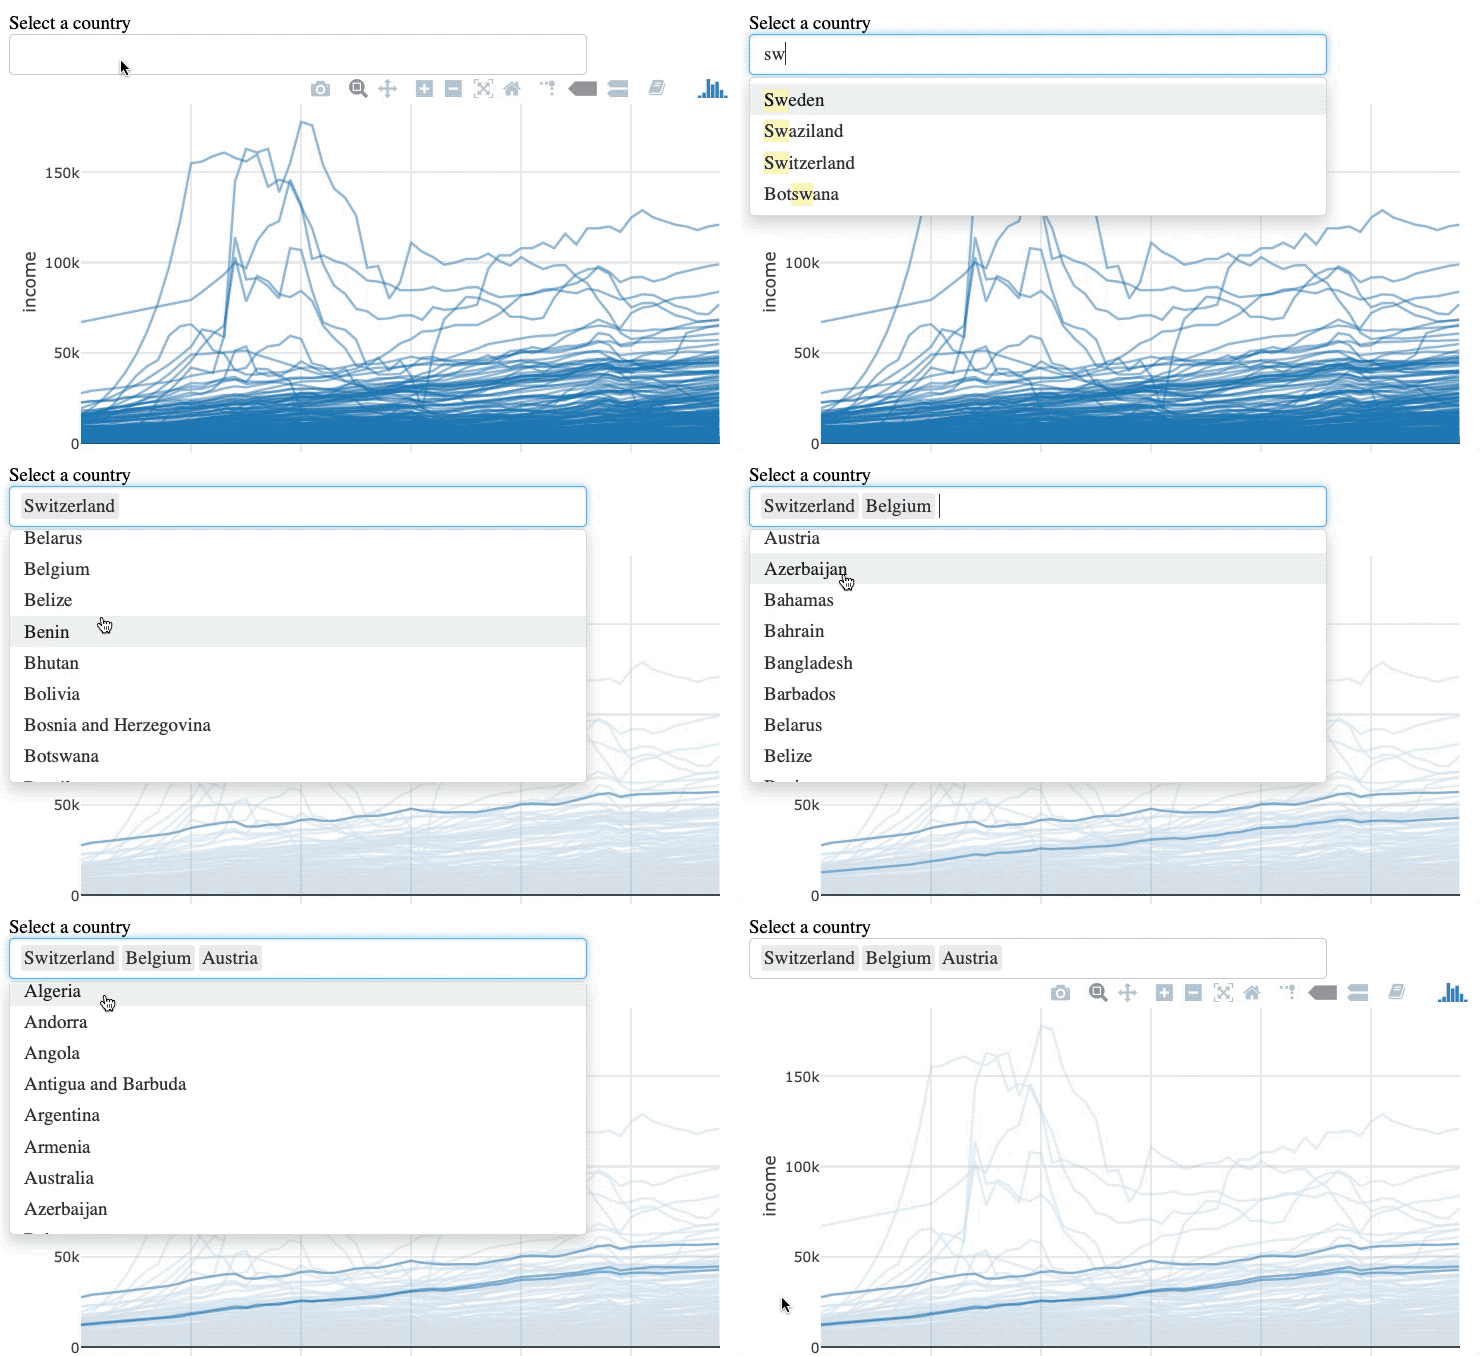
seleção feita via consulta fora do gráfico


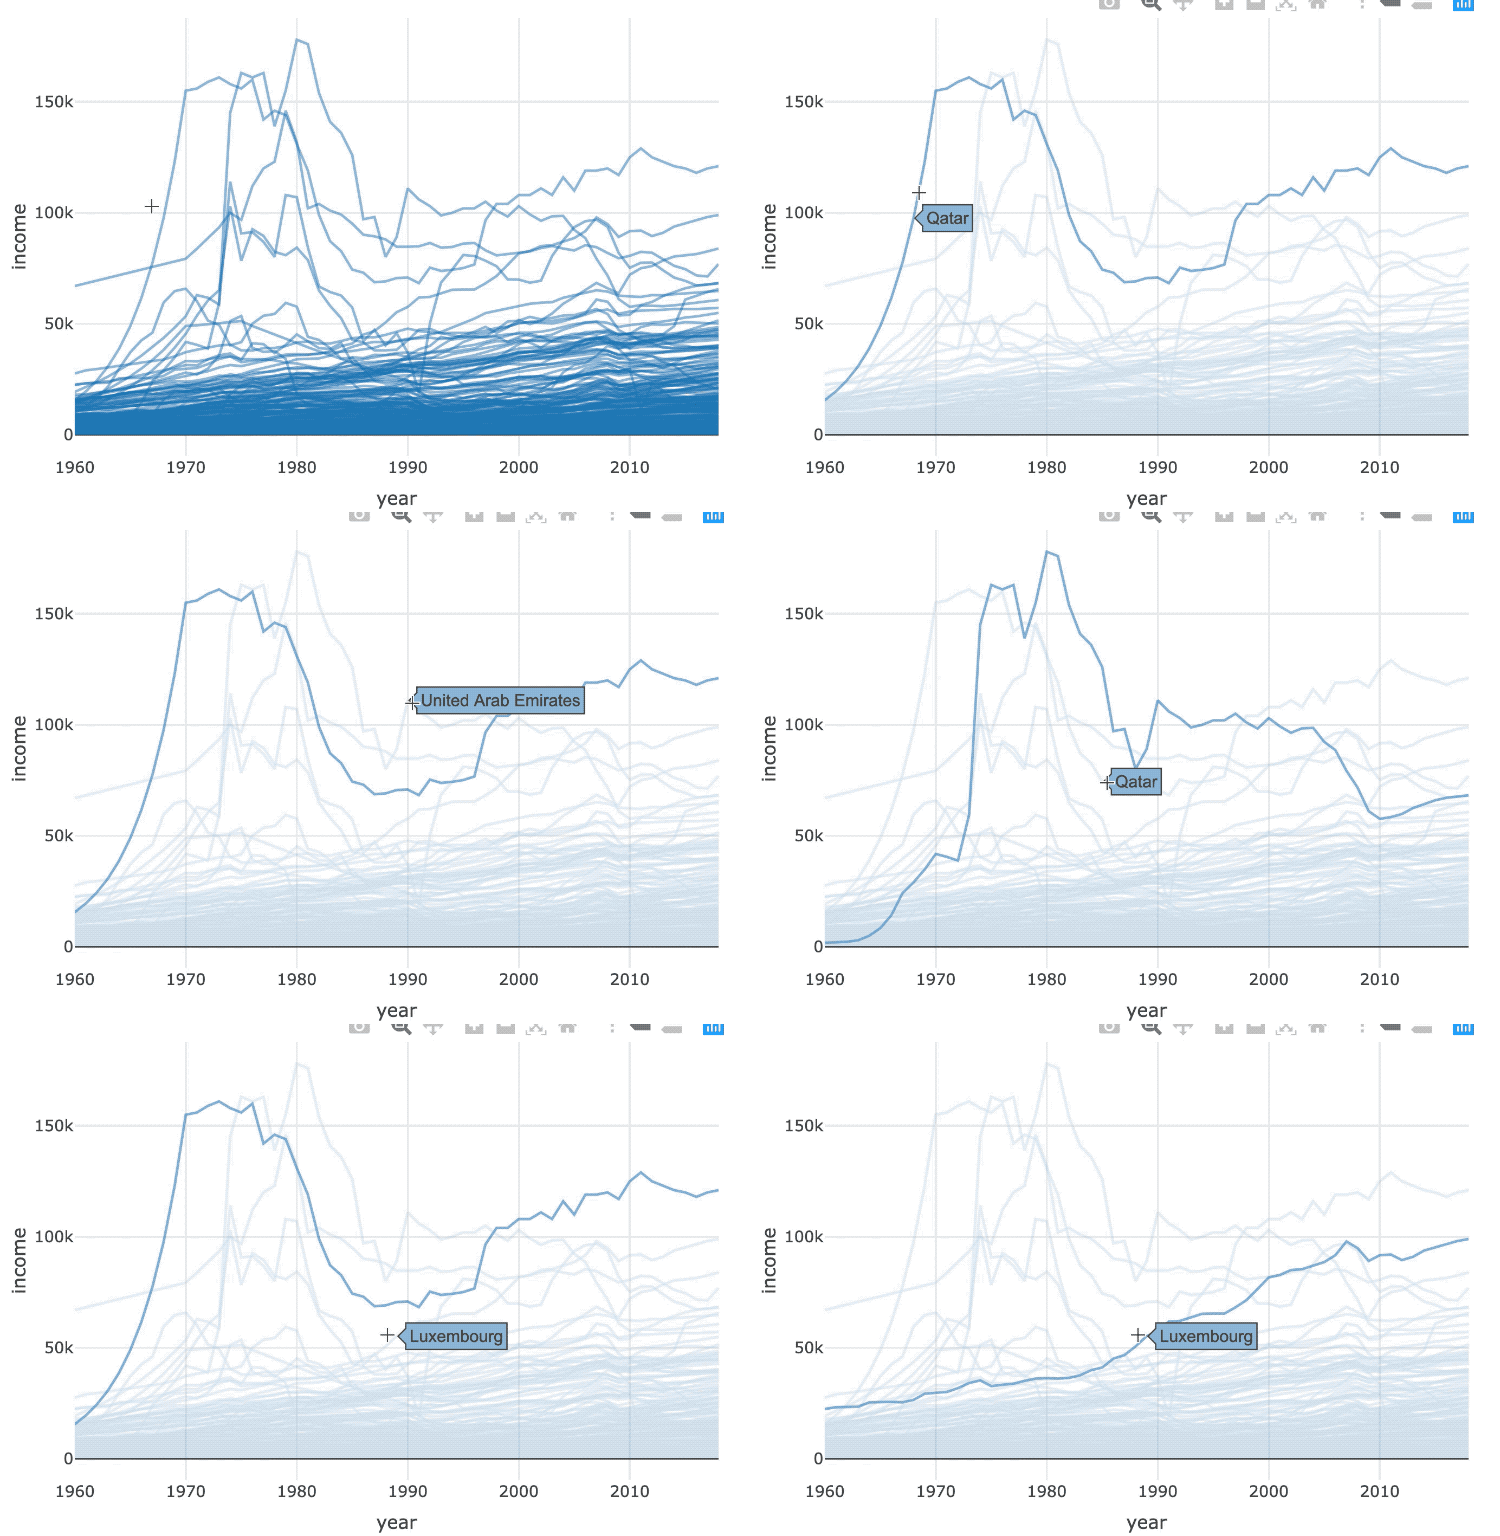
world_indicators %>%
SharedData$new(key = ~country) %>%
plot_ly(x = ~year, y = ~income, alpha = 0.5) %>%
group_by(country) %>%
add_lines()
world_indicators %>%
SharedData$new(key = ~country, group = "Select a country") %>%
plot_ly(x = ~year, y = ~income, alpha = 0.5) %>%
group_by(country) %>%
add_lines() %>%
highlight(selectize = TRUE)

Visualização Interativa de Dados Intermediária com plotly em R