Recapitulando: views conectadas e widgets de seleção

Visualização Interativa de Dados Intermediária com plotly em R

Adam Loy

Statistician, Carleton College

Views conectadas

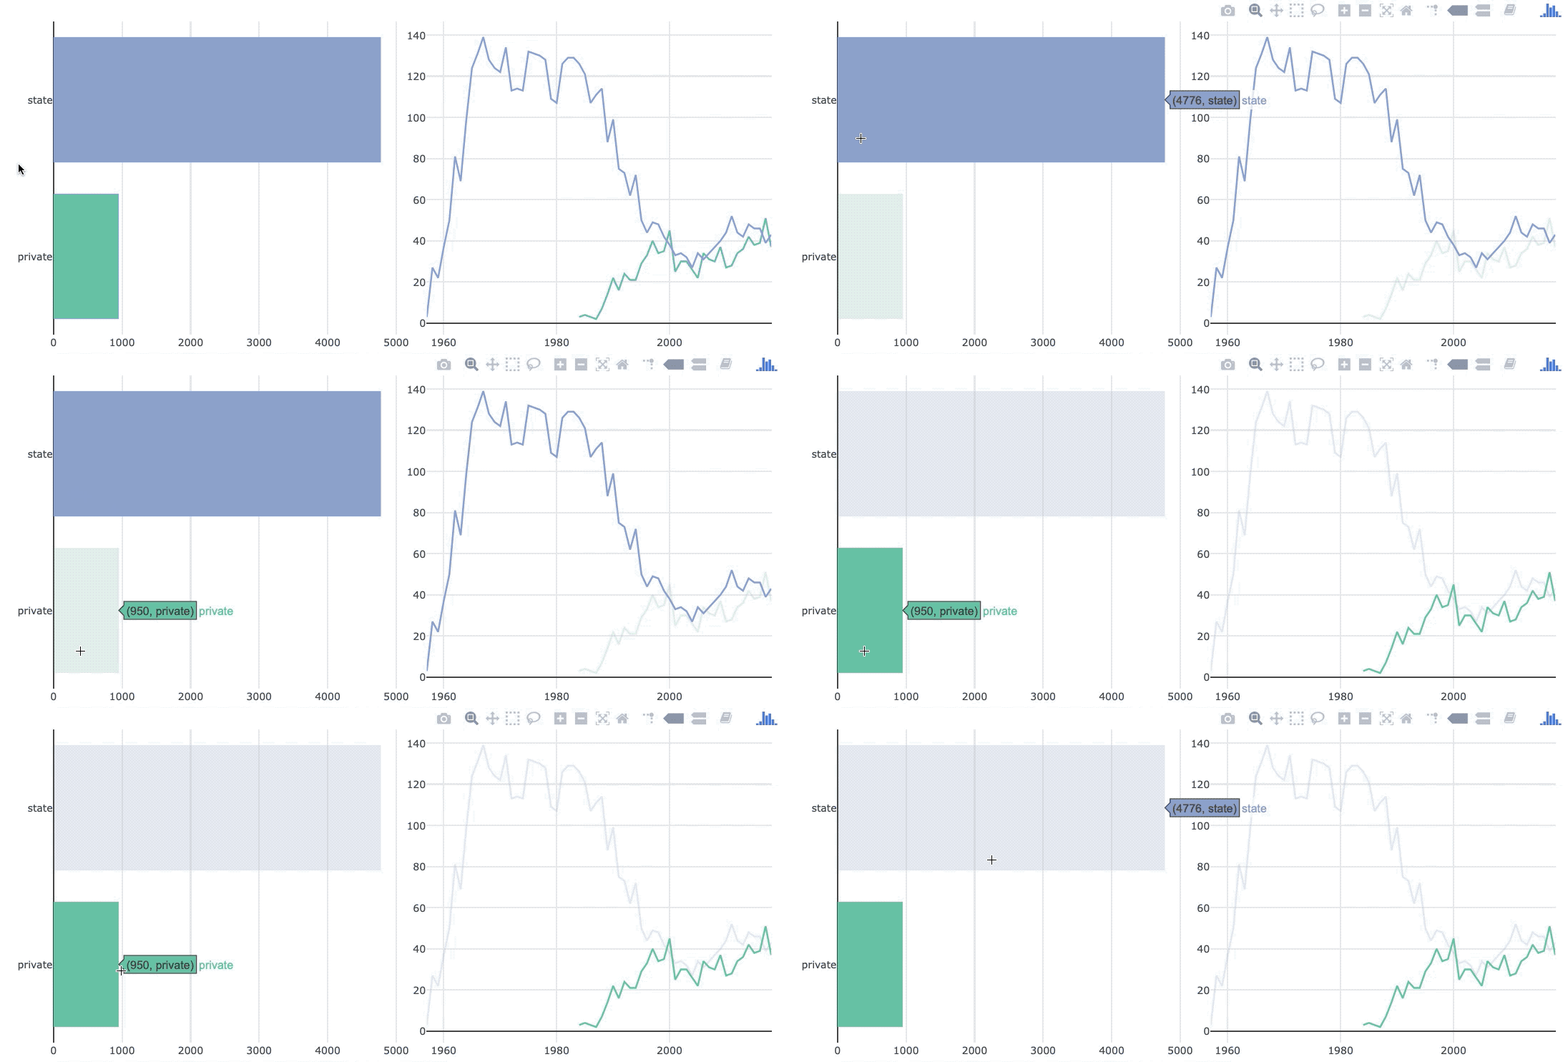
recapitulação de vinculação do cap. 4_3.gif

Visualização Interativa de Dados Intermediária com plotly em R

SharedData

shared_launches <- SharedData$new(launches, key = ~agency_type)

line_chart <- shared_launches %>% plot_ly() %>% group_by(launch_year, agency_type) %>% summarize(n = n()) %>% ungroup(launch_year) %>% add_lines(x = ~launch_year, y = ~n, color = ~agency_type) bar_chart <- shared_launches %>% plot_ly() %>% group_by(agency_type) %>% summarize(n = n()) %>% add_bars(y = ~fct_reorder(agency_type, n), x = ~n, color = ~agency_type) %>% layout(barmode = "overlay", yaxis = list(title = ""))
Visualização Interativa de Dados Intermediária com plotly em R

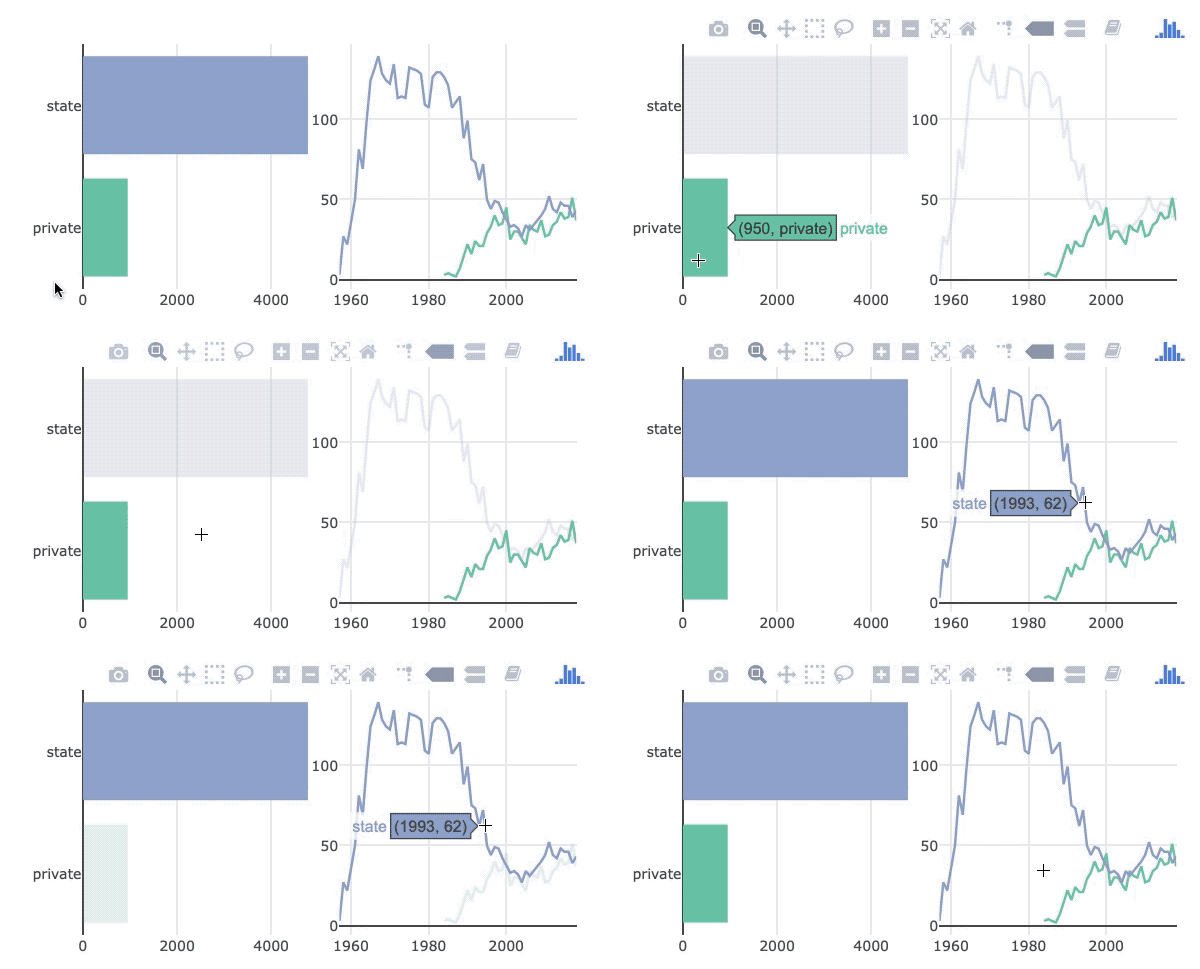
Conectando views com subplot()

subplot(bar_chart, line_chart) %>% 
  hide_legend() %>% 
  highlight()

gráfico de barras por tipo de agência.gif

Visualização Interativa de Dados Intermediária com plotly em R

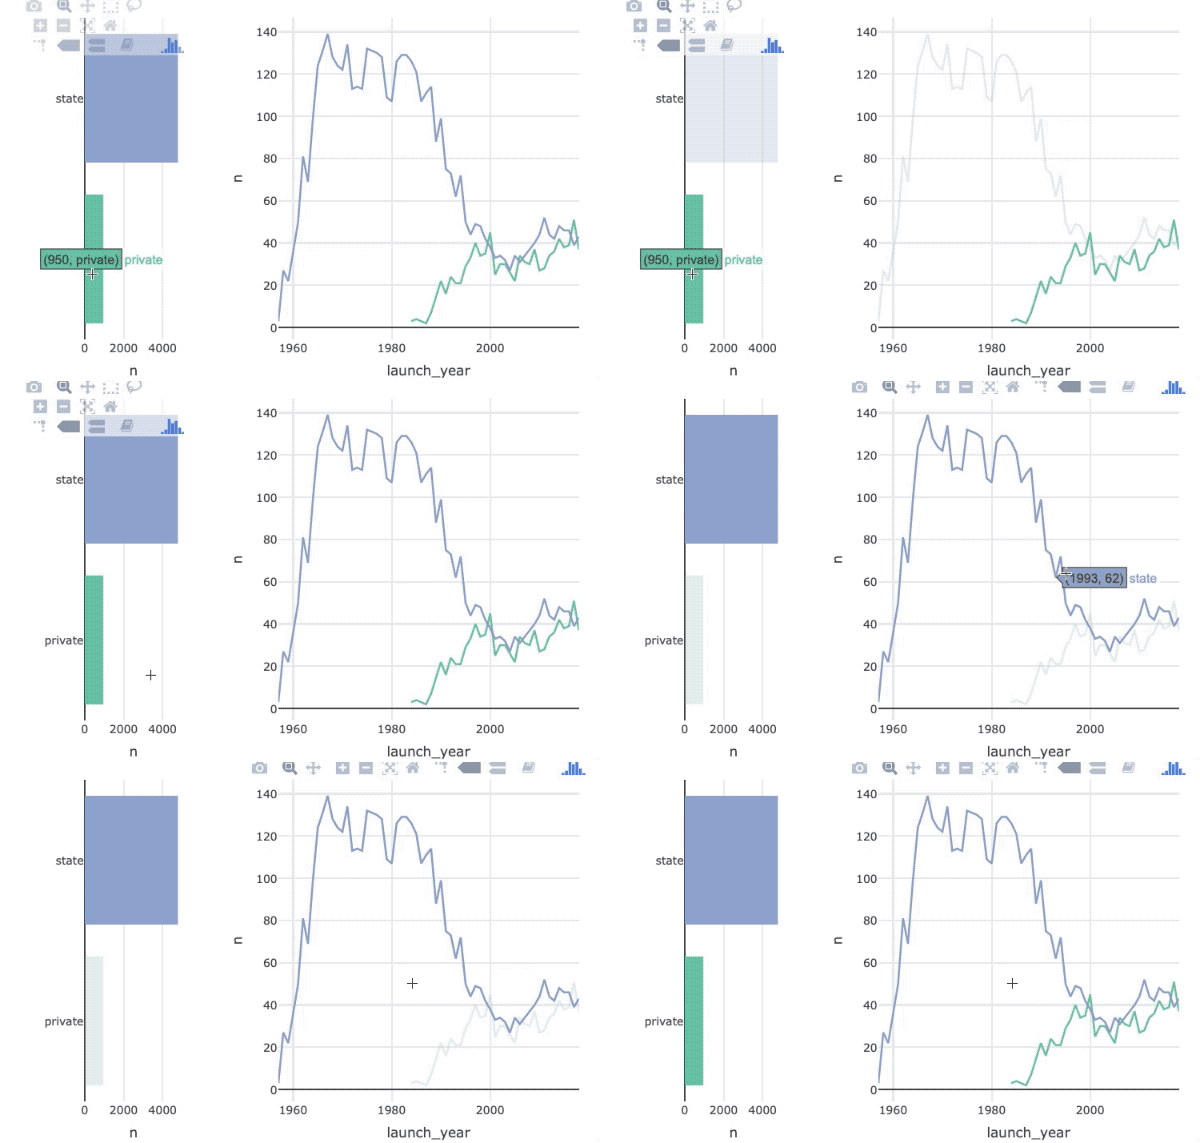
Conectando views com bscols()

bscols(
  widths = c(4, NA),
  bar_chart %>% highlight(),
  line_chart %>% highlight()
)

gráfico de barras por tipo de agência com bscols.gif

Visualização Interativa de Dados Intermediária com plotly em R

Opções de highlight()

Argumento Descrição
on evento de seleção: 'plotly_click', 'plotly_hover' ou 'plotly_selected'
off evento para desligar a seleção: 'plotly_doubleclick', 'plotly_deselect' ou 'plotly_relayout'
persistent Manter seleções persistentes? TRUE ou FALSE
dynamic Adicionar um widget para mudar cores? TRUE ou FALSE
color string de cor(es) para destacar seleções
selectize Adicionar um widget selectize.js para escolher chaves? TRUE ou FALSE
Visualização Interativa de Dados Intermediária com plotly em R

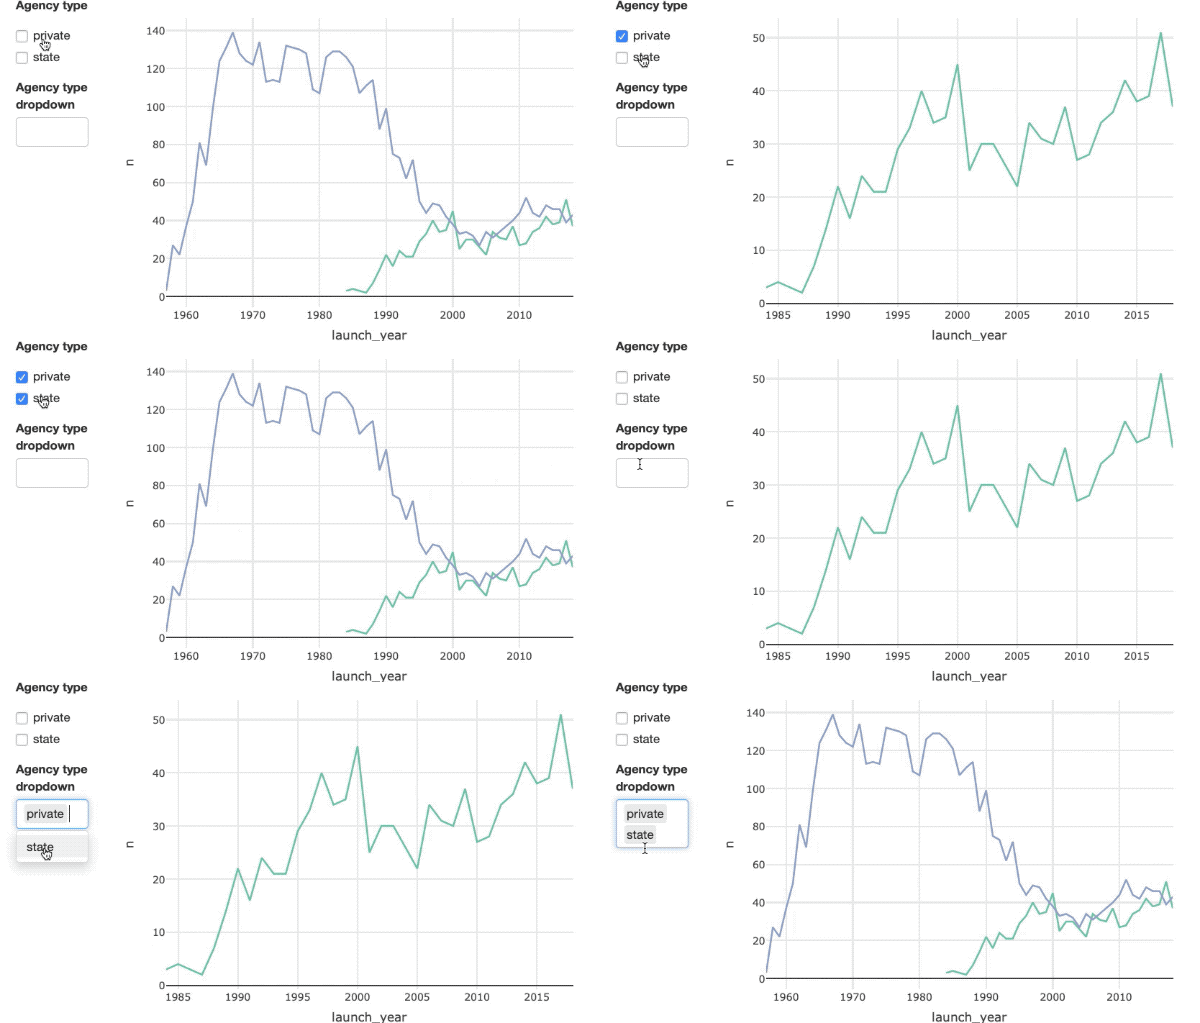
Widgets de seleção

bscols(widths = c(2, NA),
  list(filter_checkbox(id = "agency", label = "Agency type", shared_launches, ~agency_type),
       filter_select(id = "agency2", label = "Agency type dropdown", shared_launches, ~agency_type)),
  line_chart %>% highlight(on = "plotly_selected", off = "plotly_deselect")
)

seletores por tipo de agência.gif

Visualização Interativa de Dados Intermediária com plotly em R

Veículos de lançamento

glimpse(lv)
Rows: 1,578
Columns: 17
$ name         <chr> "?", "Unknown", "N-1 11A52", "Saturn V", "S…
$ family       <chr> "Unknown", "Unknown", "N-1", "SaturnV", "Sa…
$ sfamily      <chr> NA, NA, "OKB1", "MSFC", "MSFC", "SPX", "SPX…
$ manufacturer <chr> NA, NA, NA, NA, "2", NA, NA, NA, NA, NA, NA…
$ variant      <chr> NA, NA, NA, NA, NA, NA, NA, NA, NA, NA, NA,…
$ alias        <dbl> 1, 1, 1, 1, 1, 1, 1, 1, 0, 0, 1, 1, 1, 1, 1…
$ min_stage    <dbl> 1, 1, 3, 4, 3, 1, 2, 3, 1, 1, 2, 3, 6, 3, 6…
$ max_stage    <chr> "0.0  0.00", "0.0  0.00", "105.3 14.00", "1…
$ length       <chr> "0.0", "0.0", "2788.0", "2913.0", "2822.0",…
$ diameter     <dbl> 0, 0, 70000, 118000, 75000, 0, 150000, 2440…
$ launch_mass  <lgl> NA, NA, NA, NA, NA, NA, NA, NA, NA, NA, NA,…
$ leo_capacity <dbl> 0, 0, 0, 0, 0, 0, 0, 0, 0, 0, 0, 0, 4350, 0…
$ gto_capacity <lgl> NA, NA, NA, NA, NA, NA, NA, NA, NA, NA, NA,…
$ to_thrust    <dbl> 0, 0, 45300, 34030, 34030, 12000, 72500, 28…
$ class        <chr> "R", "R", "O", "O", "O", "R", "O", "O", "O"…
$ apogee       <dbl> 0, 0, 200, 400000, 500, 20, 200, 600, 250, …
$ range        <dbl> NA, NA, NA, NA, NA, NA, NA, NA, NA, NA, NA,…
Visualização Interativa de Dados Intermediária com plotly em R

Vamos praticar!

Visualização Interativa de Dados Intermediária com plotly em R

Preparing Video For Download...