Um ótimo toque no ggplot

Programando com dplyr

Dr. Chester Ismay

Educator, Data Scientist, and R/Python Consultant

Noções básicas de ggplot2
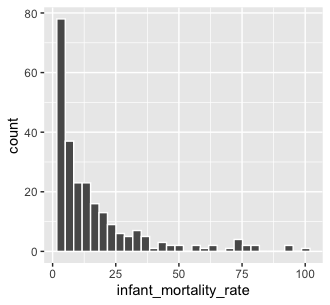
library(ggplot2)
ggplot(
    world_bank_data, 
    aes(x = infant_mortality_rate)
) +

geom_histogram(color = "white")

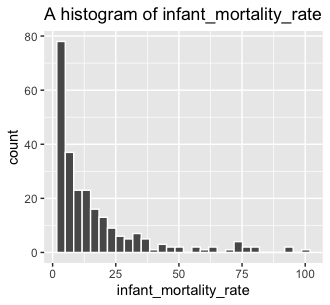
Histograma de infant_mortality_rate

Programando com dplyr

Adicionando um título

ggplot(
    world_bank_data, 
    aes(x = infant_mortality_rate)
) + 
  geom_histogram(color = "white") +

ggtitle("A histogram of infant_mortality_rate")

ggplot2 com título

Programando com dplyr

Transformando em função

# Previous plot code
ggplot(world_bank_data, aes(x = infant_mortality_rate)) + 
  geom_histogram(color = "white") +
  ggtitle("A histogram of infant_mortality_rate")
# Define a function
my_histogram <- function(

df, x_var) {
ggplot(df, aes(x = x_var)) + geom_histogram(color = "white") + ggtitle(paste("A histogram of", x_var)) }
Programando com dplyr

Ajustando nossa função

# First attempt at a function
my_histogram <- function(df, x_var) {
  ggplot(df, aes(x = x_var)) +
    geom_histogram(color = "white") +
    ggtitle(paste("A histogram of", x_var))
}

# Call the function my_histogram(df = world_bank_data, x_var = infant_mortality_rate)
 Error in paste("A histogram of", x_var) : 
  object 'infant_mortality_rate' not found
Programando com dplyr

Incluindo rlang

# First attempt at a function
my_histogram <- function(df, x_var) {
  ggplot(df, aes(x = x_var)) +
    geom_histogram(color = "white") +
    ggtitle(paste("A histogram of", x_var))
}
# Making needed tweaks to stop error
my_histogram <- function(df, x_var) {
  ggplot(df, aes(x = {{ x_var }})) +

geom_histogram(color = "white") + ggtitle(paste("A histogram of",
as_label(enquo(x_var))) }
Programando com dplyr

Usando nossa função

# Defined function with rlang operators
my_histogram <- function(df, x_var) {
  ggplot(df, aes(x = {{ x_var }})) +
    geom_histogram(color = "white") +
    ggtitle(paste(
      "A histogram of", 
      as_label(enquo(x_var))
    ))
}

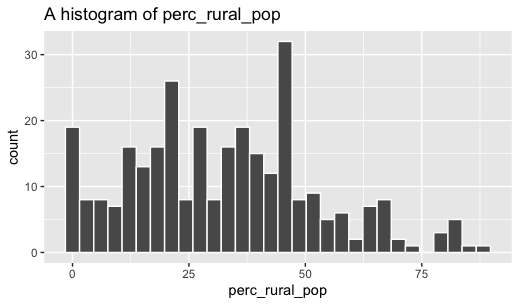
# Call the function with the pipe! world_bank_data %>% my_histogram(x_var = perc_rural_pop)

ggplot2 com histograma via rlang

Programando com dplyr

Vamos praticar!

Programando com dplyr

Preparing Video For Download...