Modelos de Mistura em R
Victor Medina
Researcher at The University of Edinburgh

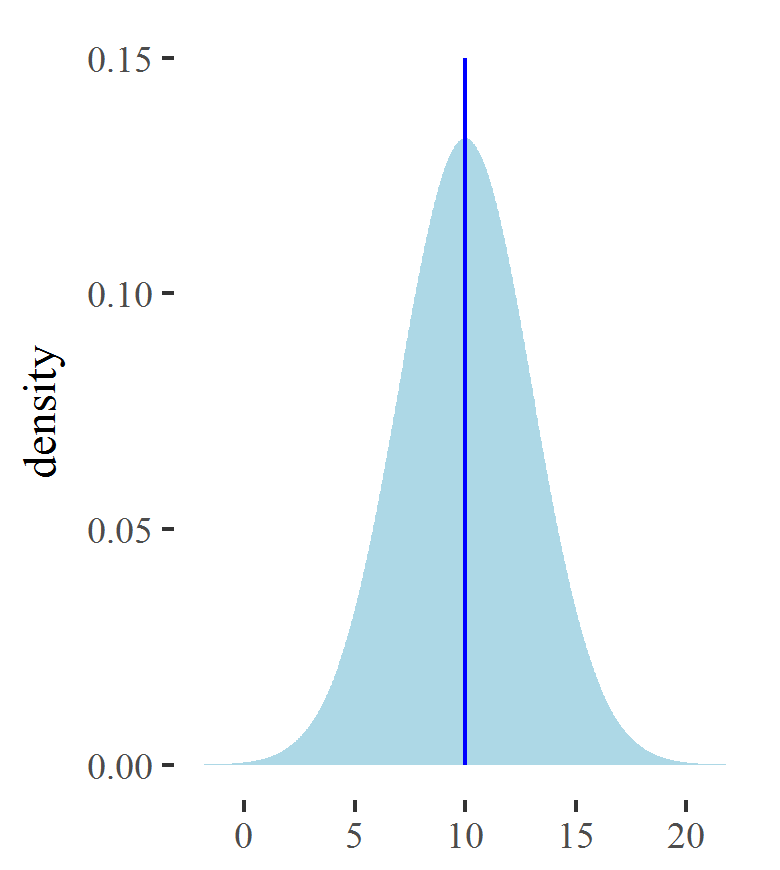
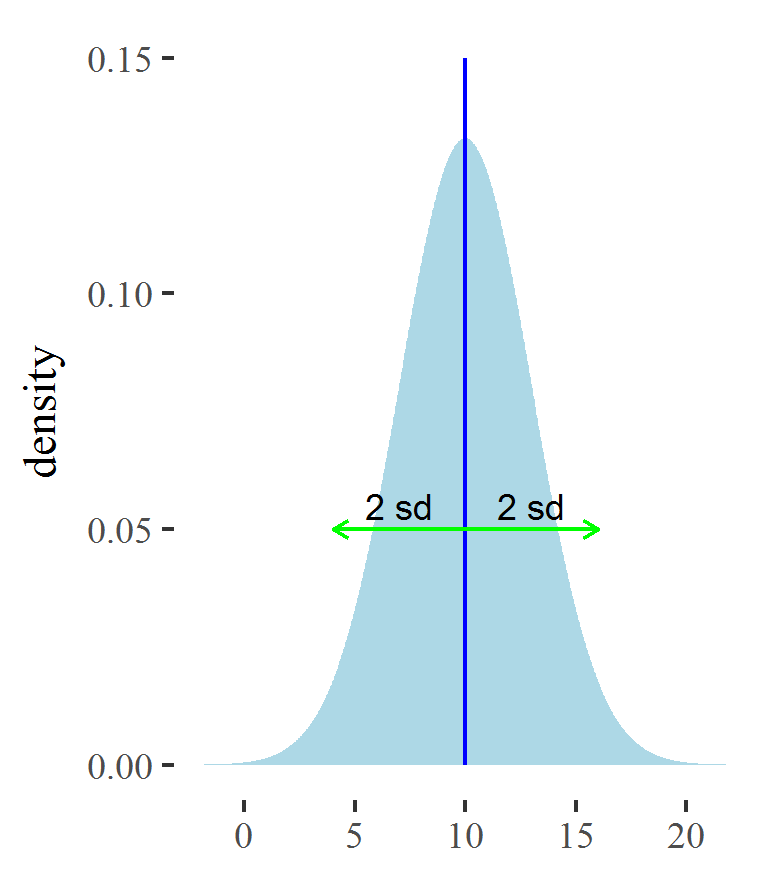
mixtoolsbayesmixEMClusterflexmixMédia

Desvio padrão

Para gerar amostras de uma distribuição Gaussiana:
rnorm(n, mean, sd)Exemplo: gere 100 valores de uma Gaussiana com média 10 e desvio padrão 5
> population_sample <- rnorm(n = 100, mean = 10, sd = 5)
> head(population_sample)
[1] 6.248874 9.564190 16.006521 9.139647 10.114969 16.423538
> mean_estimate <- mean(population_sample)
10.35759
Para estimar o sd, faça o seguinte procedimento
$$value_i\rightarrow (. -mean\_estimate)\rightarrow (.)^2\rightarrow mean (.)\rightarrow \sqrt{(.)}$$
> population_sample %>%
+ subtract(mean_estimate) %>%
+ raise_to_power(2) %>% mean() %>% sqrt()
5.318641
sd> standard_deviation_estimate <- sd(population_sample)
> standard_deviation_estimate
5.345435
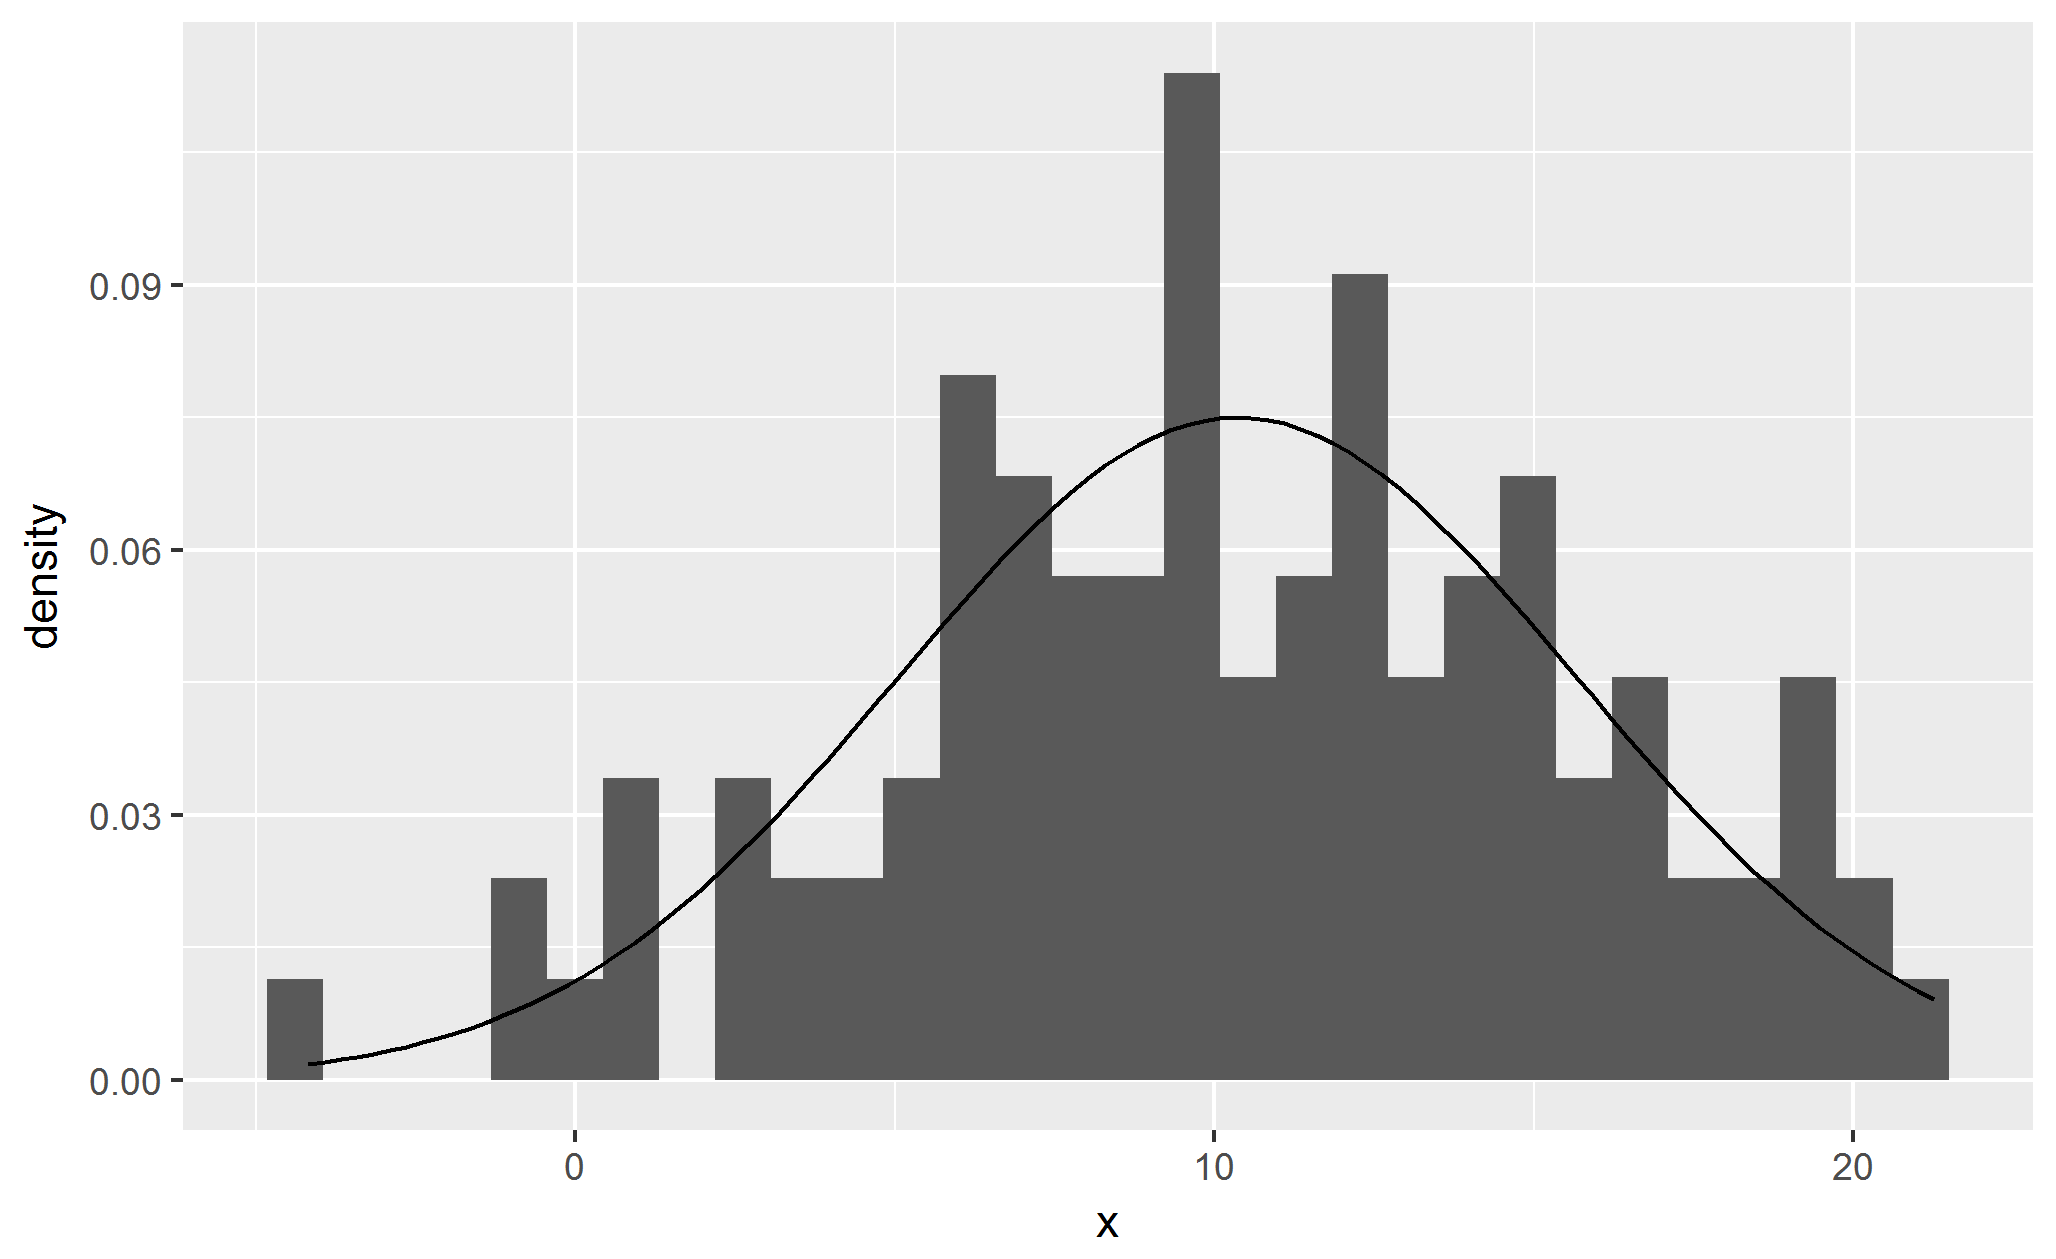
# Transformar a amostra em um data frame
population_sample <- data.frame(x = population_sample)
# Plotar o histograma
ggplot(data = population_sample) +
geom_histogram(aes(x = x, y = ..density..)) +
stat_function(geom = "line",
fun = dnorm,
args = list(mean = mean_estimate,
sd = standard_deviation_estimate))

Modelos de Mistura em R