Isolation forest

Introduction to Anomaly Detection in R

Alastair Rushworth

Data Scientist

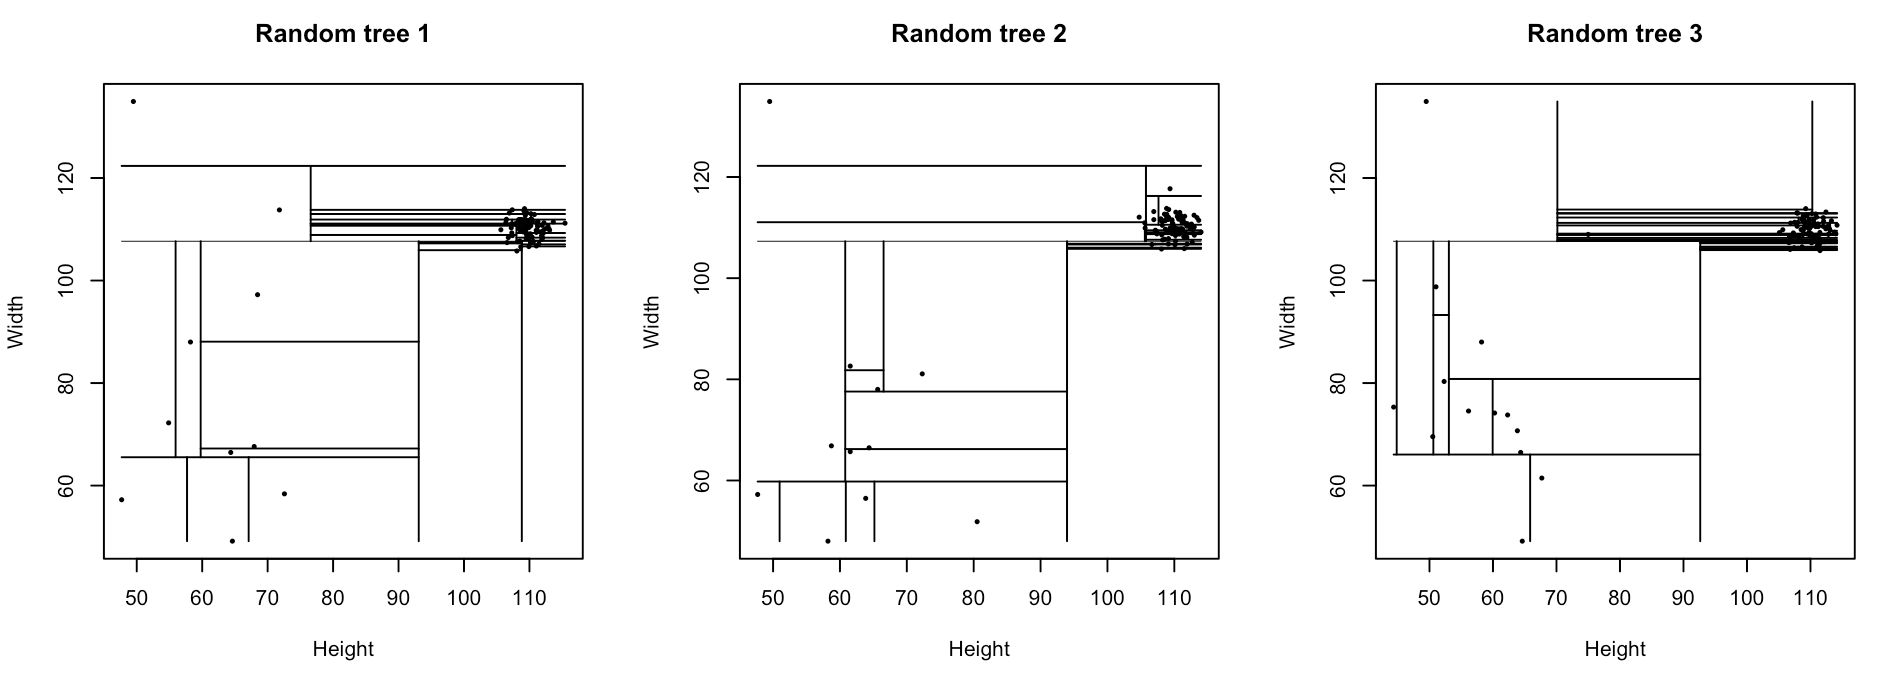
Amostragem para construir árvores

furniture_tree <- iForest(data = furniture, nt = 1, phi = 100)
Introduction to Anomaly Detection in R

Uma floresta com muitas árvores

furniture_forest <- iForest(data = furniture, nt = 100)


Floresta versus árvore única

  • Média dos escores é robusta
  • Crescimento rápido
Introduction to Anomaly Detection in R

Quantas árvores?

head(furniture_scores)
   trees_10  trees_50 trees_100 trees_200 trees_500 trees_1000
1 0.5699958 0.5888690 0.5966556 0.5911285 0.6006028  0.6022553
2 0.5930155 0.6094254 0.6102873 0.6067693 0.6103950  0.6138331
3 0.5491612 0.5530659 0.5509151 0.5478388 0.5543705  0.5541810
4 0.5919385 0.5934920 0.6036891 0.5986545 0.6042257  0.6038739
5 0.5755555 0.5545840 0.5562077 0.5502717 0.5529810  0.5533804
6 0.6099932 0.6156158 0.6246391 0.6237609 0.6262847  0.6293865
Introduction to Anomaly Detection in R

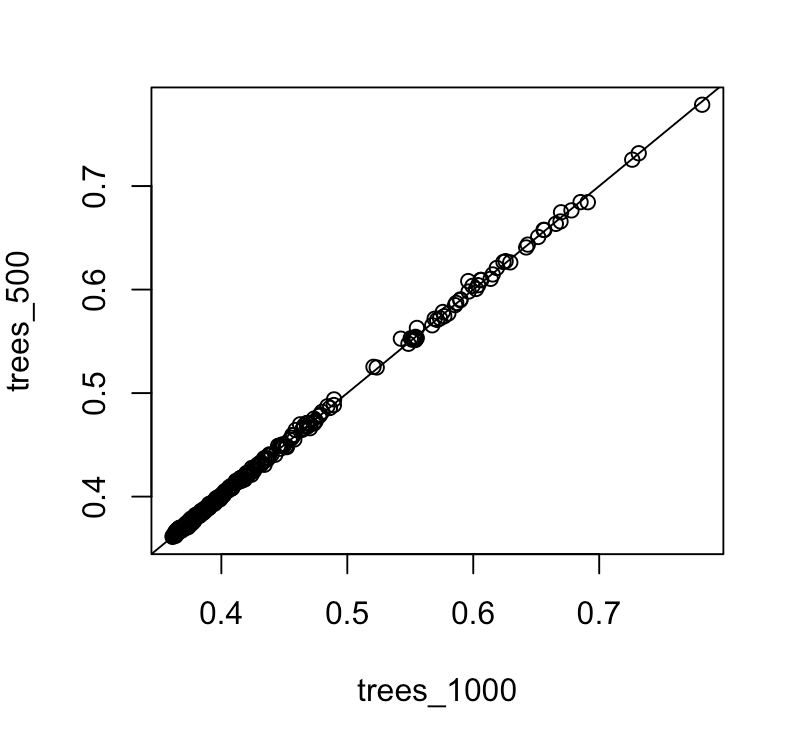
Convergência do escore

plot(trees_500 ~ trees_1000, data = furniture_scores)
abline(a = 0, b = 1)
Introduction to Anomaly Detection in R

Vamos praticar!

Introduction to Anomaly Detection in R

Preparing Video For Download...