Corrélation de l’indice et export vers Excel
Manipuler des séries temporelles en Python

Stefan Jansen
Founder & Lead Data Scientist at Applied Artificial Intelligence
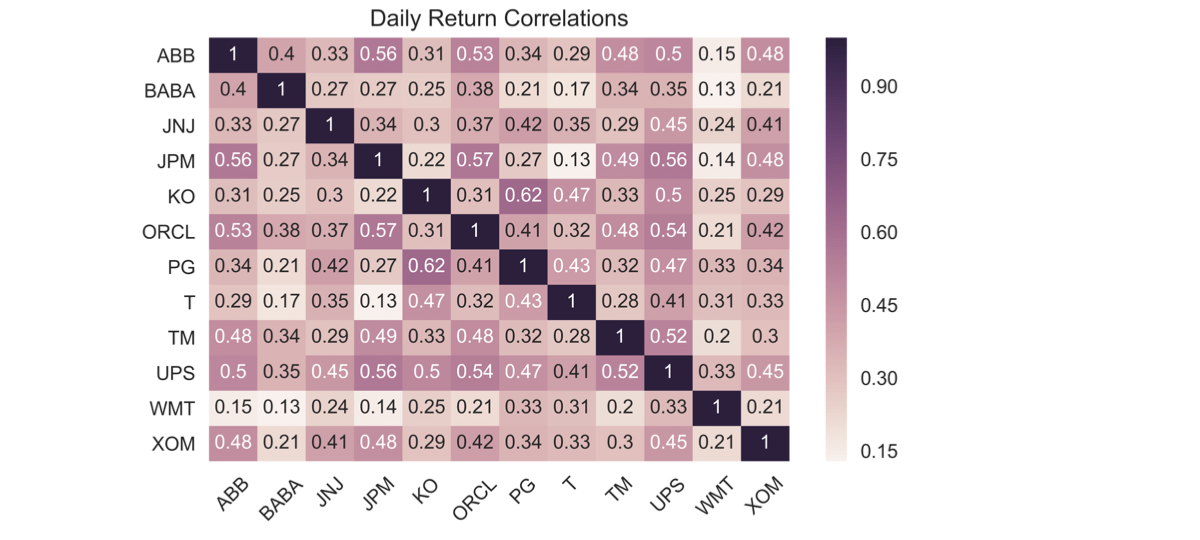
Composants de l’indice : corrélations des rendements
sns.heatmap(correlations, annot=True)
plt.xticks(rotation=45)
plt.title('Daily Return Correlations')
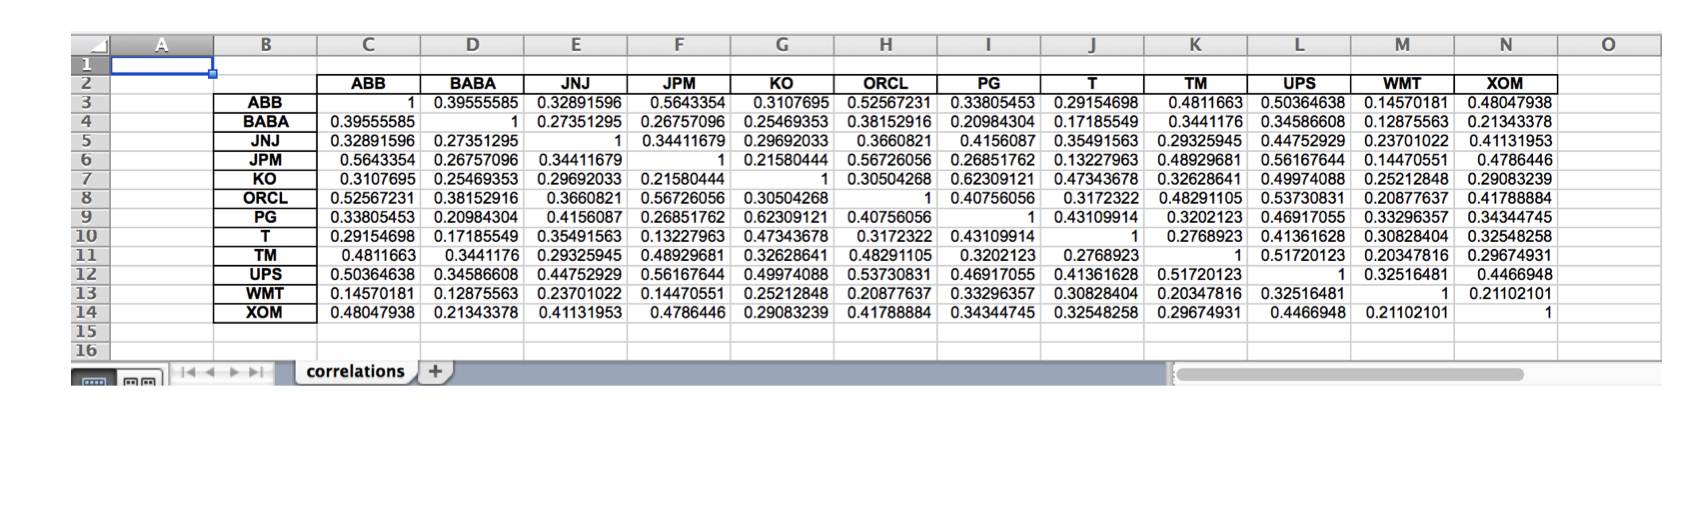
Enregistrer dans une seule feuille Excel
correlations.to_excel(excel_writer= 'correlations.xls',
                      sheet_name='correlations',
                      startrow=1,
                      startcol=1)
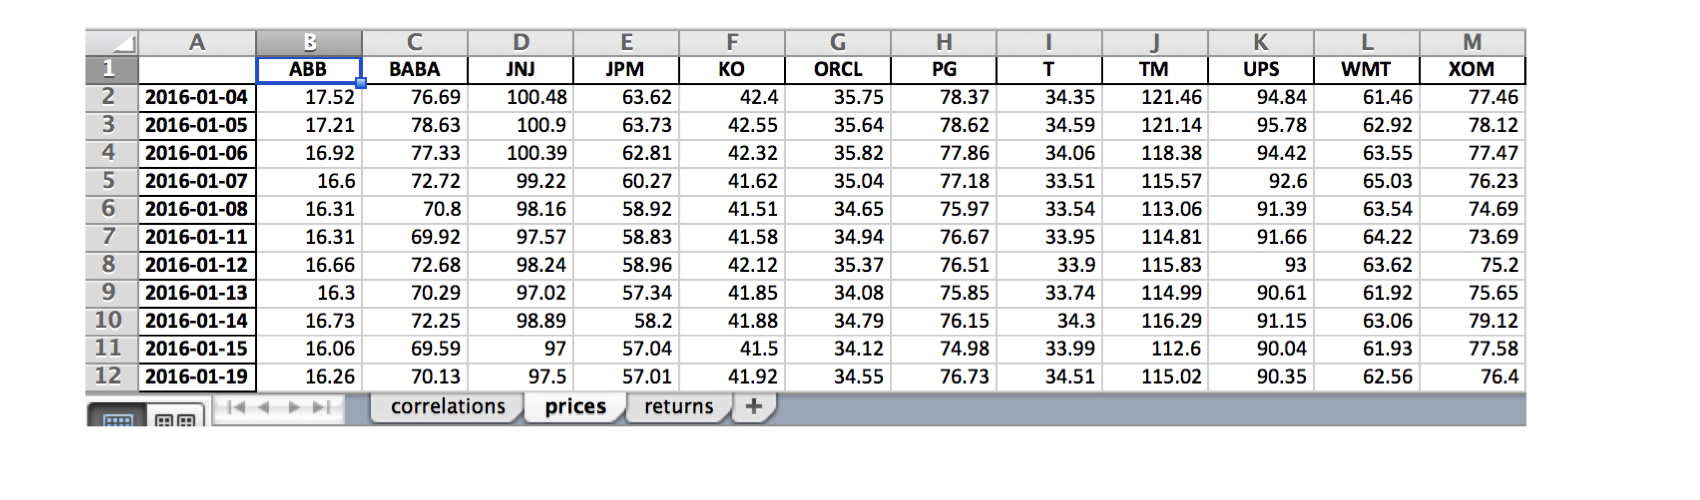
Enregistrer dans plusieurs feuilles Excel
data.index = data.index.date # Ne garder que la datewith pd.ExcelWriter('stock_data.xlsx') as writer:corr.to_excel(excel_writer=writer, sheet_name='correlations')data.to_excel(excel_writer=writer, sheet_name='prices')data.pct_change().to_excel(writer, sheet_name='returns')