Ratios de Sharpe ; variables explicatives et cibles
Machine Learning pour la finance en Python
Nathan George
Data Science Professor
Calculer nos ratios de Sharpe
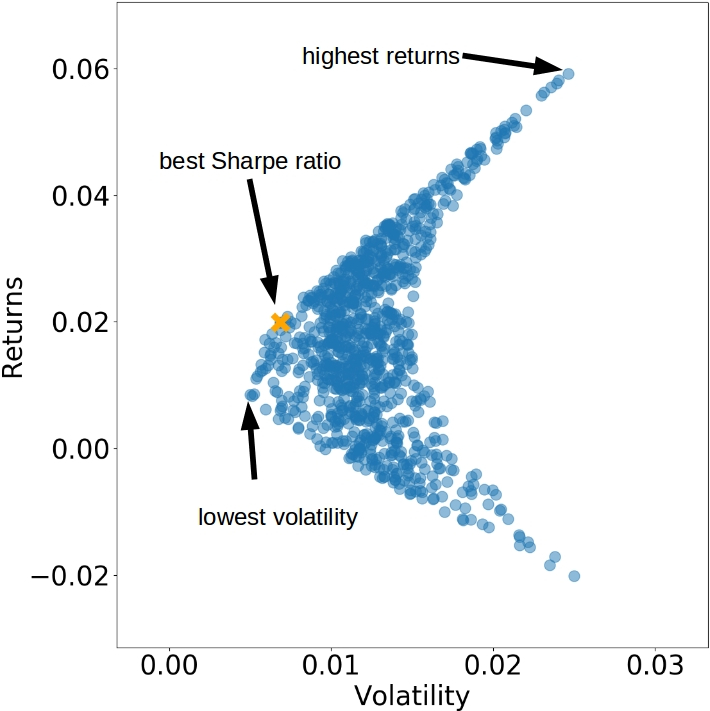
# empty dictionaries for sharpe ratios and best sharpe indexes by date
sharpe_ratio, max_sharpe_idxs = {}, {}

# loop through dates and get sharpe ratio for each portfolio
for date in portfolio_returns.keys():
    for i, ret in enumerate(portfolio_returns[date]):
        volatility = portfolio_volatility[date][i]
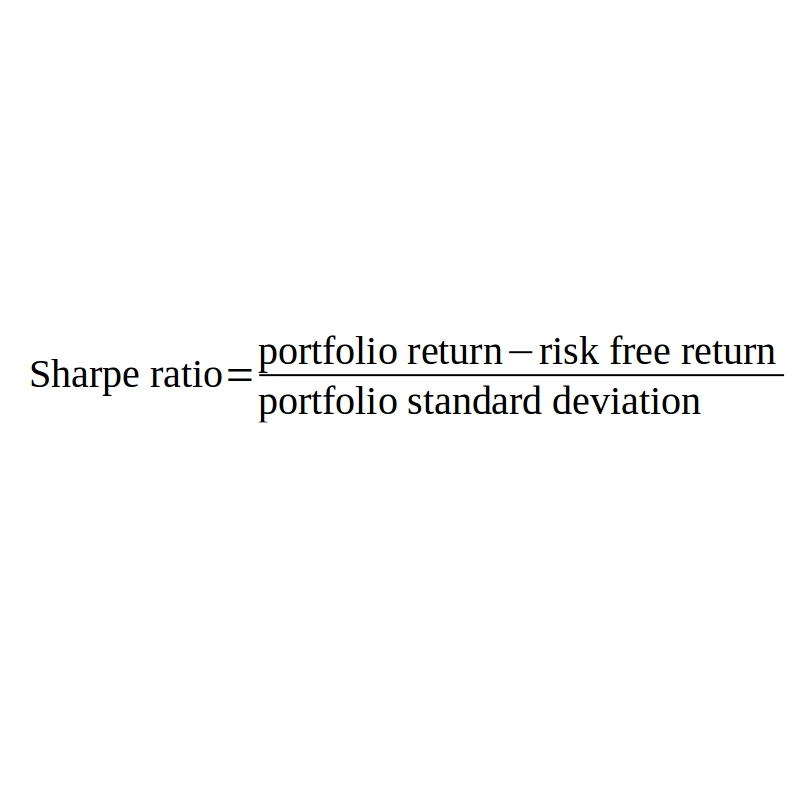
        sharpe_ratio.setdefault(date,[]).append(ret / volatility)

    # get the index of the best sharpe ratio for each date
    max_sharpe_idxs[date] = np.argmax(sharpe_ratio[date])
Créer des variables explicatives
# calculate exponentially-weighted moving average of daily returns
ewma_daily = returns_daily.ewm(span=30).mean()

# resample daily returns to first business day of the month
ewma_monthly = ewma_daily.resample('BMS').first()

# shift ewma 1 month forward
ewma_monthly = ewma_monthly.shift(1).dropna()
Calculer variables explicatives et cibles
targets, features = [], []


# create features from price history and targets as ideal portfolio
for date, ewma in ewma_monthly.iterrows():
    # get the index of the best sharpe ratio
    best_idx = max_sharpe_idxs[date]
    targets.append(portfolio_weights[date][best_idx])
    features.append(ewma)

targets = np.array(targets)
features = np.array(features)