Théorie moderne du portefeuille (MPT) ; frontières efficientes

Machine Learning pour la finance en Python

Nathan George

Data Science Professor
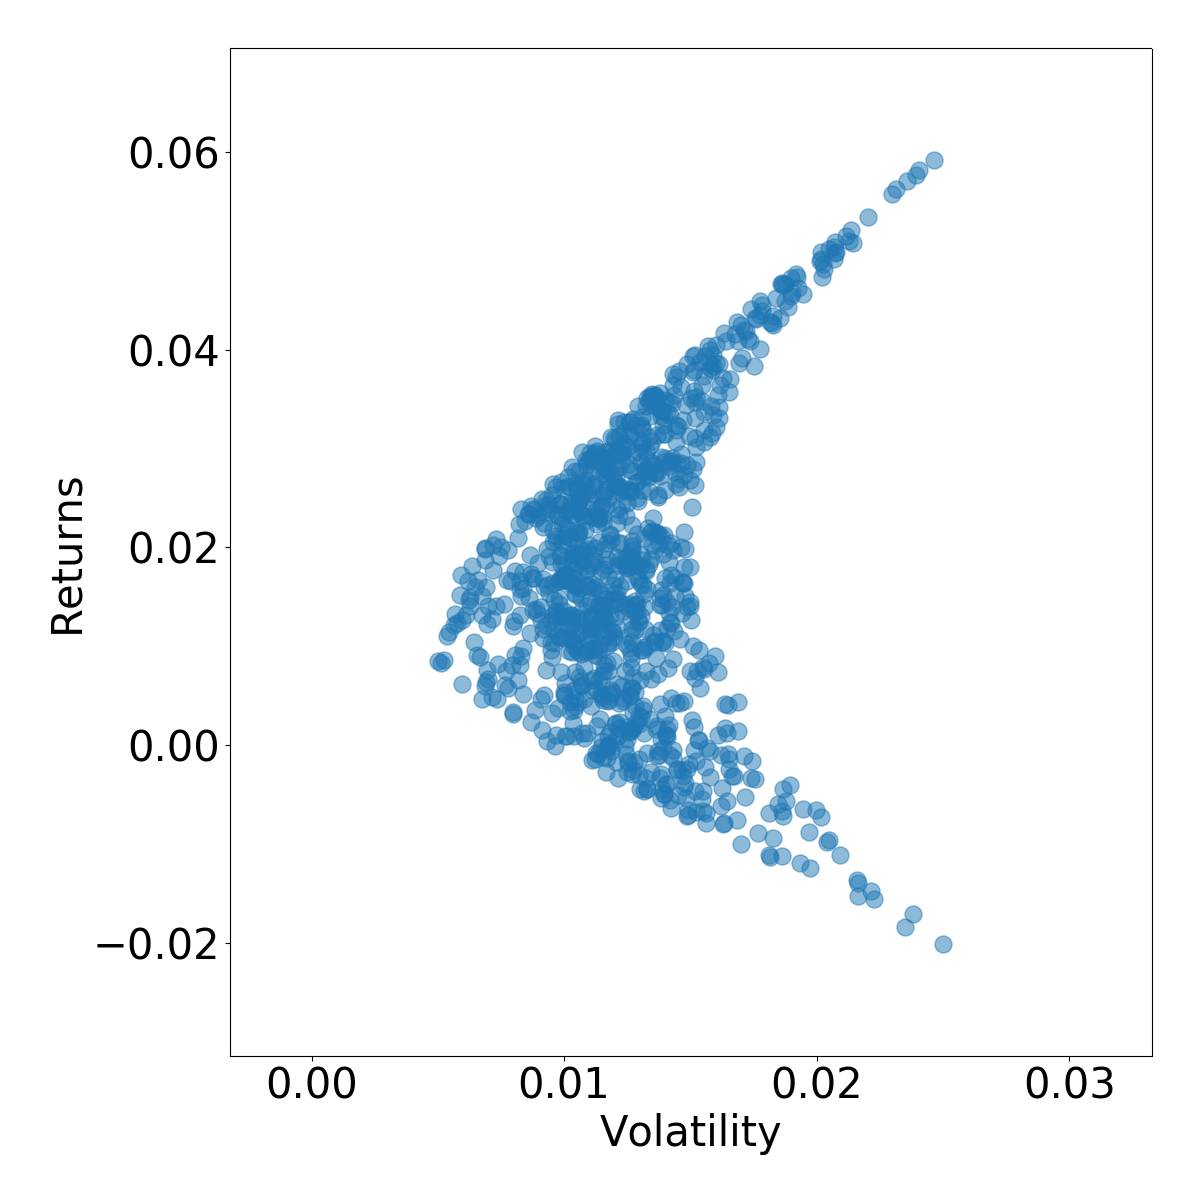
frontière efficiente

Machine Learning pour la finance en Python

Assembler les données

stocks = ['AMD', 'CHK', 'QQQ']
full_df = pd.concat([amd_df, chk_df, qqq_df], axis=1).dropna()
full_df.head()
              AMD       CHK        QQQ
Date                                  
1999-03-10  8.690  0.904417  45.479603
1999-03-11  8.500  0.951617  45.702324
1999-03-12  8.250  0.951617  44.588720
1999-03-15  8.155  0.951617  45.880501
1999-03-16  8.500  0.951617  46.281398
Machine Learning pour la finance en Python
# calculate daily returns of stocks
returns_daily = full_df.pct_change()

# resample the full dataframe to monthly timeframe
monthly_df = full_df.resample('BMS').first()

# calculate monthly returns of the stocks
returns_monthly = monthly_df.pct_change().dropna()
print(returns_monthly.tail())
                 AMD       CHK       QQQ
Date                                    
2018-01-01  0.023299  0.002445  0.028022
2018-02-01  0.206740 -0.156098  0.059751
2018-03-01 -0.101887 -0.190751 -0.020719
2018-04-02 -0.199160  0.060714 -0.052971
2018-05-01  0.167891  0.003367  0.046749
Machine Learning pour la finance en Python

Covariances

# daily covariance of stocks (for each monthly period)
covariances = {}
for i in returns_monthly.index:
    rtd_idx = returns_daily.index
    # mask daily returns for each month (and year) & calculate covariance
    mask = (rtd_idx.month == i.month) & (rtd_idx.year == i.year)
    covariances[i] = returns_daily[mask].cov()

print(covariances[i])
          AMD       CHK       QQQ
AMD  0.000257  0.000177  0.000068
CHK  0.000177  0.002057  0.000108
QQQ  0.000068  0.000108  0.000051
Machine Learning pour la finance en Python

Générer des pondérations de portefeuilles

for date in covariances.keys():
    cov = covariances[date]
    for single_portfolio in range(5000):
        weights = np.random.random(3)
        weights /= np.sum(weights)
Machine Learning pour la finance en Python

Calculer rendements et volatilité

portfolio_returns, portfolio_volatility, portfolio_weights = {},{},{}

# get portfolio performances at each month
for date in covariances.keys():
    cov = covariances[date]
    for single_portfolio in range(5000):
        weights = np.random.random(3)
        weights /= np.sum(weights)

returns = np.dot(weights, returns_monthly.loc[date]) volatility = np.sqrt(np.dot(weights.T, np.dot(cov, weights)))
portfolio_returns.setdefault(date, []).append(returns) portfolio_volatility.setdefault(date, []).append(volatility) portfolio_weights.setdefault(date, []).append(weights)
Machine Learning pour la finance en Python

Tracer la frontière efficiente

date = sorted(covariances.keys())[-1]
# plot efficient frontier
plt.scatter(x=portfolio_volatility[date],
            y=portfolio_returns[date],
            alpha=0.5)
plt.xlabel('Volatility')
plt.ylabel('Returns')
plt.show()
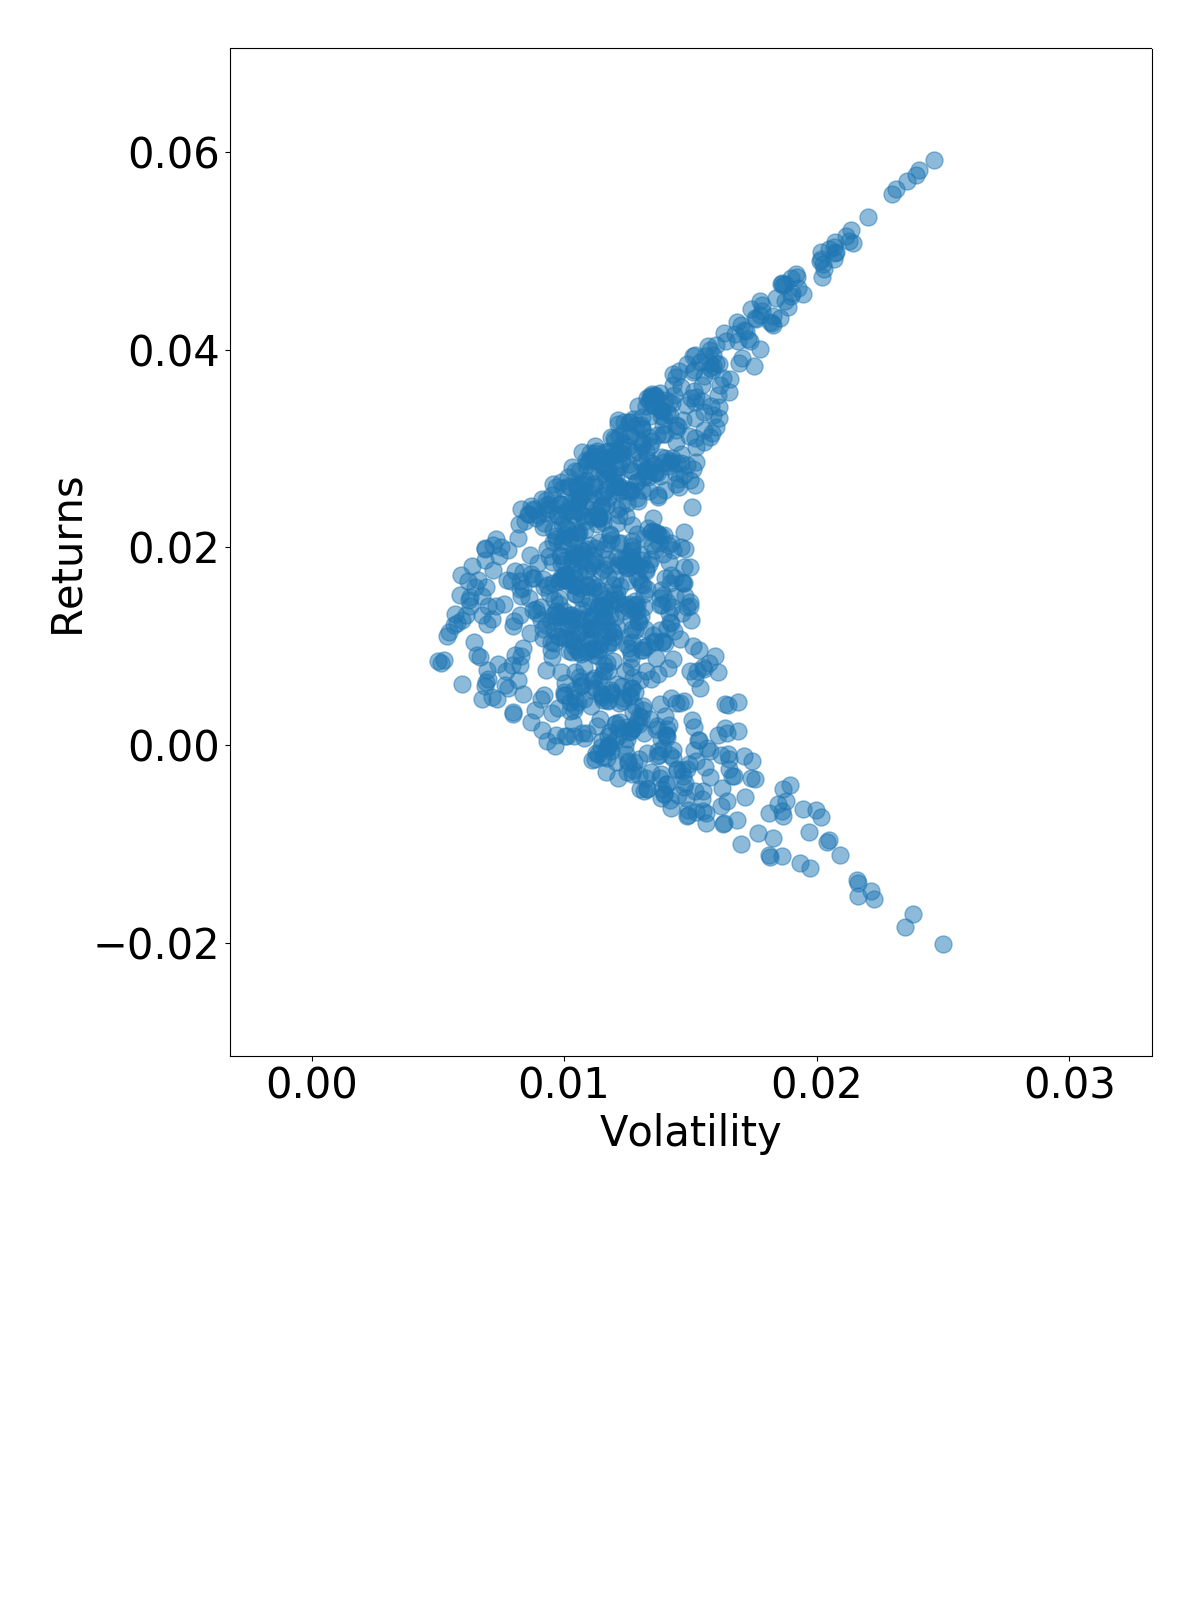
frontière efficiente

Machine Learning pour la finance en Python

Calculez des portefeuilles MPT !

Machine Learning pour la finance en Python

Preparing Video For Download...