Analyse d'images biomédicales en Python
Stephen Bailey
Instructor

Le type de données du tableau fixe l'intervalle d'intensités possible
| Type | Intervalle | Nb. de valeurs |
|---|---|---|
| uint8 | 0, 255 | 256 |
| int8 | - 128, 127 | 256 |
| uint16 | 0, 2$^{16}$ | 2$^{16}$ |
| int16 | -2$^{15}$, 2$^{15}$ | 2$^{16}$ |
| float16 | ~-2$^{16}$, ~2$^{16}$ | >>2$^{16}$ |
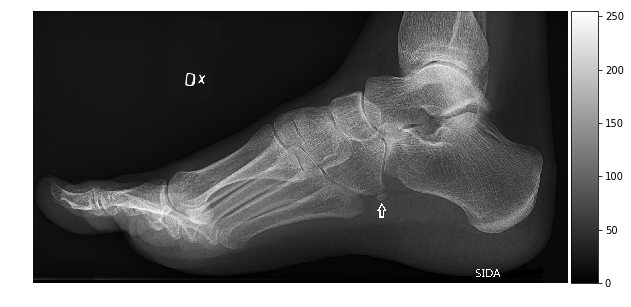
import imageio.v2 as imageio im=imageio.imread('foot-xray.jpg') im.dtype dtype('uint8')im.size
153600
im_int64 = im.astype(np.uint64)
im_int64.size
1228800
scipy.ndimagescikit-image.plt.plot(hist)
plt.show()
import scipy.ndimage as ndihist=ndi.histogram(im, min=0, max=255, bins=256)hist.shape
(256,)
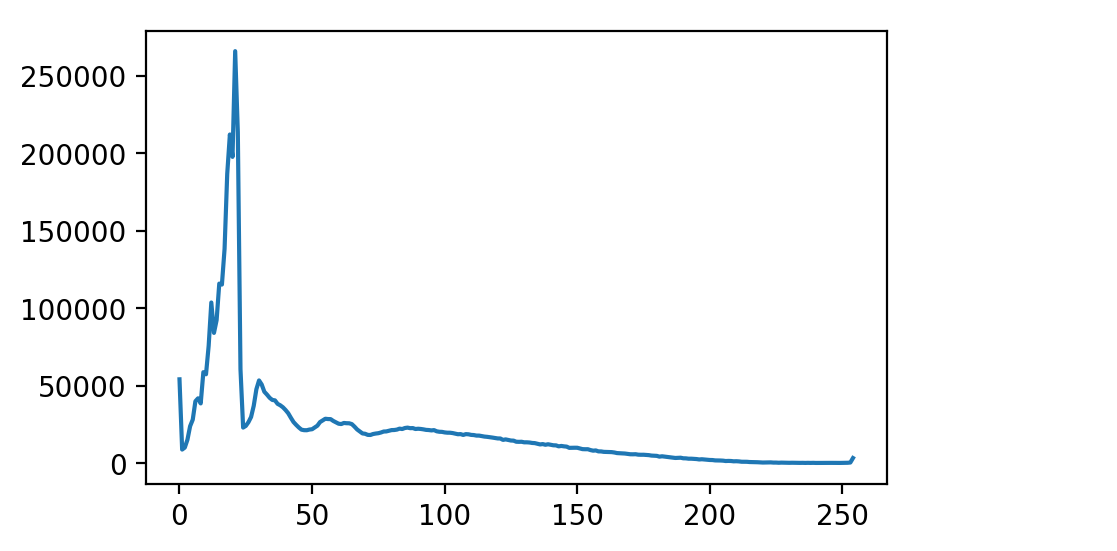
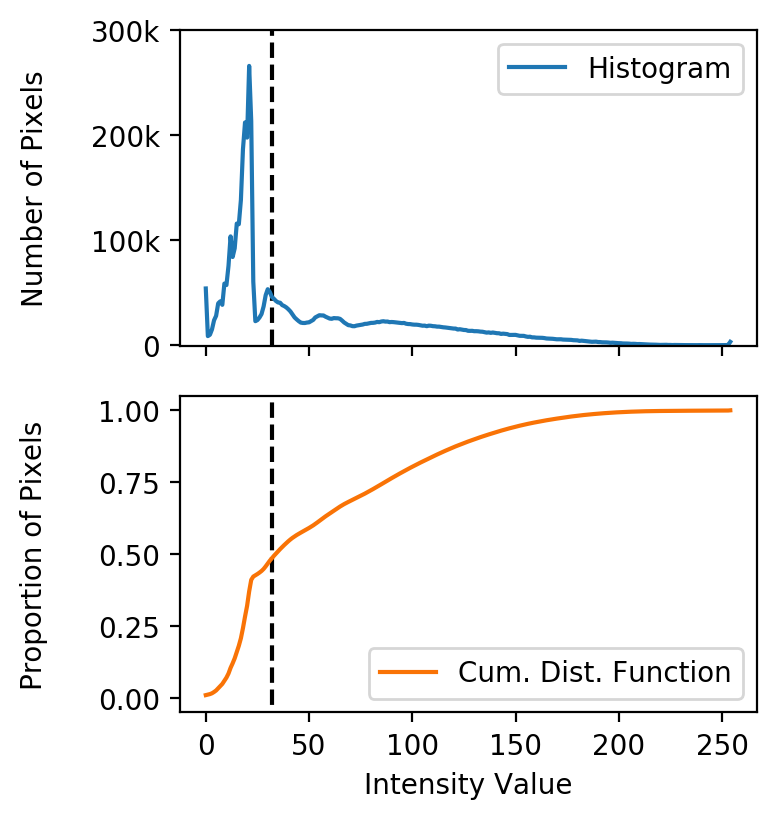
Les distributions sont souvent biaisées vers les faibles intensités (valeurs de fond).
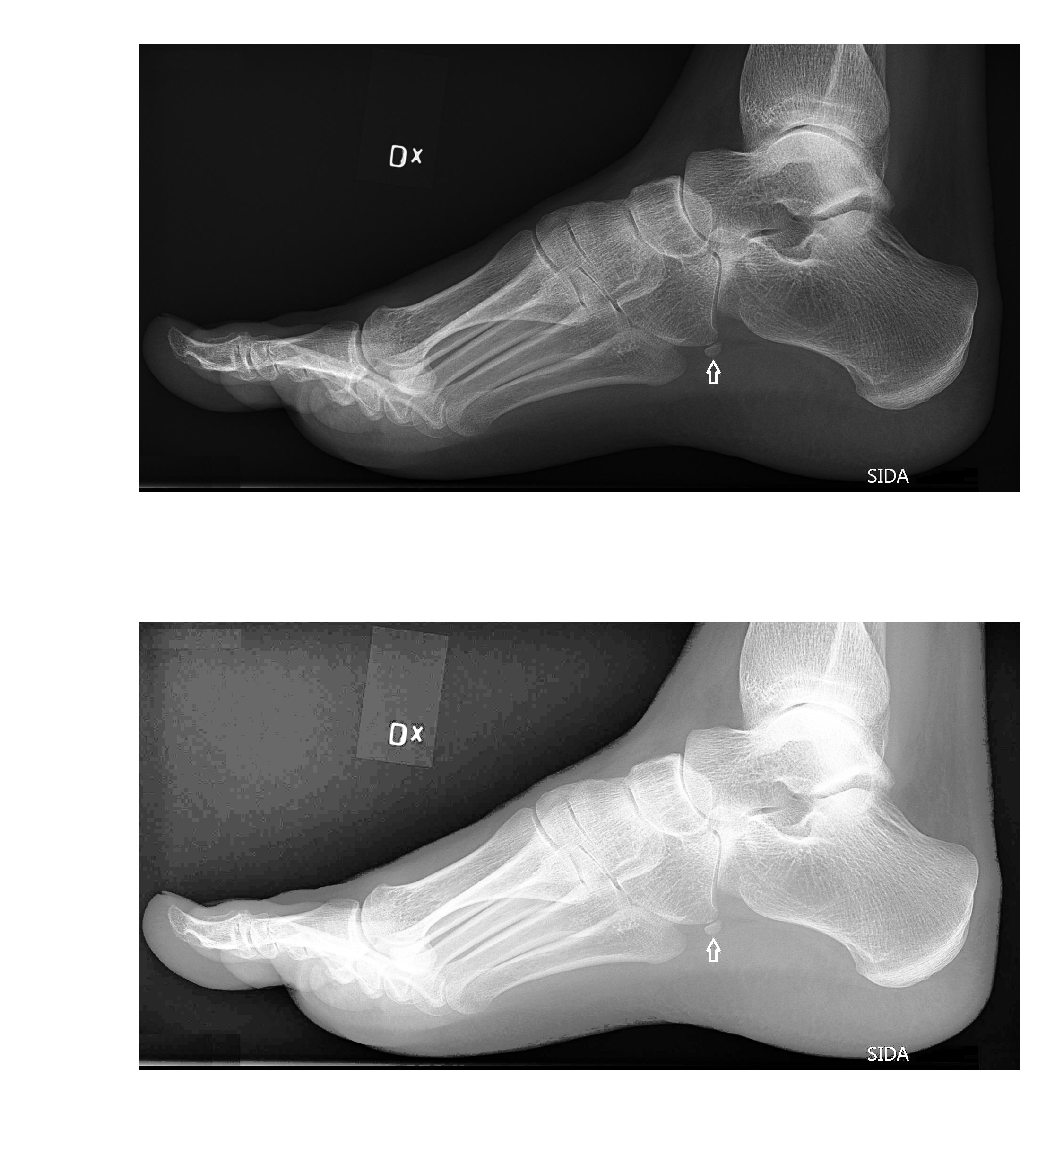
Égalisation : redistribuer les valeurs pour exploiter tout l'intervalle d'intensité.
Fonction de répartition cumulée : (CDF) part de pixels dans un intervalle.

import scipy.ndimage as ndi hist = ndi.histogram(im, min=0, max=255, bins=256)cdf = hist.cumsum() / hist.sum() cdf.shape
(256,)
im_equalized = cdf[im] * 255fig, axes = plt.subplots(2, 1) axes[0].imshow(im) axes[1].imshow(im_equalized) plt.show()

Analyse d'images biomédicales en Python