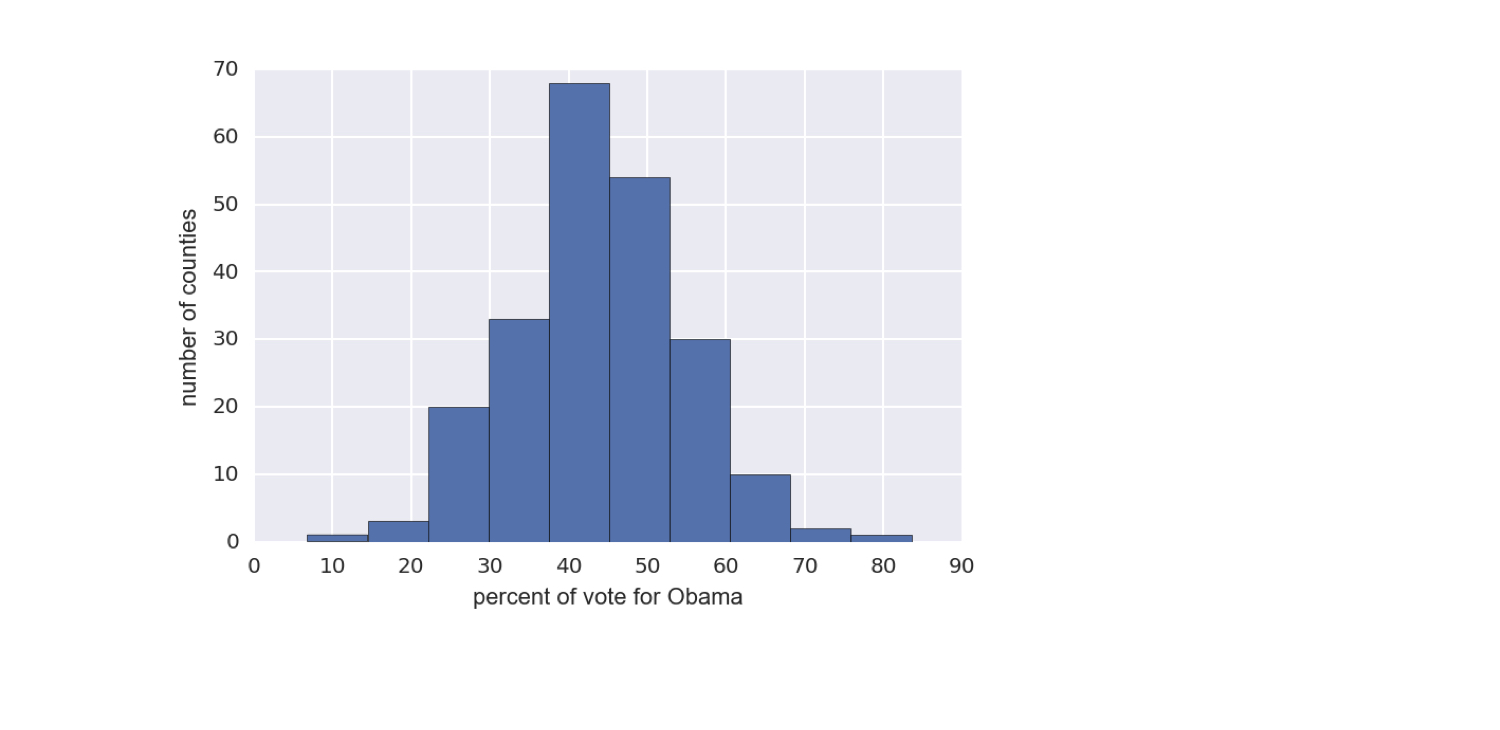
Ein Histogramm zeichnen

Statistical Thinking in Python (Teil 1)

Justin Bois

Teaching Professor at the California Institute of Technology

US‑Wahl 2008: Swing States

Daten von Data.gov (https://www.data.gov/)
ch1-2.003.png

Statistical Thinking in Python (Teil 1)

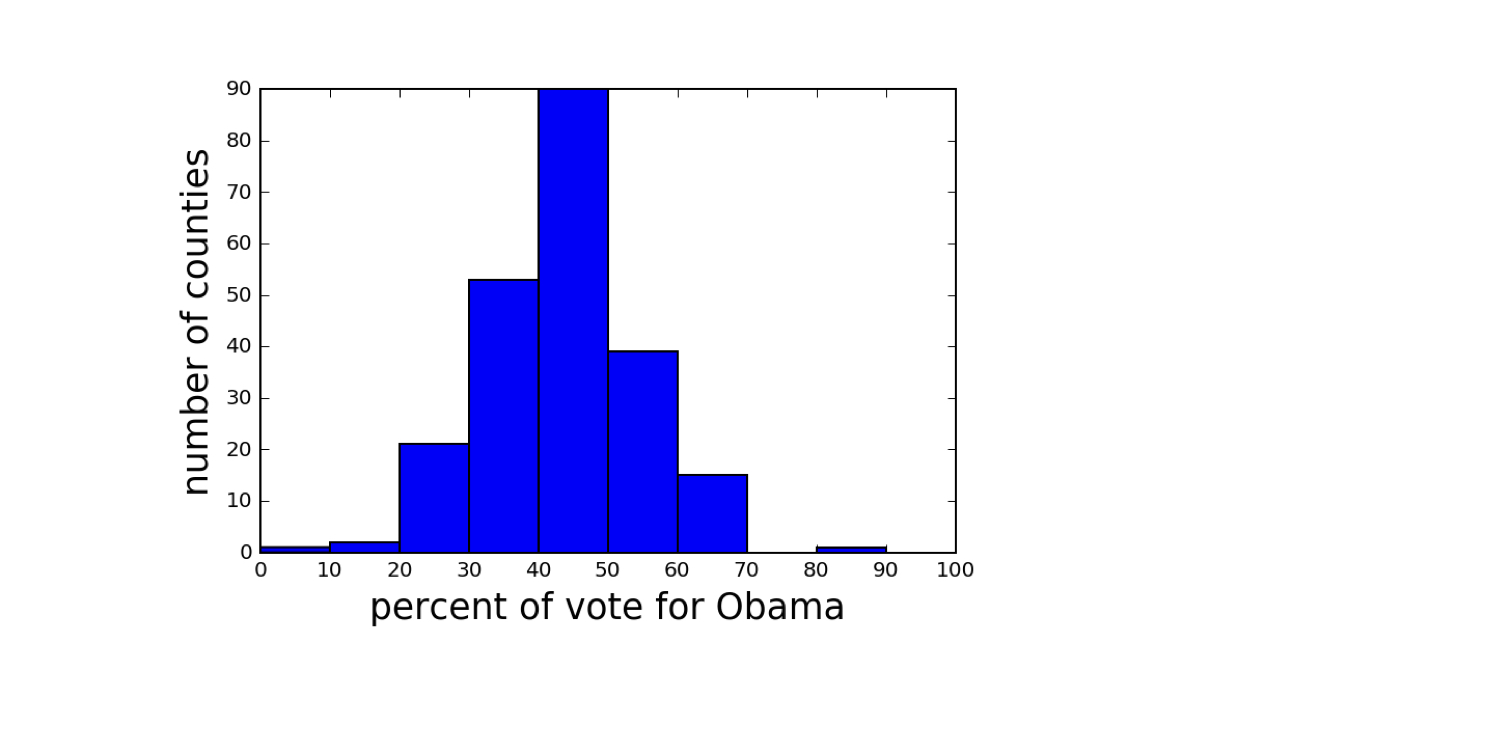
Ein Histogramm erzeugen

import matplotlib.pyplot as plt
_ = plt.hist(df_swing['dem_share'])
_ = plt.xlabel('percent of vote for Obama')
_ = plt.ylabel('number of counties')
plt.show()
Statistical Thinking in Python (Teil 1)

Achsen immer beschriften

Statistical Thinking in Python (Teil 1)

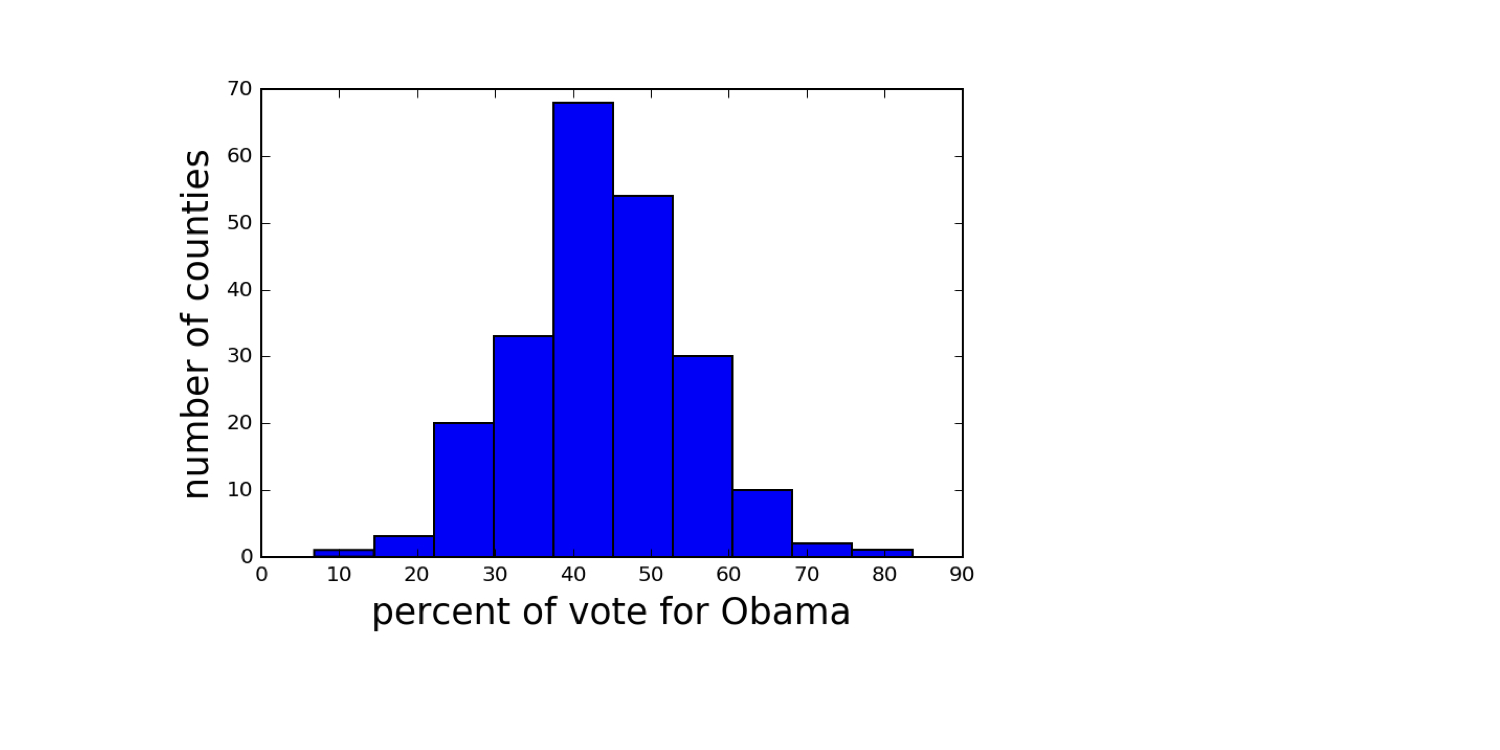
US‑Wahl 2008: Swing States

Daten von Data.gov (https://www.data.gov/)
ch1-2.013.png

Statistical Thinking in Python (Teil 1)

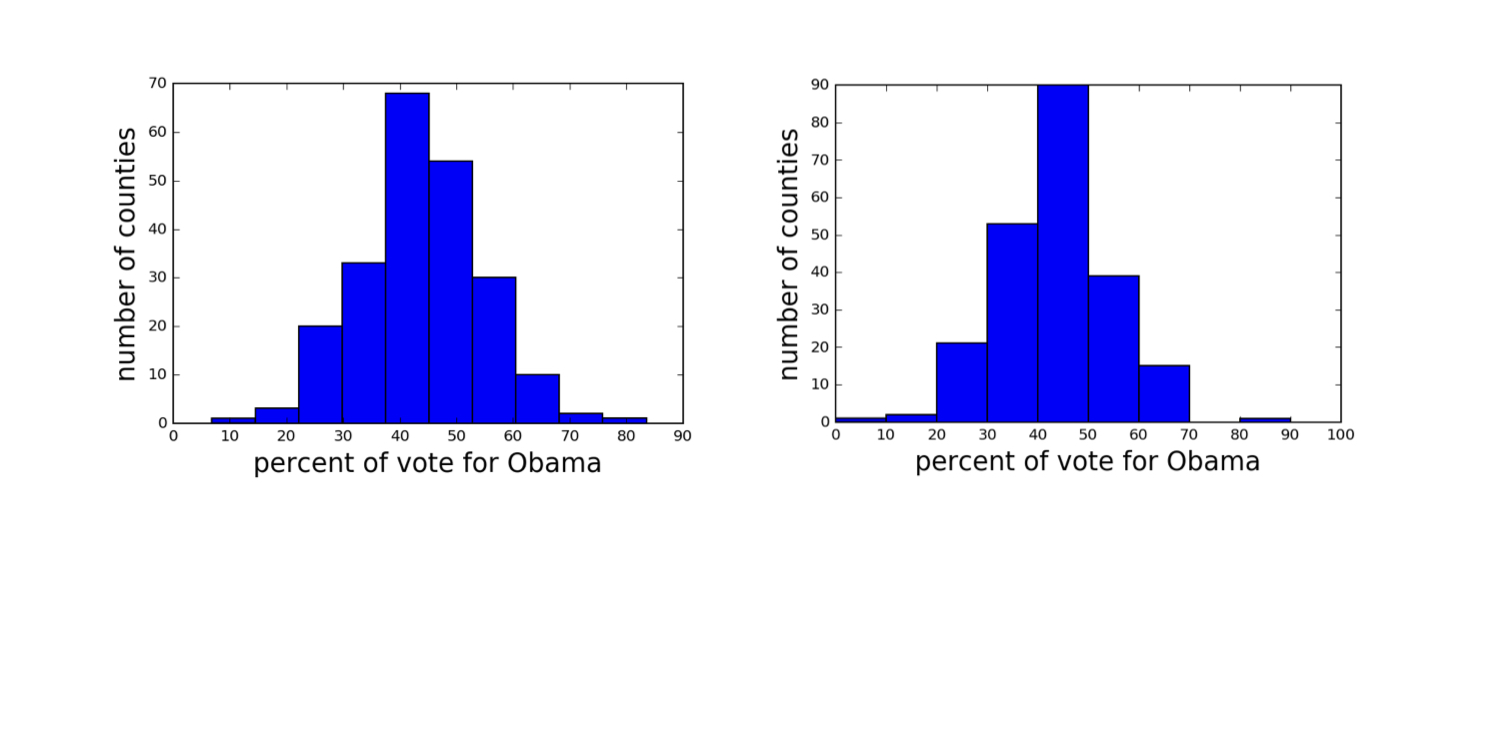
Histogramme mit unterschiedlicher Binning‑Wahl

Daten von Data.gov (https://www.data.gov/)
ch1-2.015.png

Statistical Thinking in Python (Teil 1)

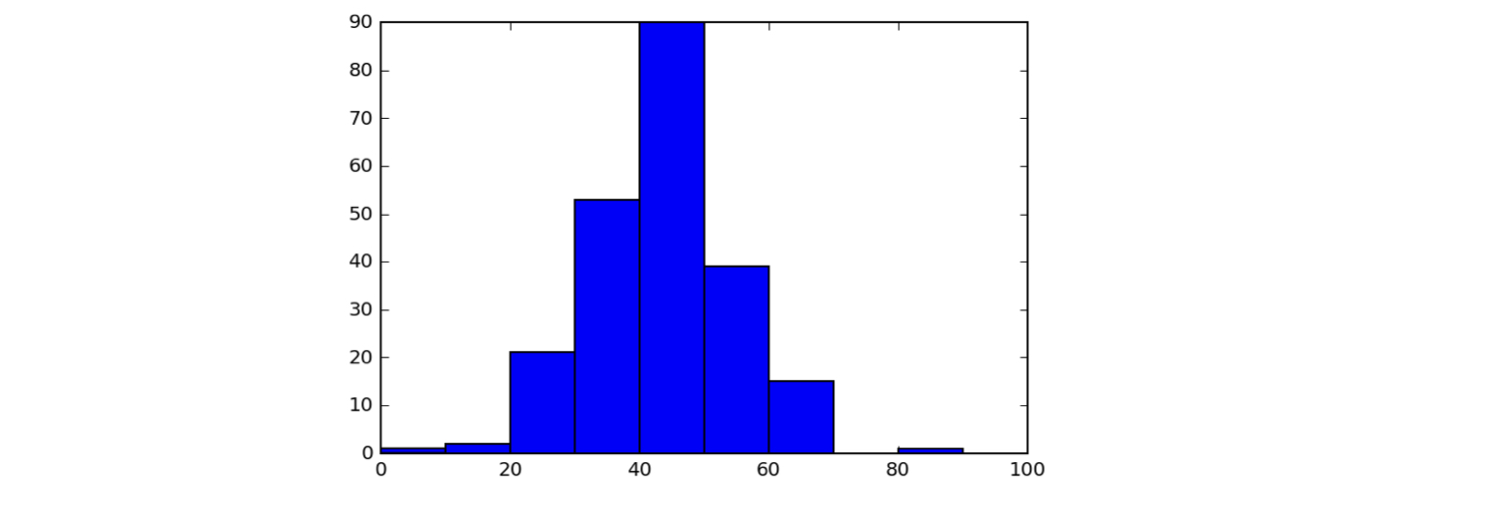
Bins eines Histogramms festlegen

bin_edges = [0, 10, 20, 30, 40, 50,
                60, 70, 80, 90, 100]
_ = plt.hist(df_swing['dem_share'], bins=bin_edges)
plt.show()
ch1-2.022.png

Statistical Thinking in Python (Teil 1)

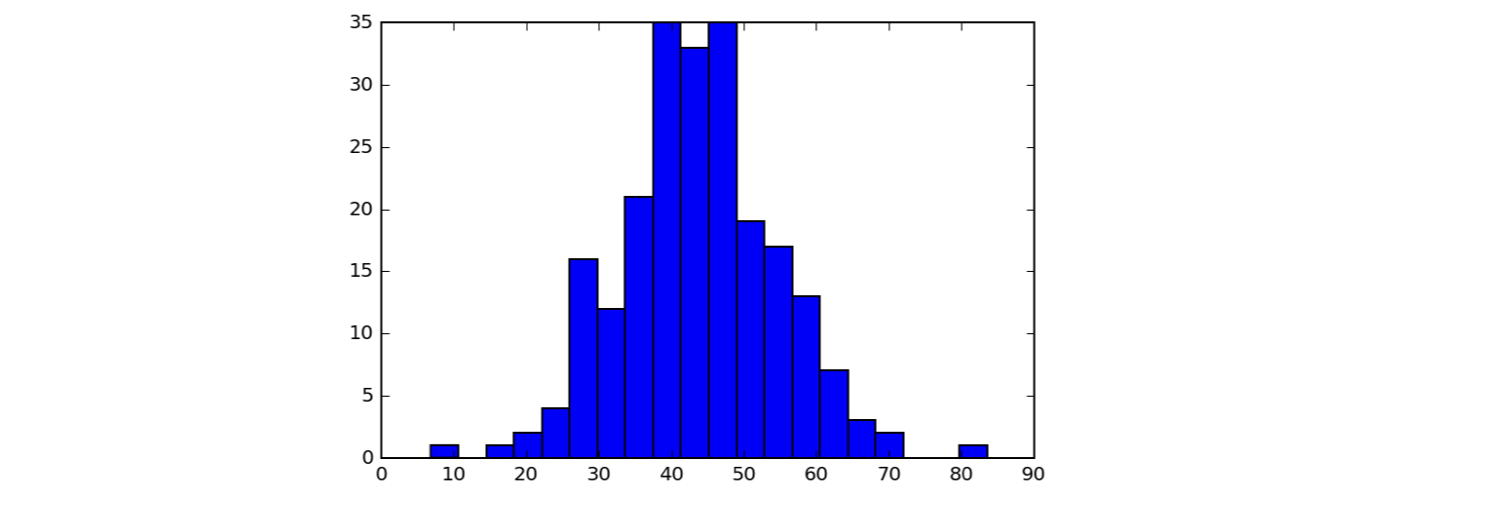
Bins eines Histogramms festlegen

_ = plt.hist(df_swing['dem_share'], bins=20)
plt.show()
ch1-2.027.png

Statistical Thinking in Python (Teil 1)

Seaborn

  • Ein hervorragendes, auf Matplotlib basierendes Paket für statistische Visualisierung von Michael Waskom
Statistical Thinking in Python (Teil 1)

Seaborn-Styling setzen

import seaborn as sns
sns.set()
_ = plt.hist(df_swing['dem_share'])
_ = plt.xlabel('percent of vote for Obama')
_ = plt.ylabel('number of counties')
plt.show()
Statistical Thinking in Python (Teil 1)

Ein Seaborn‑gestyltes Histogramm

ch1-2.038.png

1 Daten von Data.gov (https://www.data.gov/)
Statistical Thinking in Python (Teil 1)

Lass uns üben!

Statistical Thinking in Python (Teil 1)

Preparing Video For Download...