Alle Daten plotten: ECDFs

Statistical Thinking in Python (Teil 1)

Justin Bois

Teaching Professor at the California Institute of Technology

US-Wahl 2008: Ergebnisse in Swing States
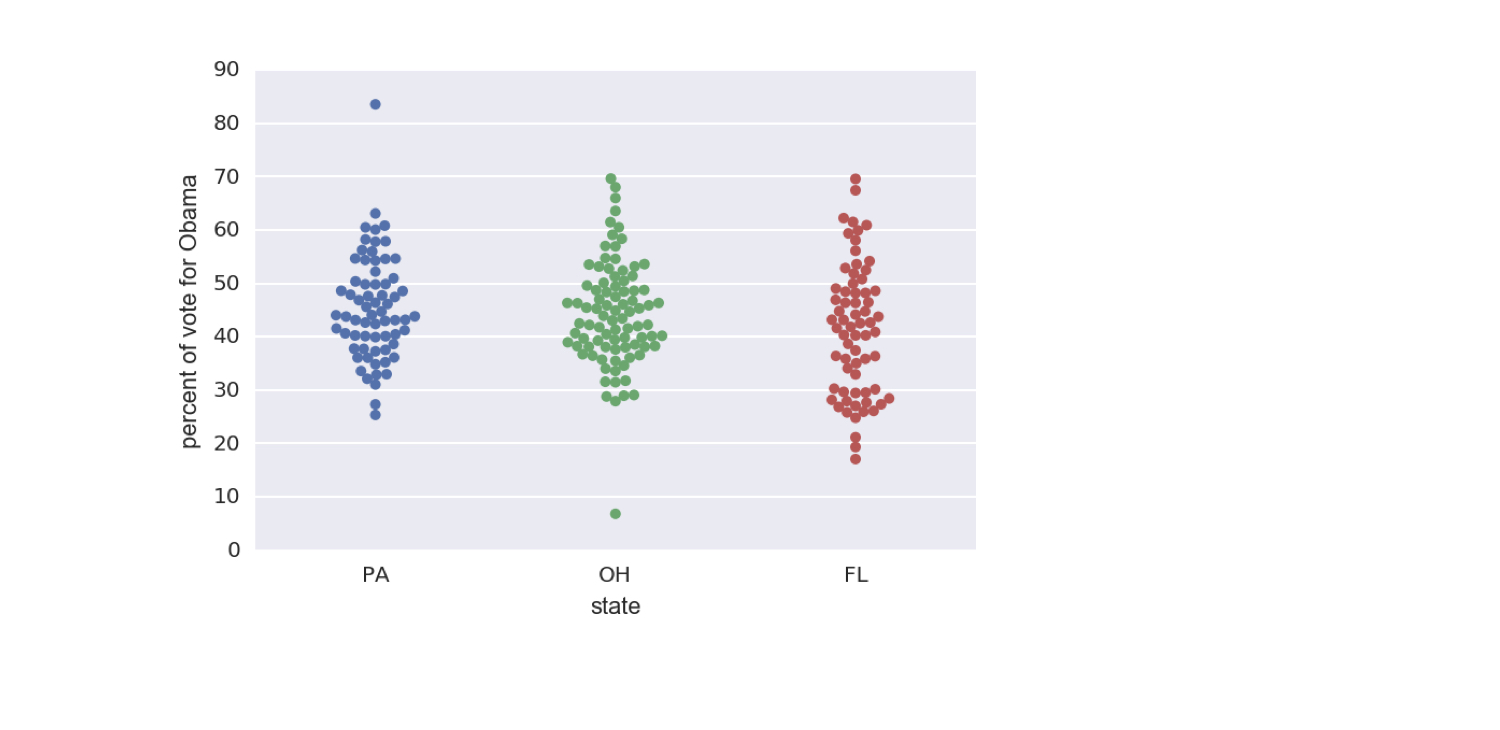
ch1-4_v2.003.png

1 Daten von Data.gov (https://www.data.gov/)
Statistical Thinking in Python (Teil 1)

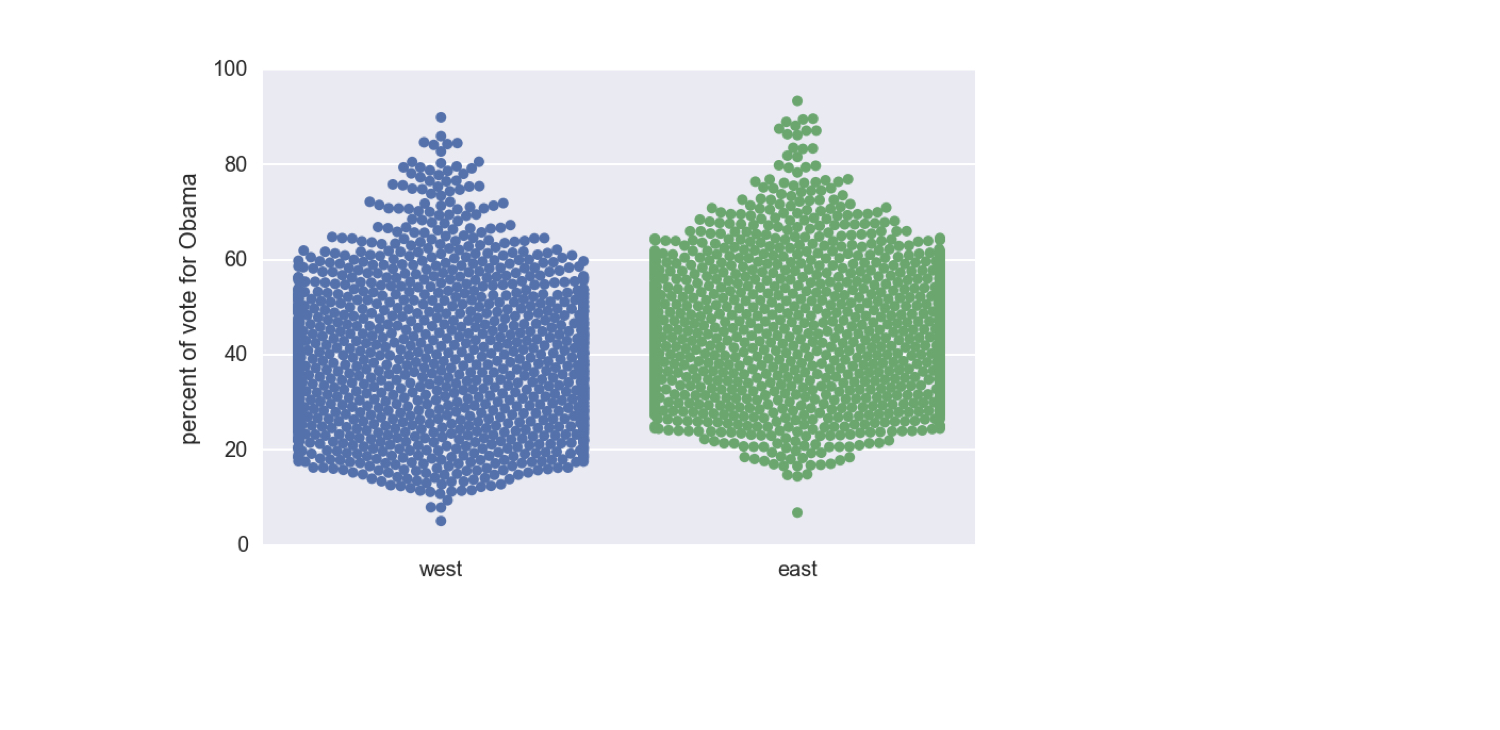
US-Wahl 2008: Osten und Westen

ch1-4_v2.005.png

1 Daten von Data.gov (https://www.data.gov/)
Statistical Thinking in Python (Teil 1)

Empirische kumulative Verteilungsfunktion (ECDF)
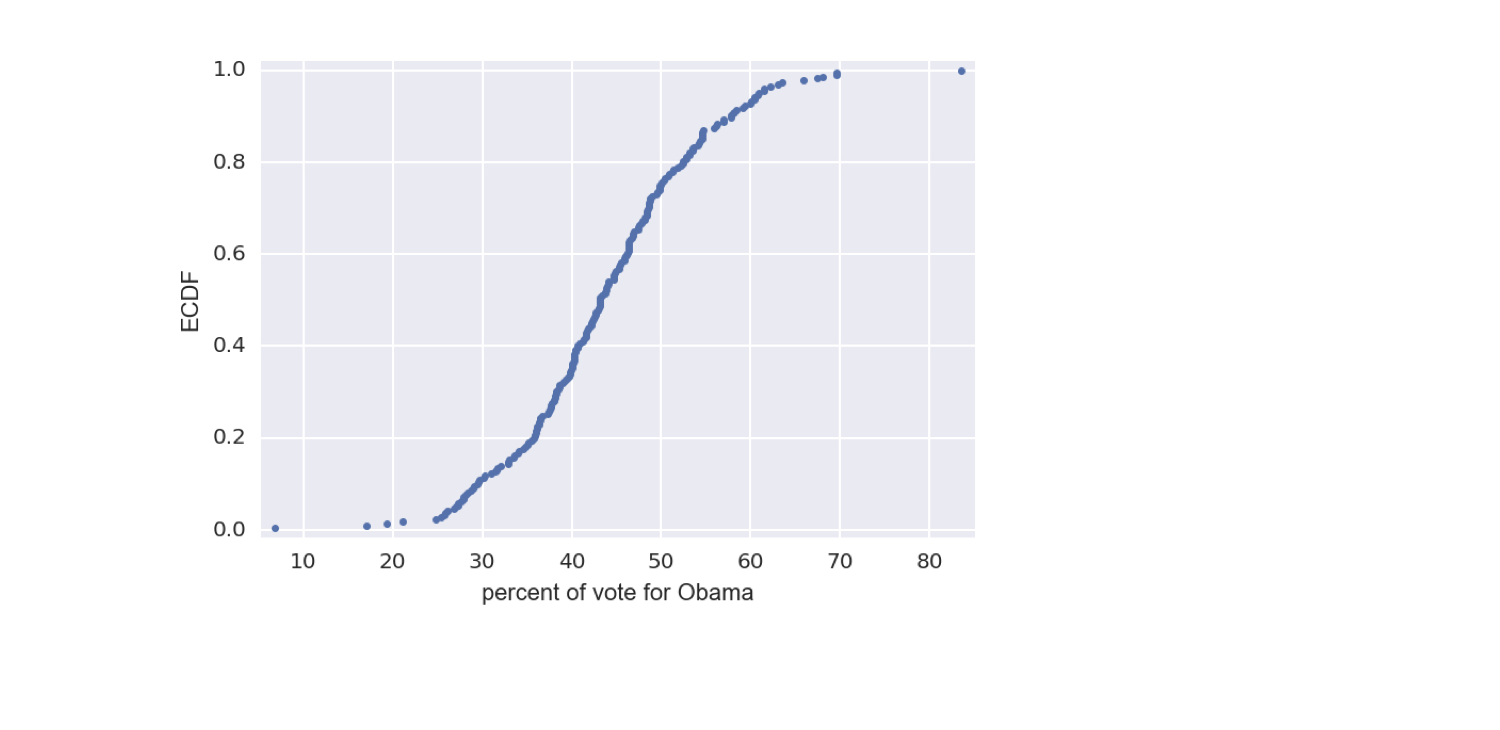
ch1-4_v2.007.png

1 Daten von Data.gov (https://www.data.gov/)
Statistical Thinking in Python (Teil 1)

Empirische kumulative Verteilungsfunktion (ECDF)
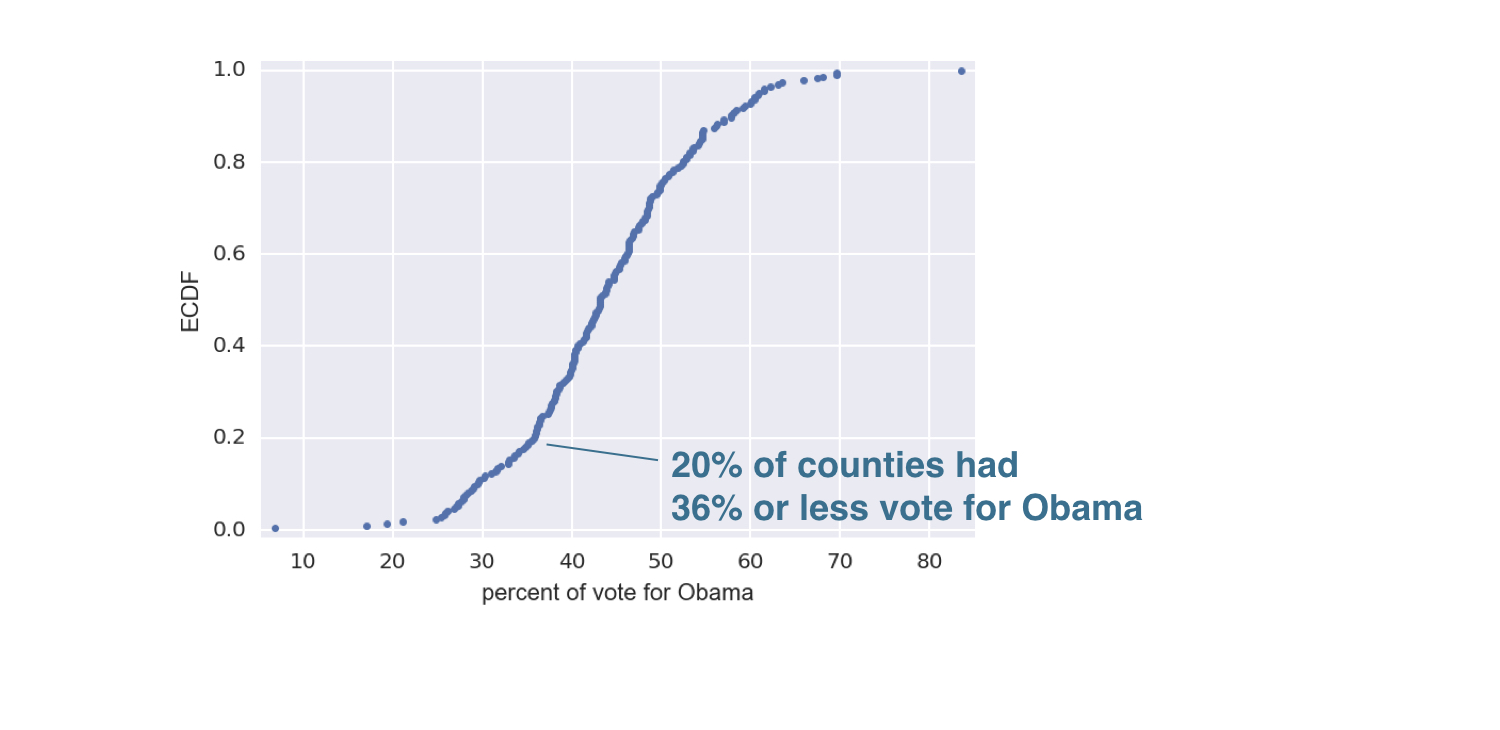
ch1-4_v2.008.png

1 Daten von Data.gov (https://www.data.gov/)
Statistical Thinking in Python (Teil 1)

Empirische kumulative Verteilungsfunktion (ECDF)
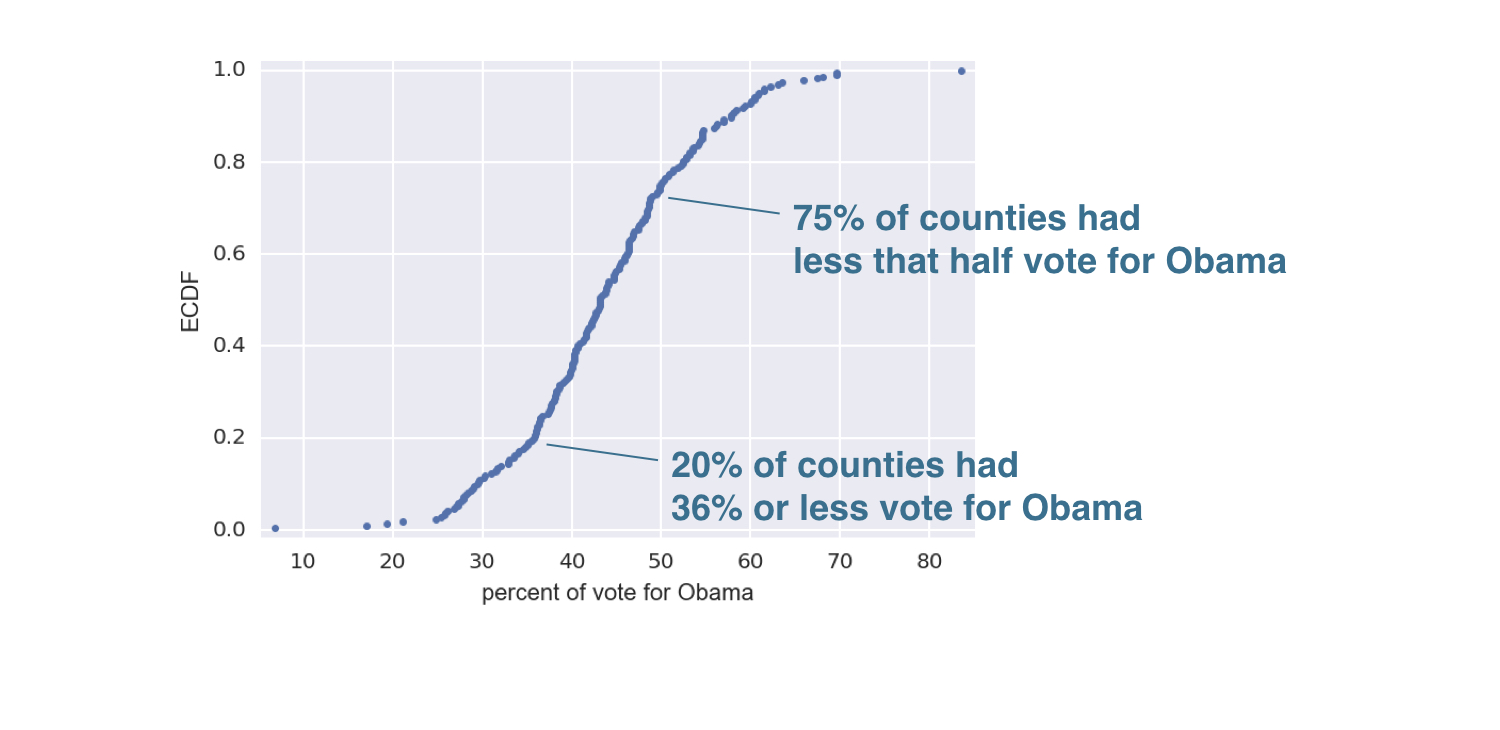
ch1-4_v2.009.png

1 Daten von Data.gov (https://www.data.gov/)
Statistical Thinking in Python (Teil 1)

Eine ECDF erstellen

import numpy as np

x = np.sort(df_swing['dem_share'])
y = np.arange(1, len(x)+1) / len(x)
_ = plt.plot(x, y, marker='.', linestyle='none')
_ = plt.xlabel('percent of vote for Obama') _ = plt.ylabel('ECDF')
plt.margins(0.02) # Keeps data off plot edges plt.show()
Statistical Thinking in Python (Teil 1)

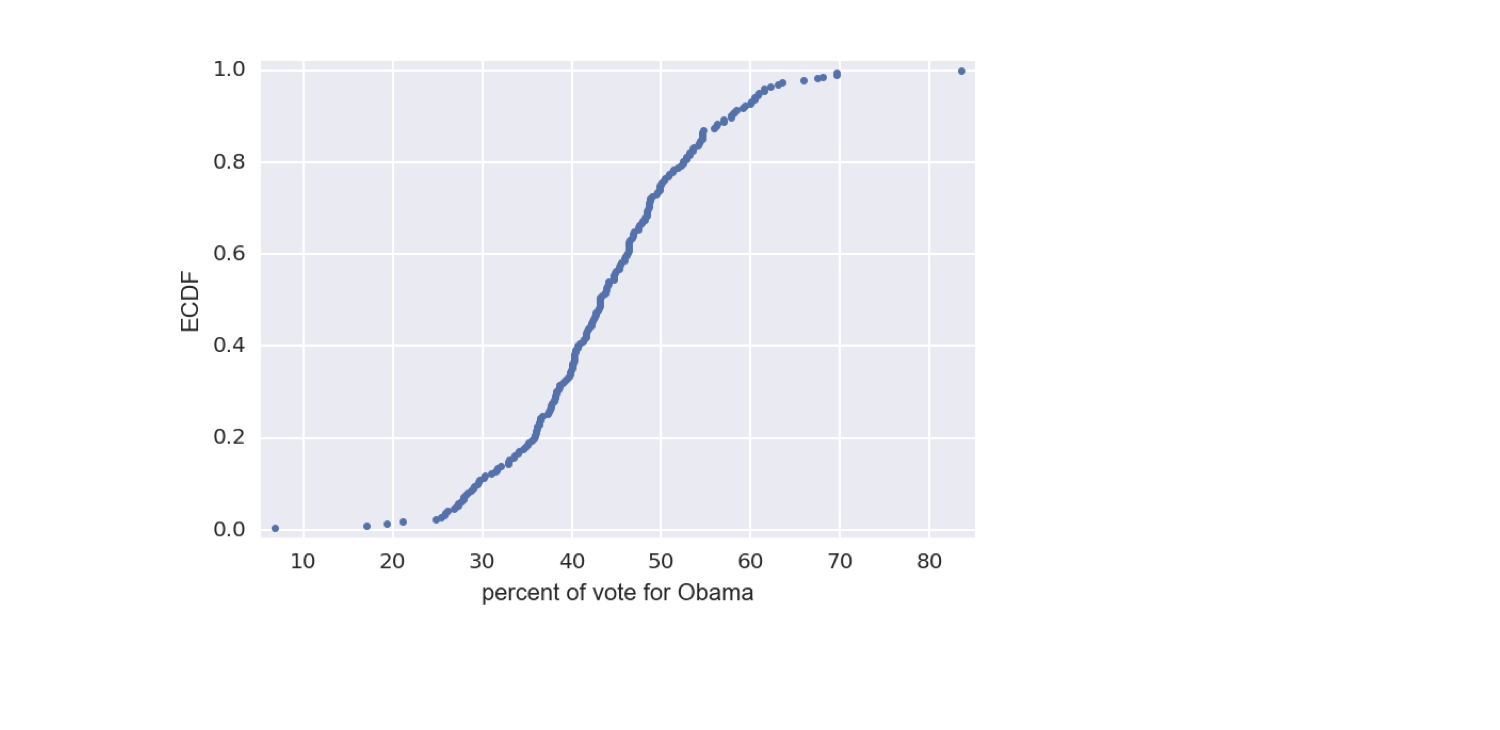
US-Wahl 2008: ECDF in Swing States

ch1-4_v2.022.png

1 Daten von Data.gov (https://www.data.gov/)
Statistical Thinking in Python (Teil 1)

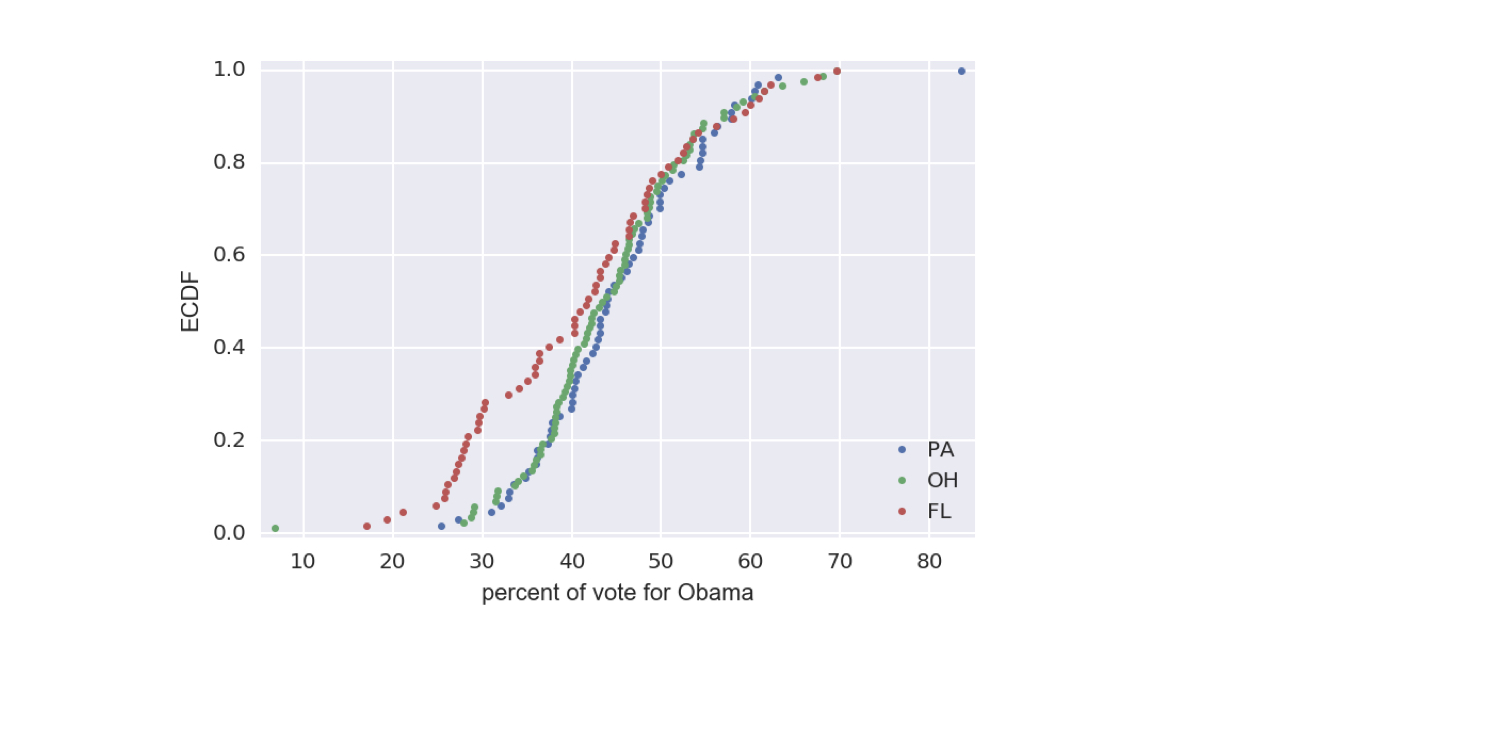
US-Wahl 2008: ECDFs der Swing States

ch1-4_v2.024.png

1 Daten von Data.gov (https://www.data.gov/)
Statistical Thinking in Python (Teil 1)

Lass uns üben!

Statistical Thinking in Python (Teil 1)

Preparing Video For Download...