Autokorrelation

Zeitreihenanalyse in R

David S. Matteson

Associate Professor at Cornell University

Autokorrelation – I

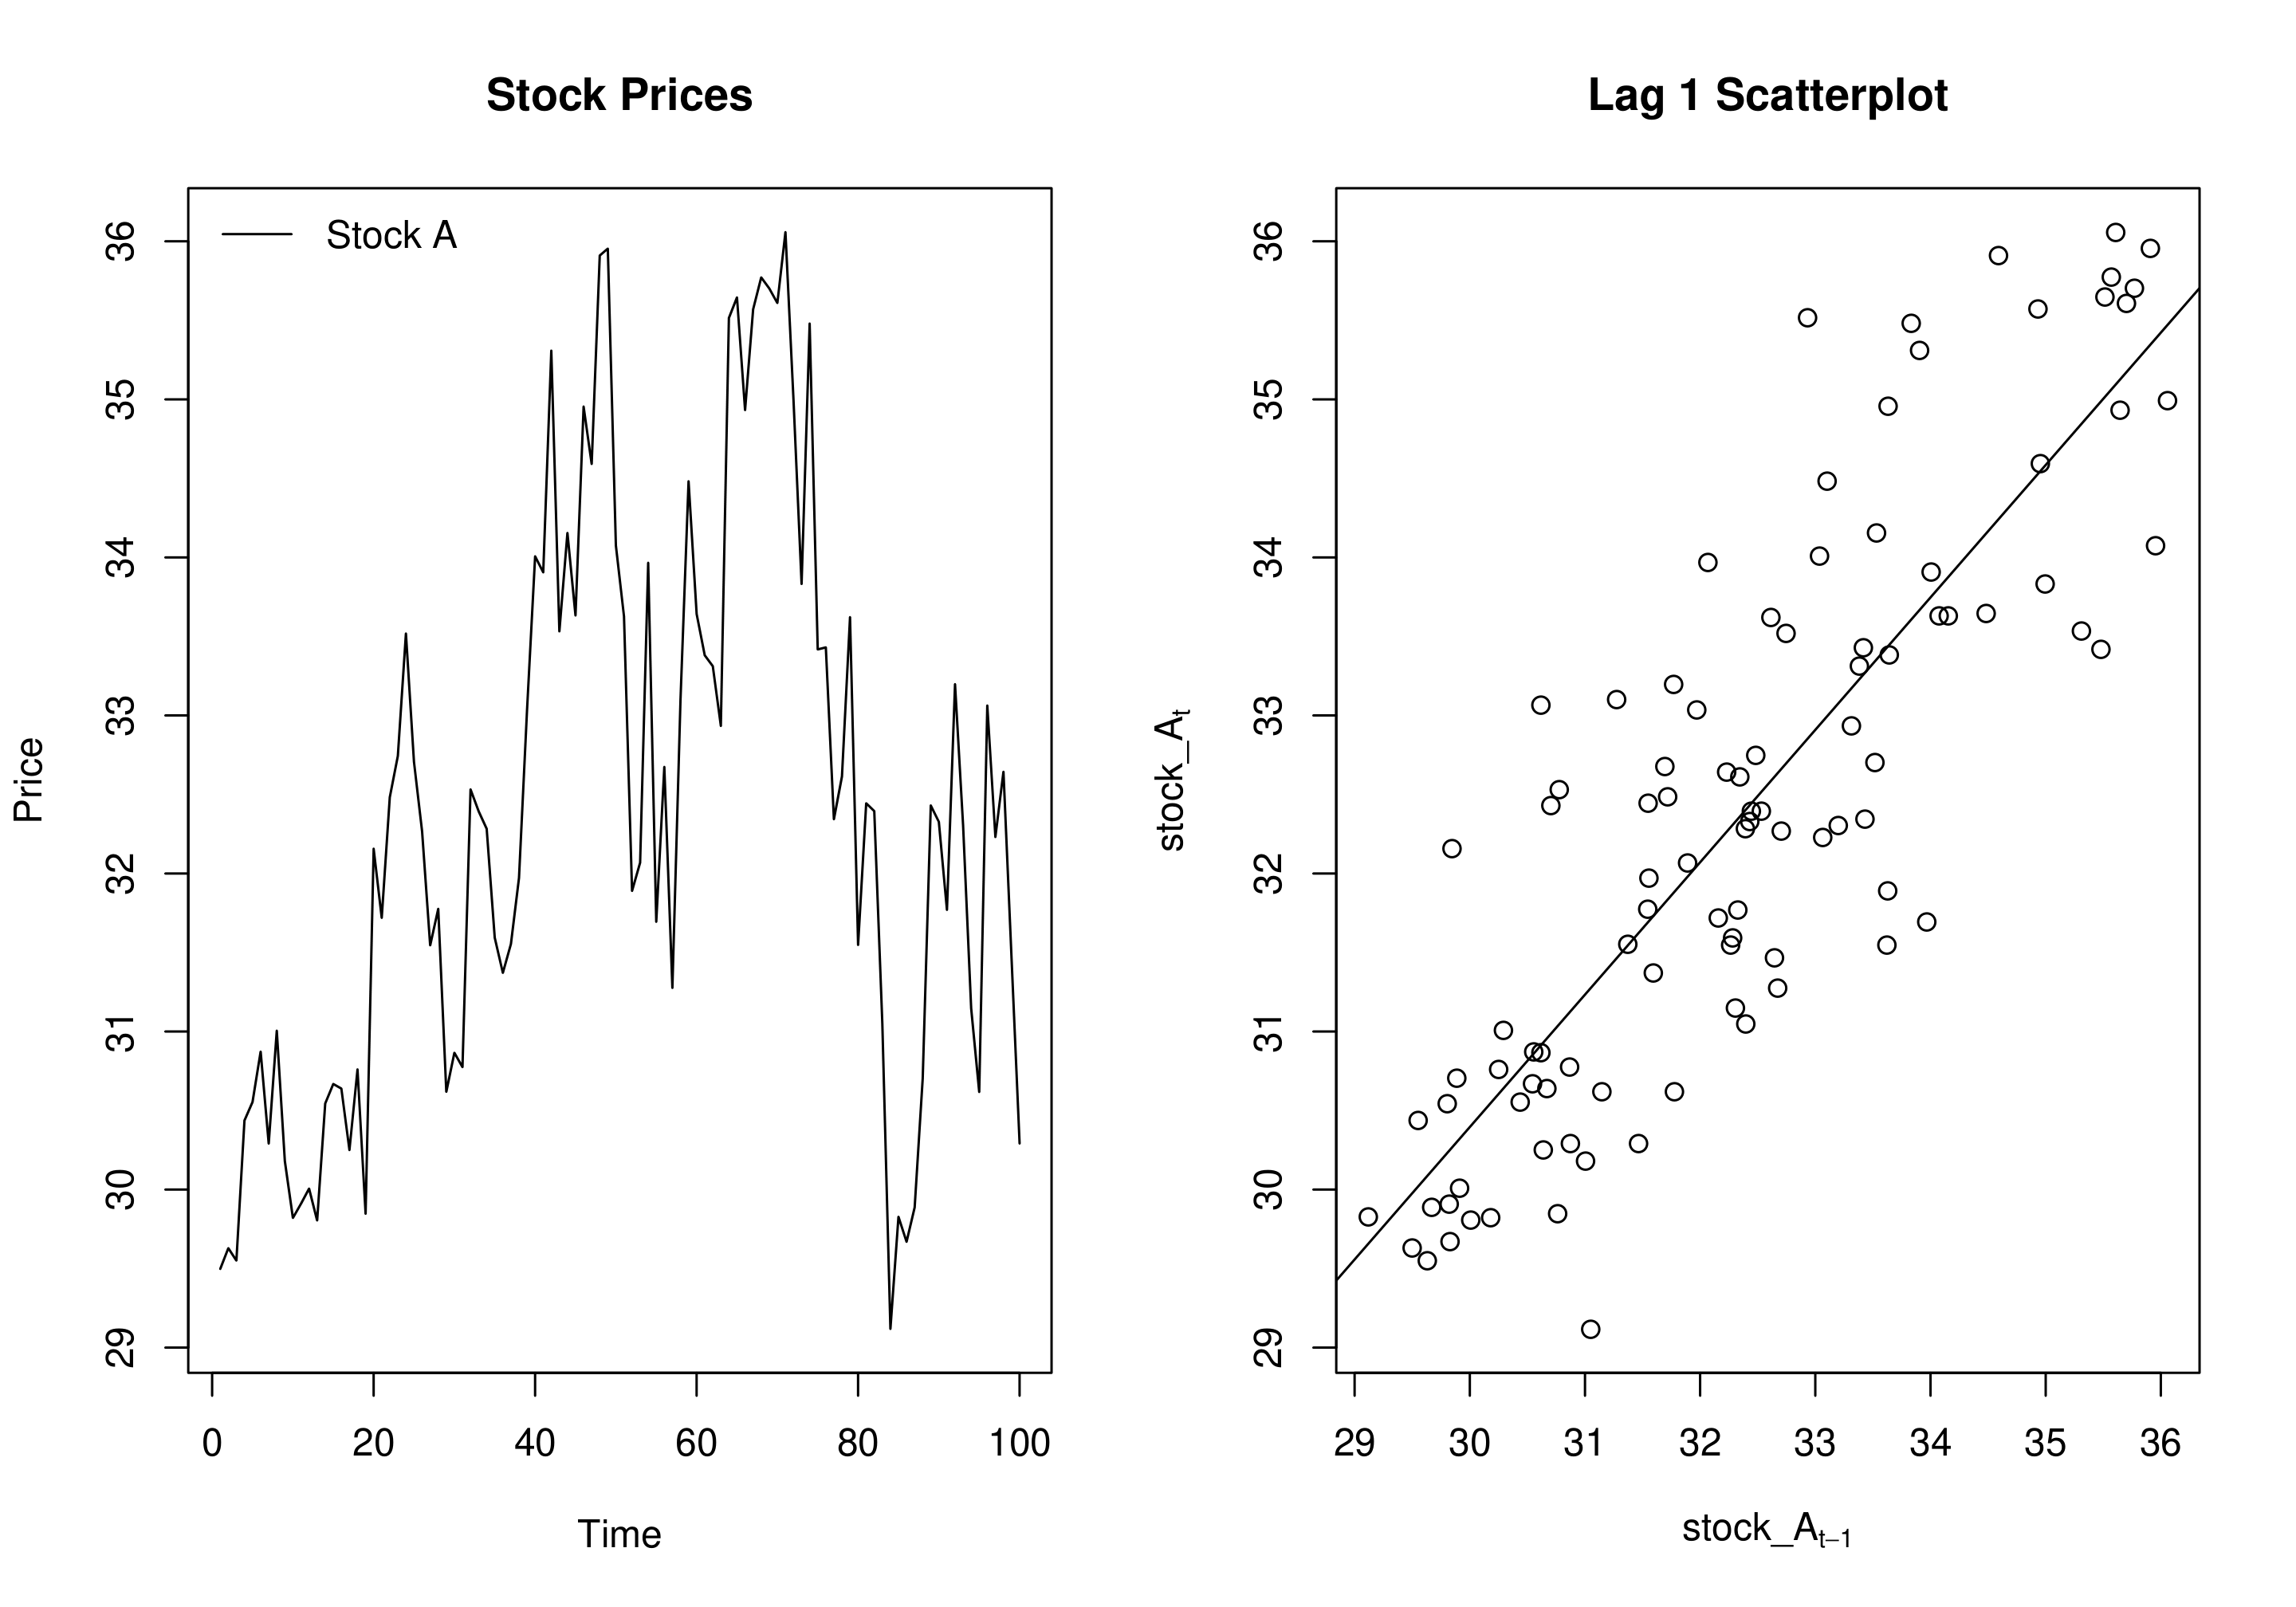
# Autokorrelation mit Lag 1: 
# Korrelation von Aktie A „heute" und Aktie A „gestern"
cor(stock_A[-100], stock_A[-1])
0.84
Zeitreihenanalyse in R

Autokorrelation – II

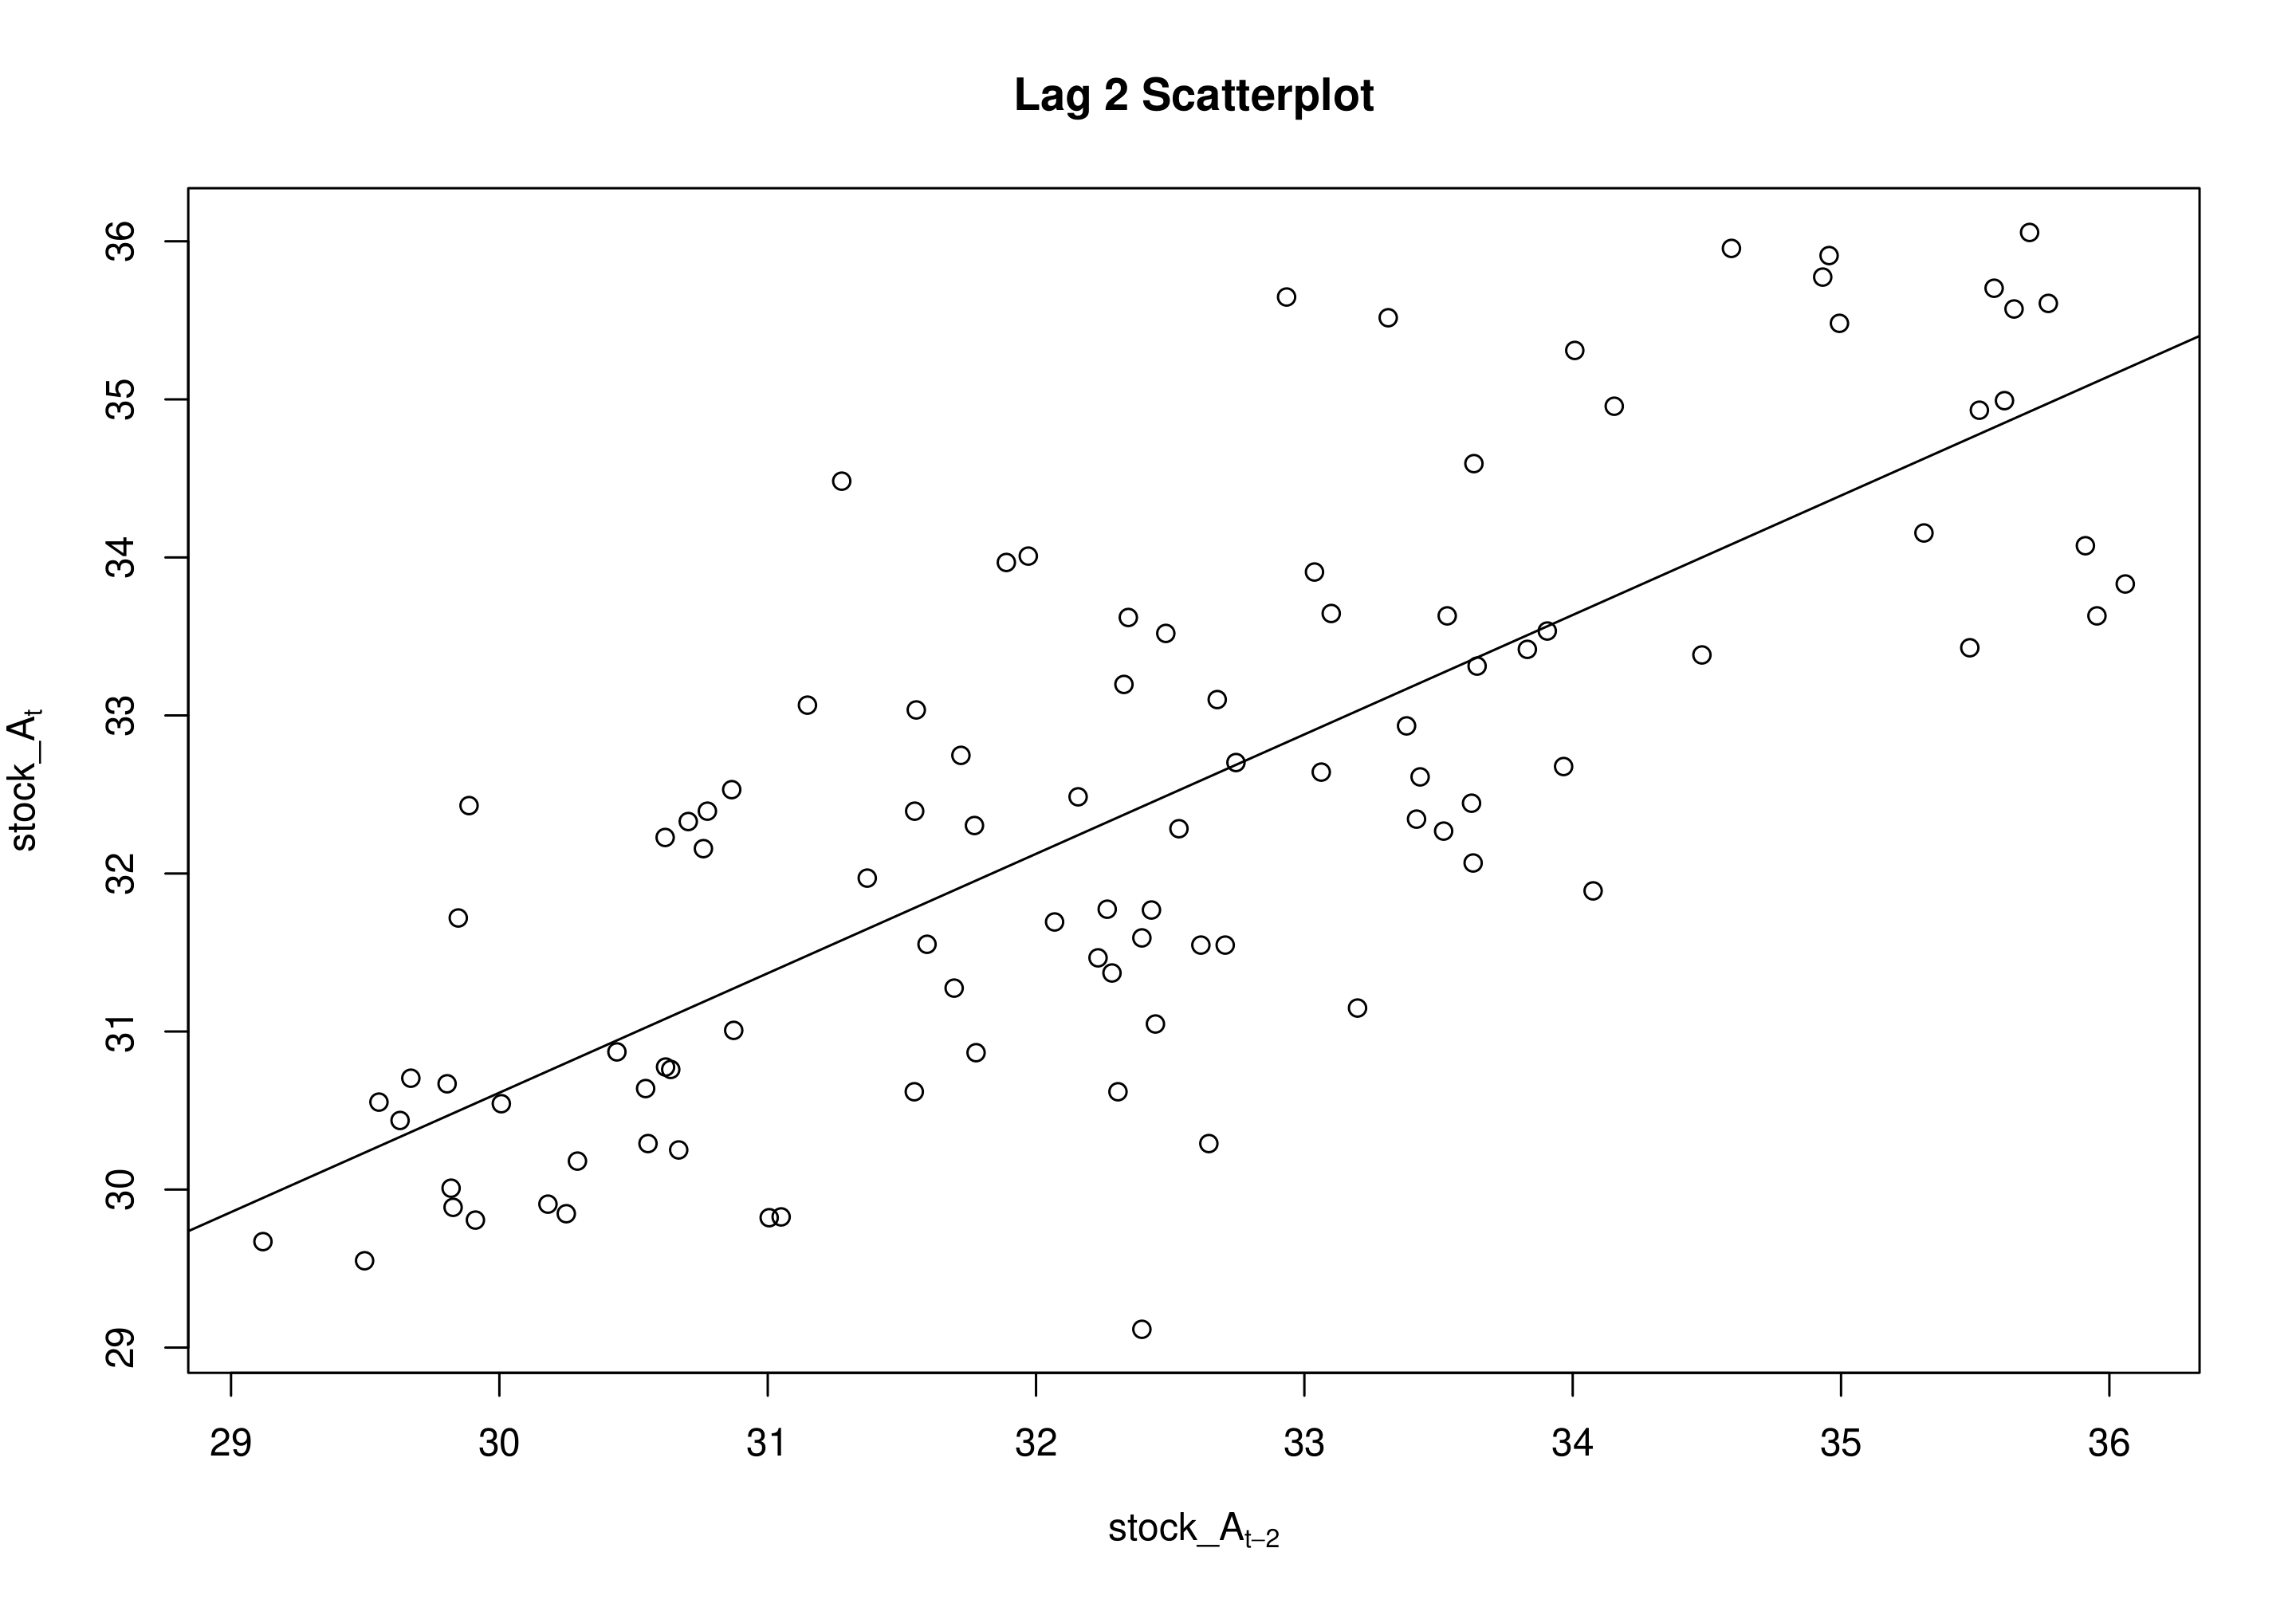
# Autokorrelation mit Lag 2:
# Korrelation von Aktie A „heute" und Aktie A „vor zwei Tagen"
cor(stock_A[-(99:100)],stock_A[-(1:2)])
0.76
Zeitreihenanalyse in R

Autokorrelationen bei Lag 1 und 2 – I

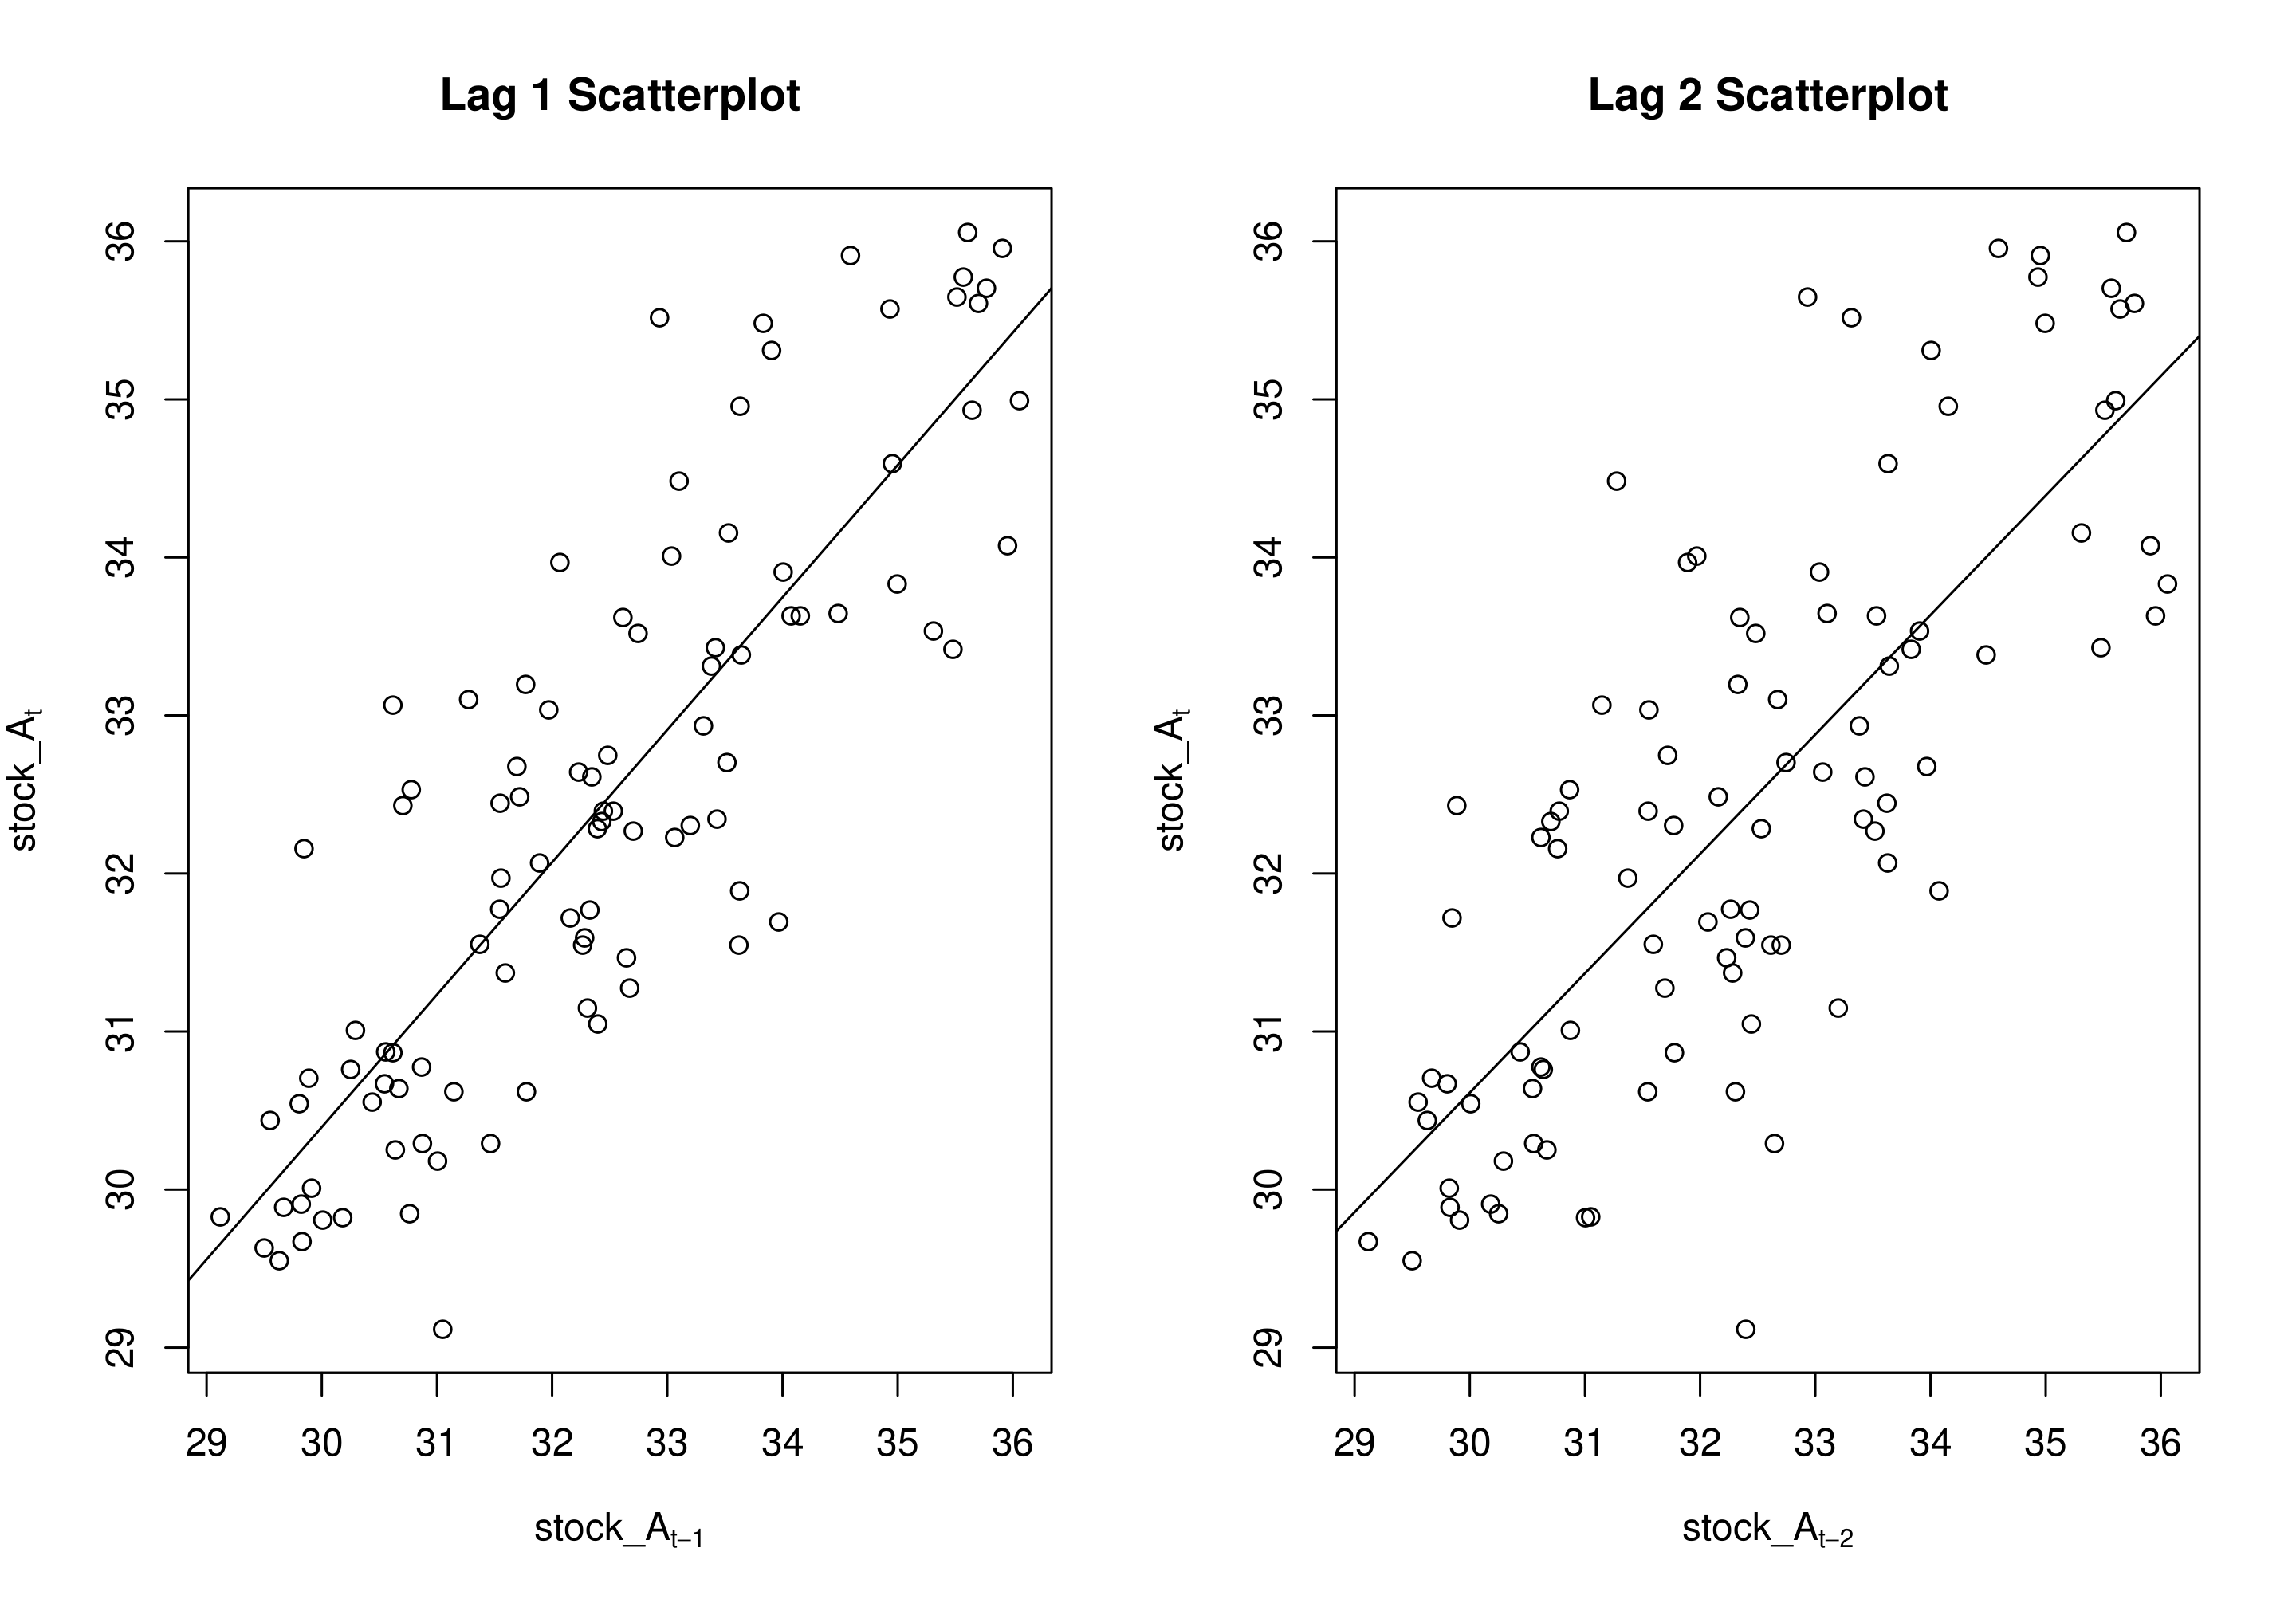
cor(stock_A[-100],stock_A[-1])
0.84
cor(stock_A[-(99:100)],stock_A[-(1:2)])
0.76
acf(stock_A, lag.max = 2, plot = FALSE)
Autokorrelationen der Serie ‚stock_A' nach Lag
  1    2
0.84  0.76
Zeitreihenanalyse in R

Autokorrelationen bei Lag 1 und 2 – II
Zeitreihenanalyse in R

Die Autokorrelationsfunktion – I

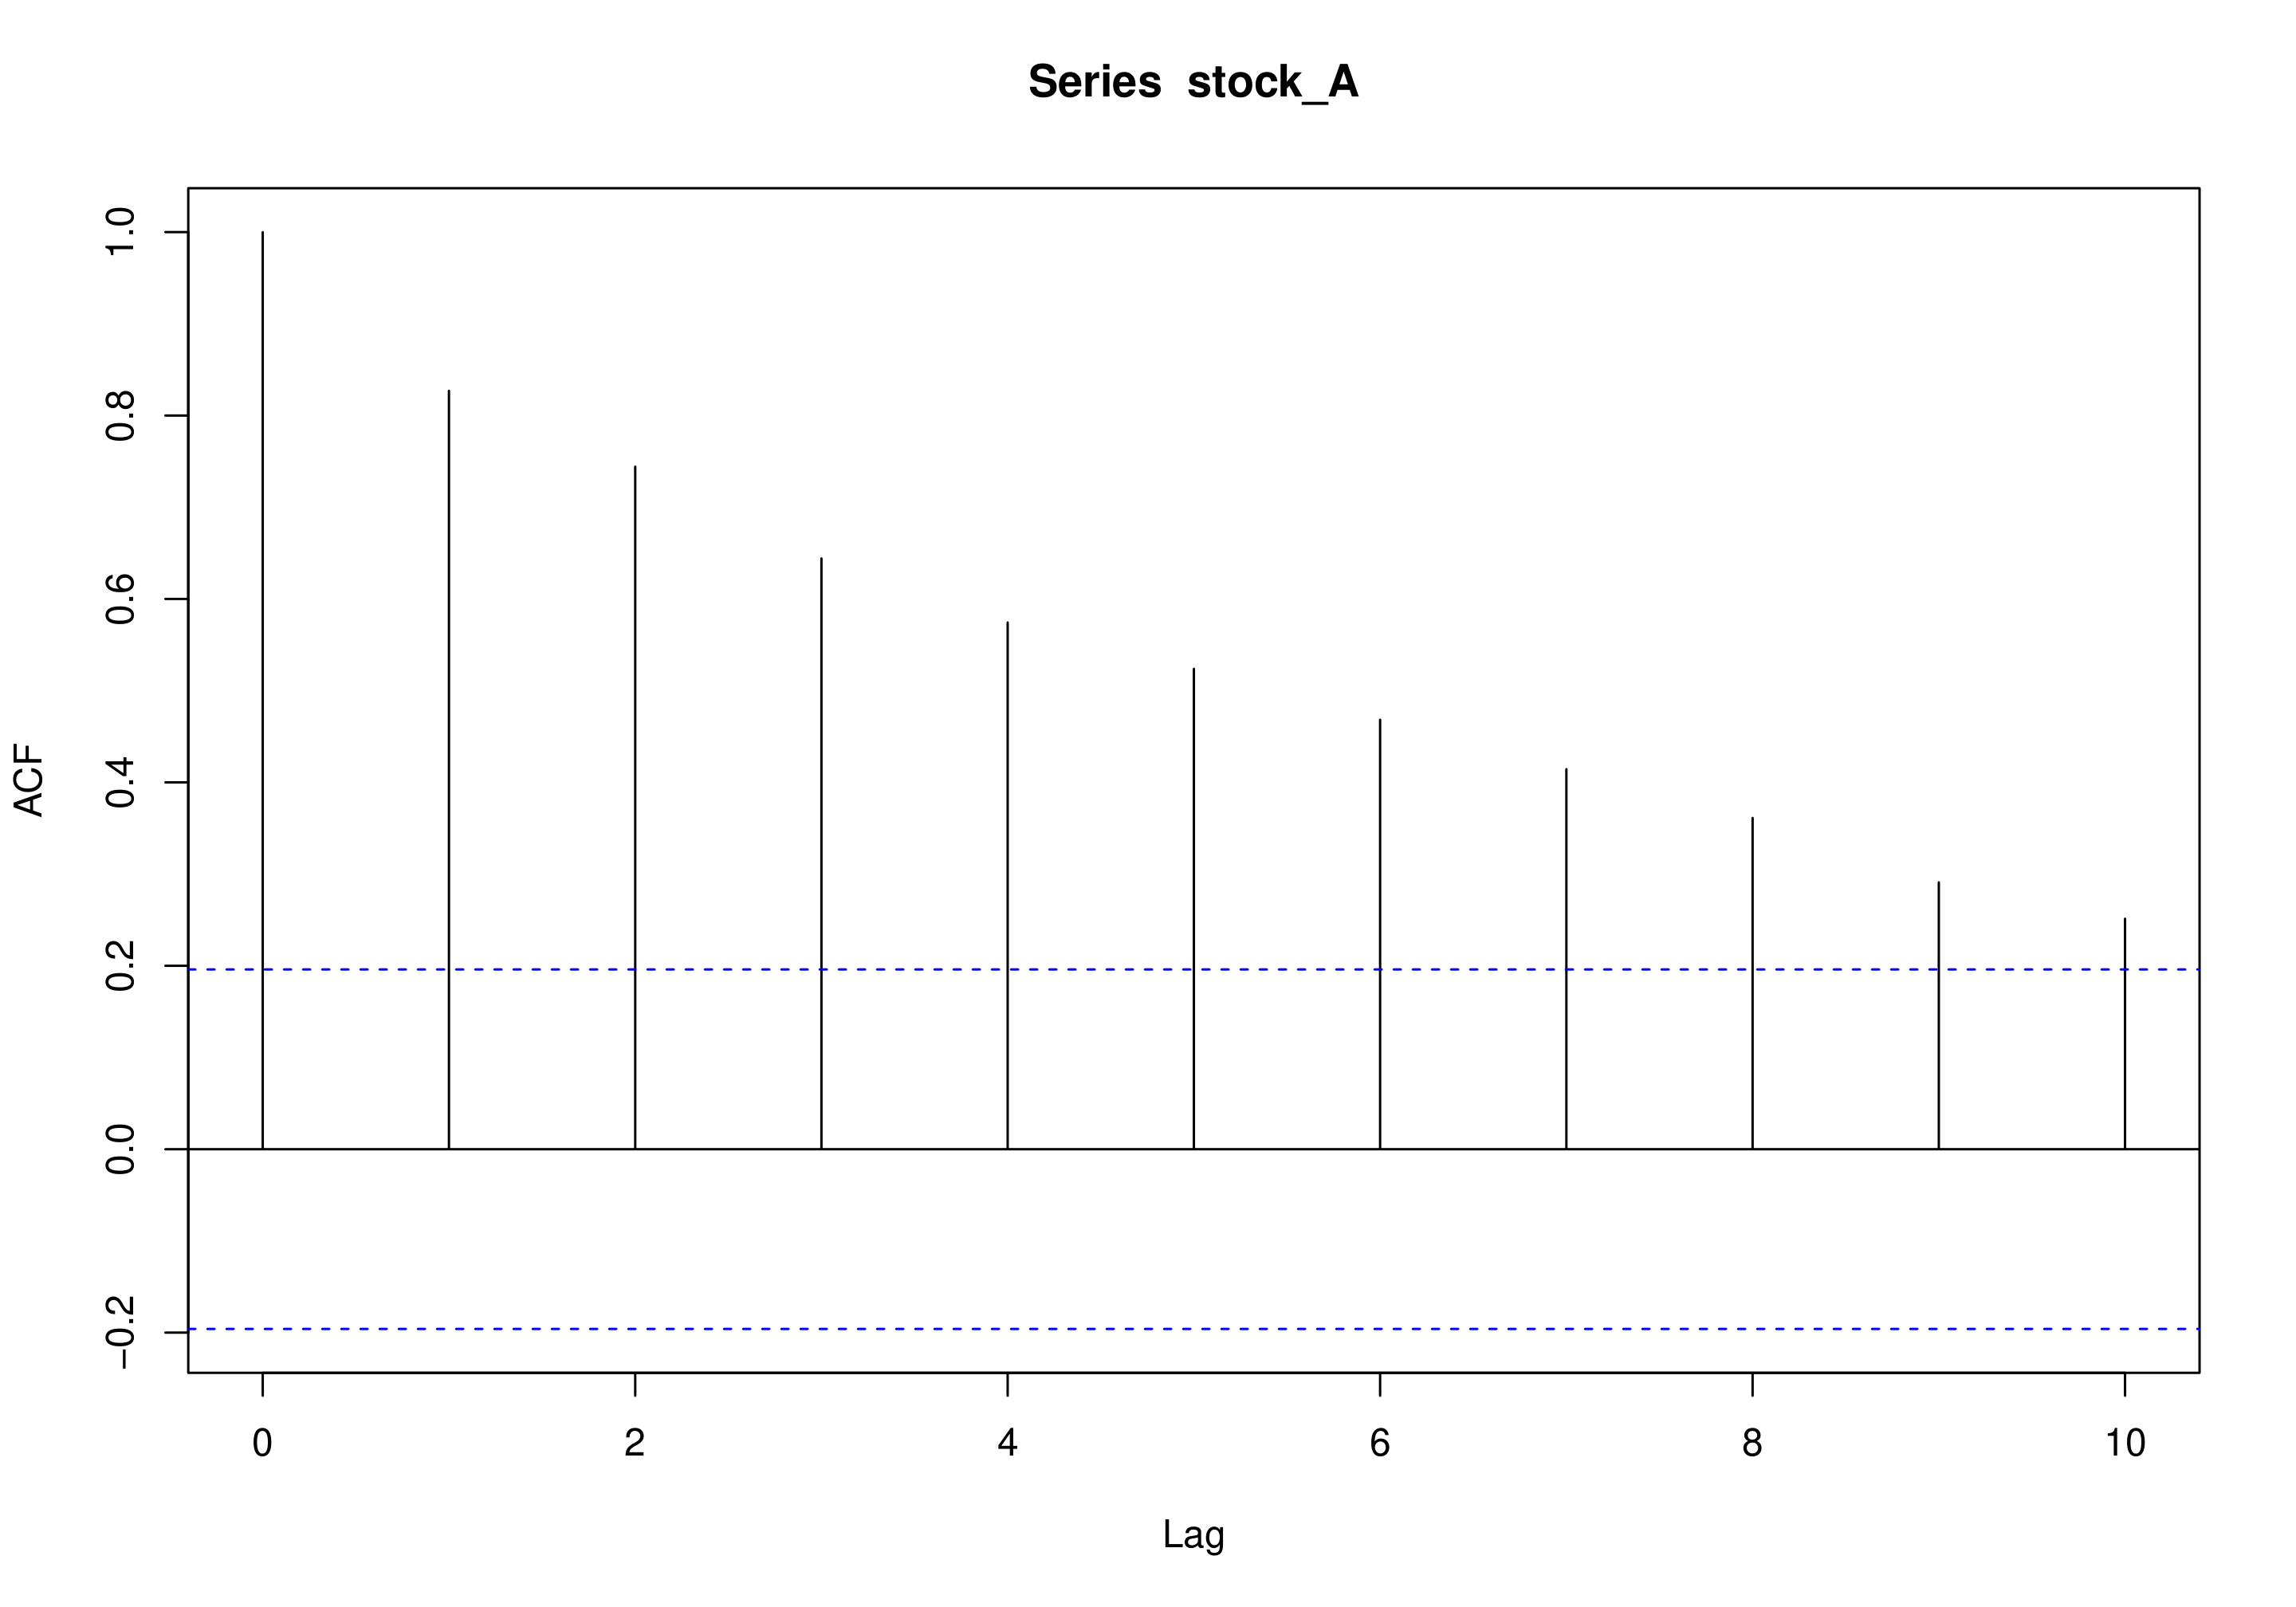
# Autokorrelation nach Lag: „Autokorrelationsfunktion" 
(ACF)acf(stock_A, plot = FALSE)
Autokorrelationen der Serie ‚stock_A' nach Lag
  1    2    3    4    5    6    7    8    9   10
0.84 0.76 0.64 0.57 0.52 0.46 0.41 0.36 0.29 0.25
Zeitreihenanalyse in R

Die Autokorrelationsfunktion – II

acf(stock_A, plot = TRUE)
Zeitreihenanalyse in R

Lass uns üben!

Zeitreihenanalyse in R

Preparing Video For Download...