MA-Modell: Schätzung und Prognose

Zeitreihenanalyse in R

David S. Matteson

Associate Professor at Cornell University

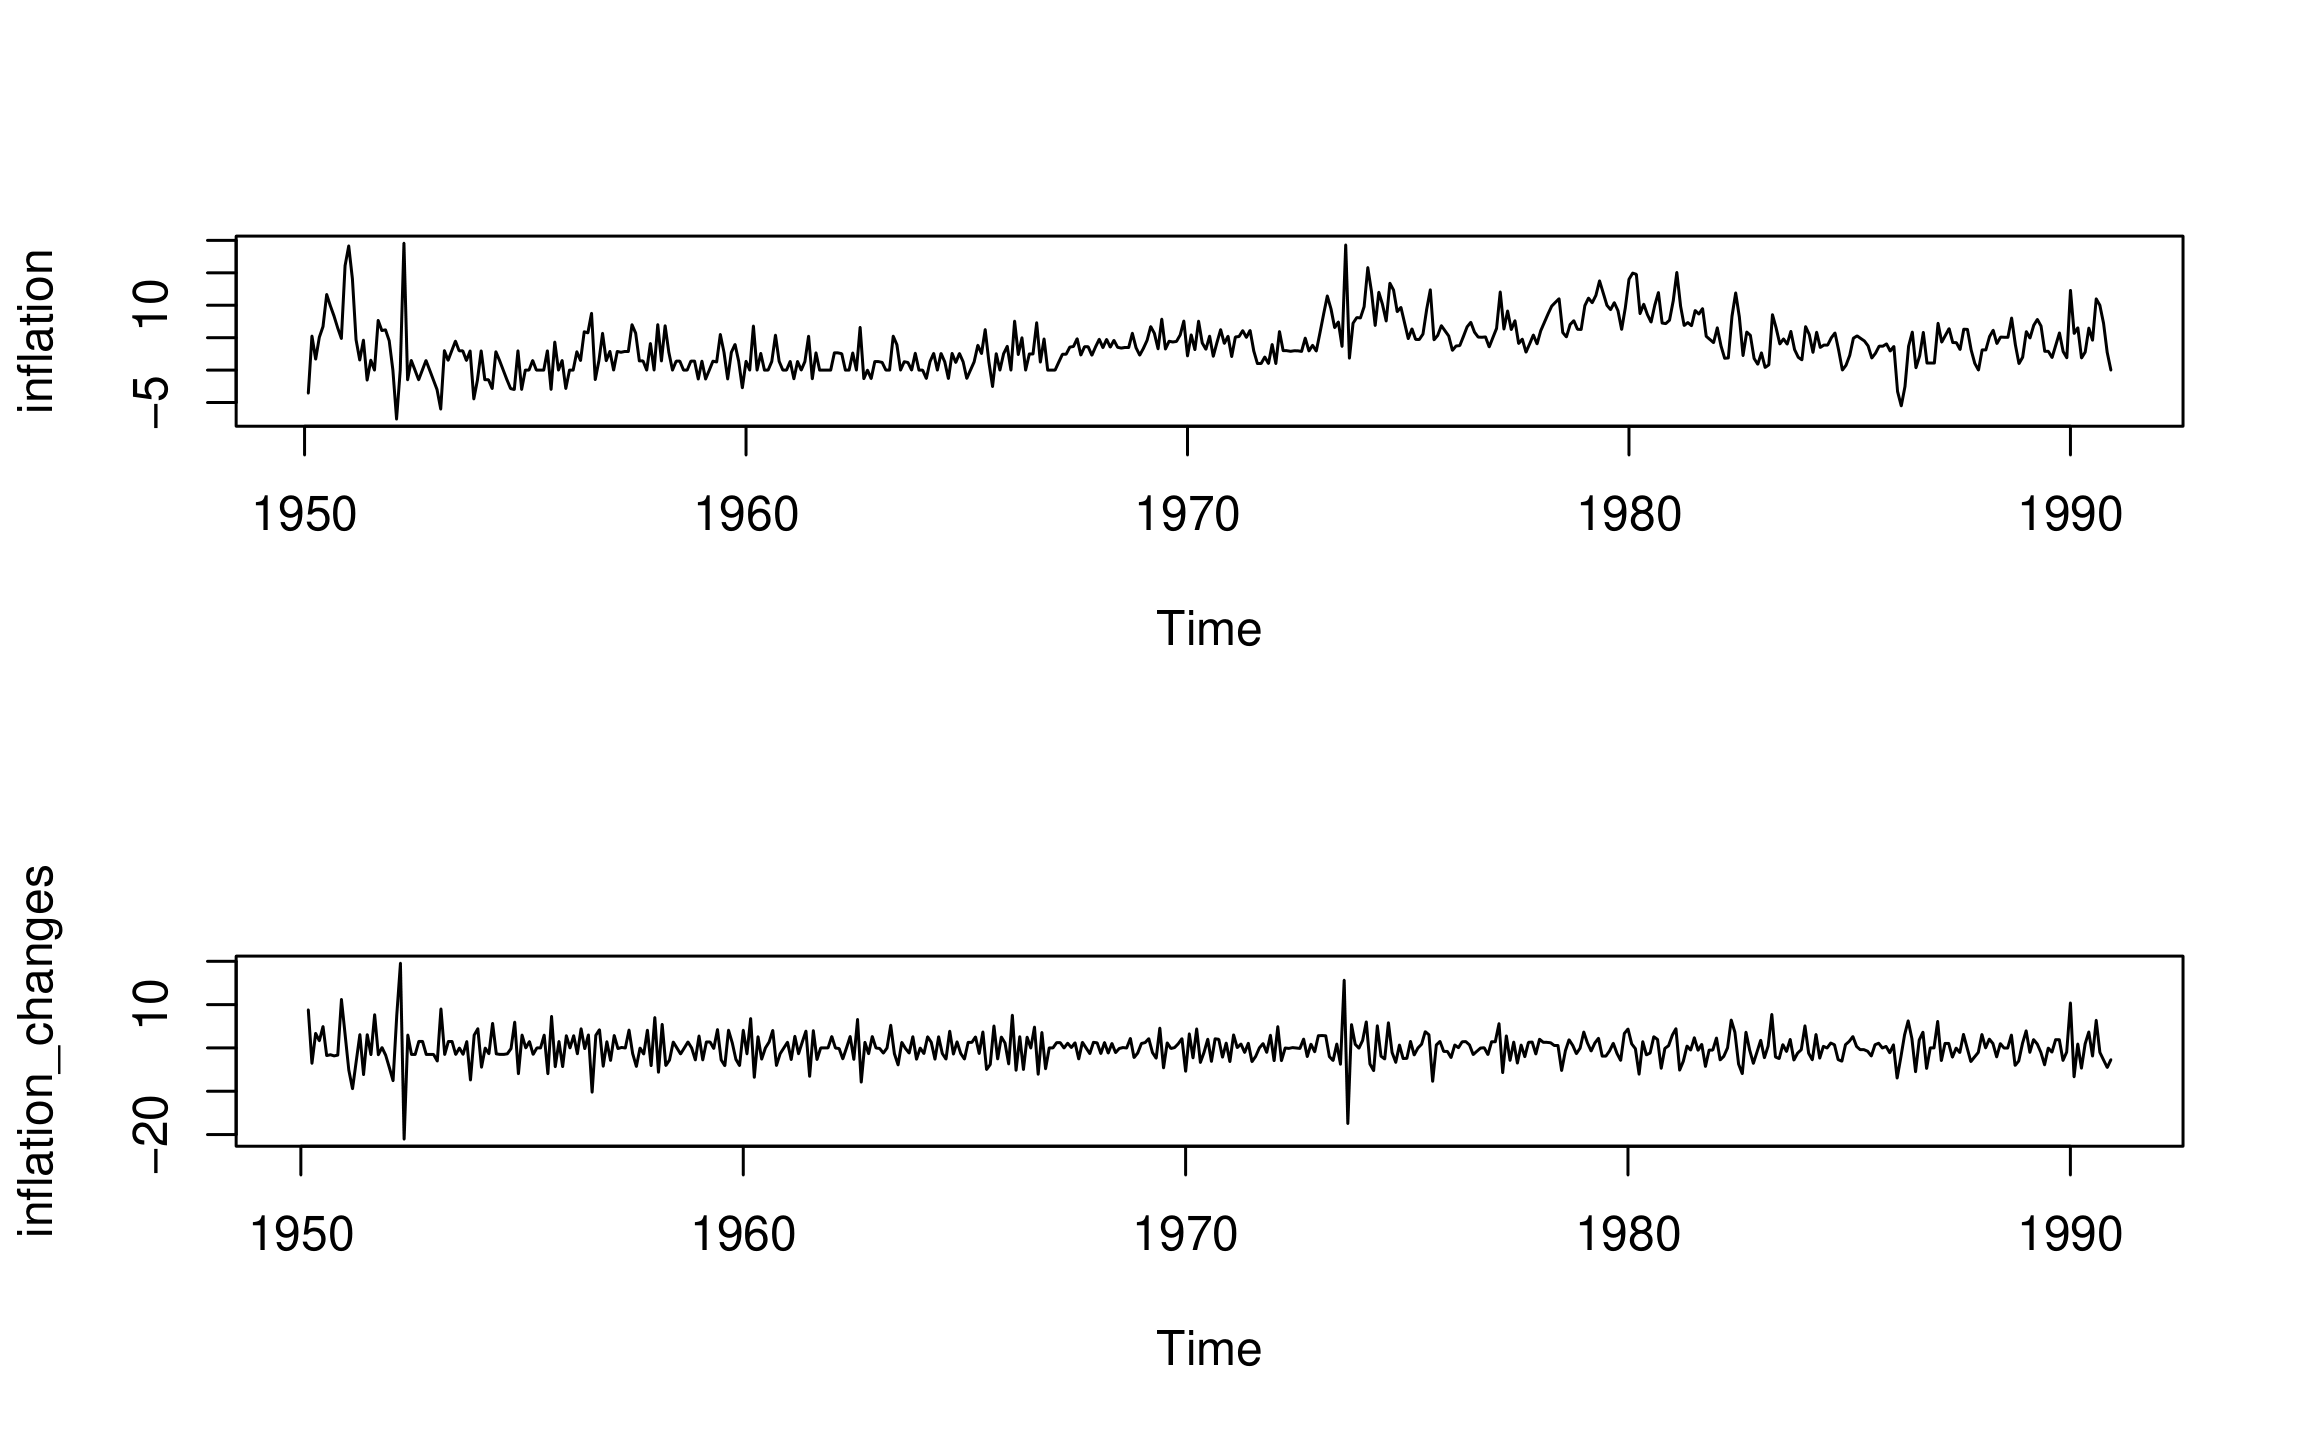
  • US-Inflationsrate pro Monat (in %, annualisiert)
  • Monatliche Daten 1950–1990
data(Mishkin, package = "Ecdat")
inflation <- as.ts(Mishkin[, 1])

inflation_changes <- diff(inflation)
ts.plot(inflation) ; ts.plot(inflation_changes)
Zeitreihenanalyse in R

MA-Prozesse: Änderungen der Inflationsrate – II

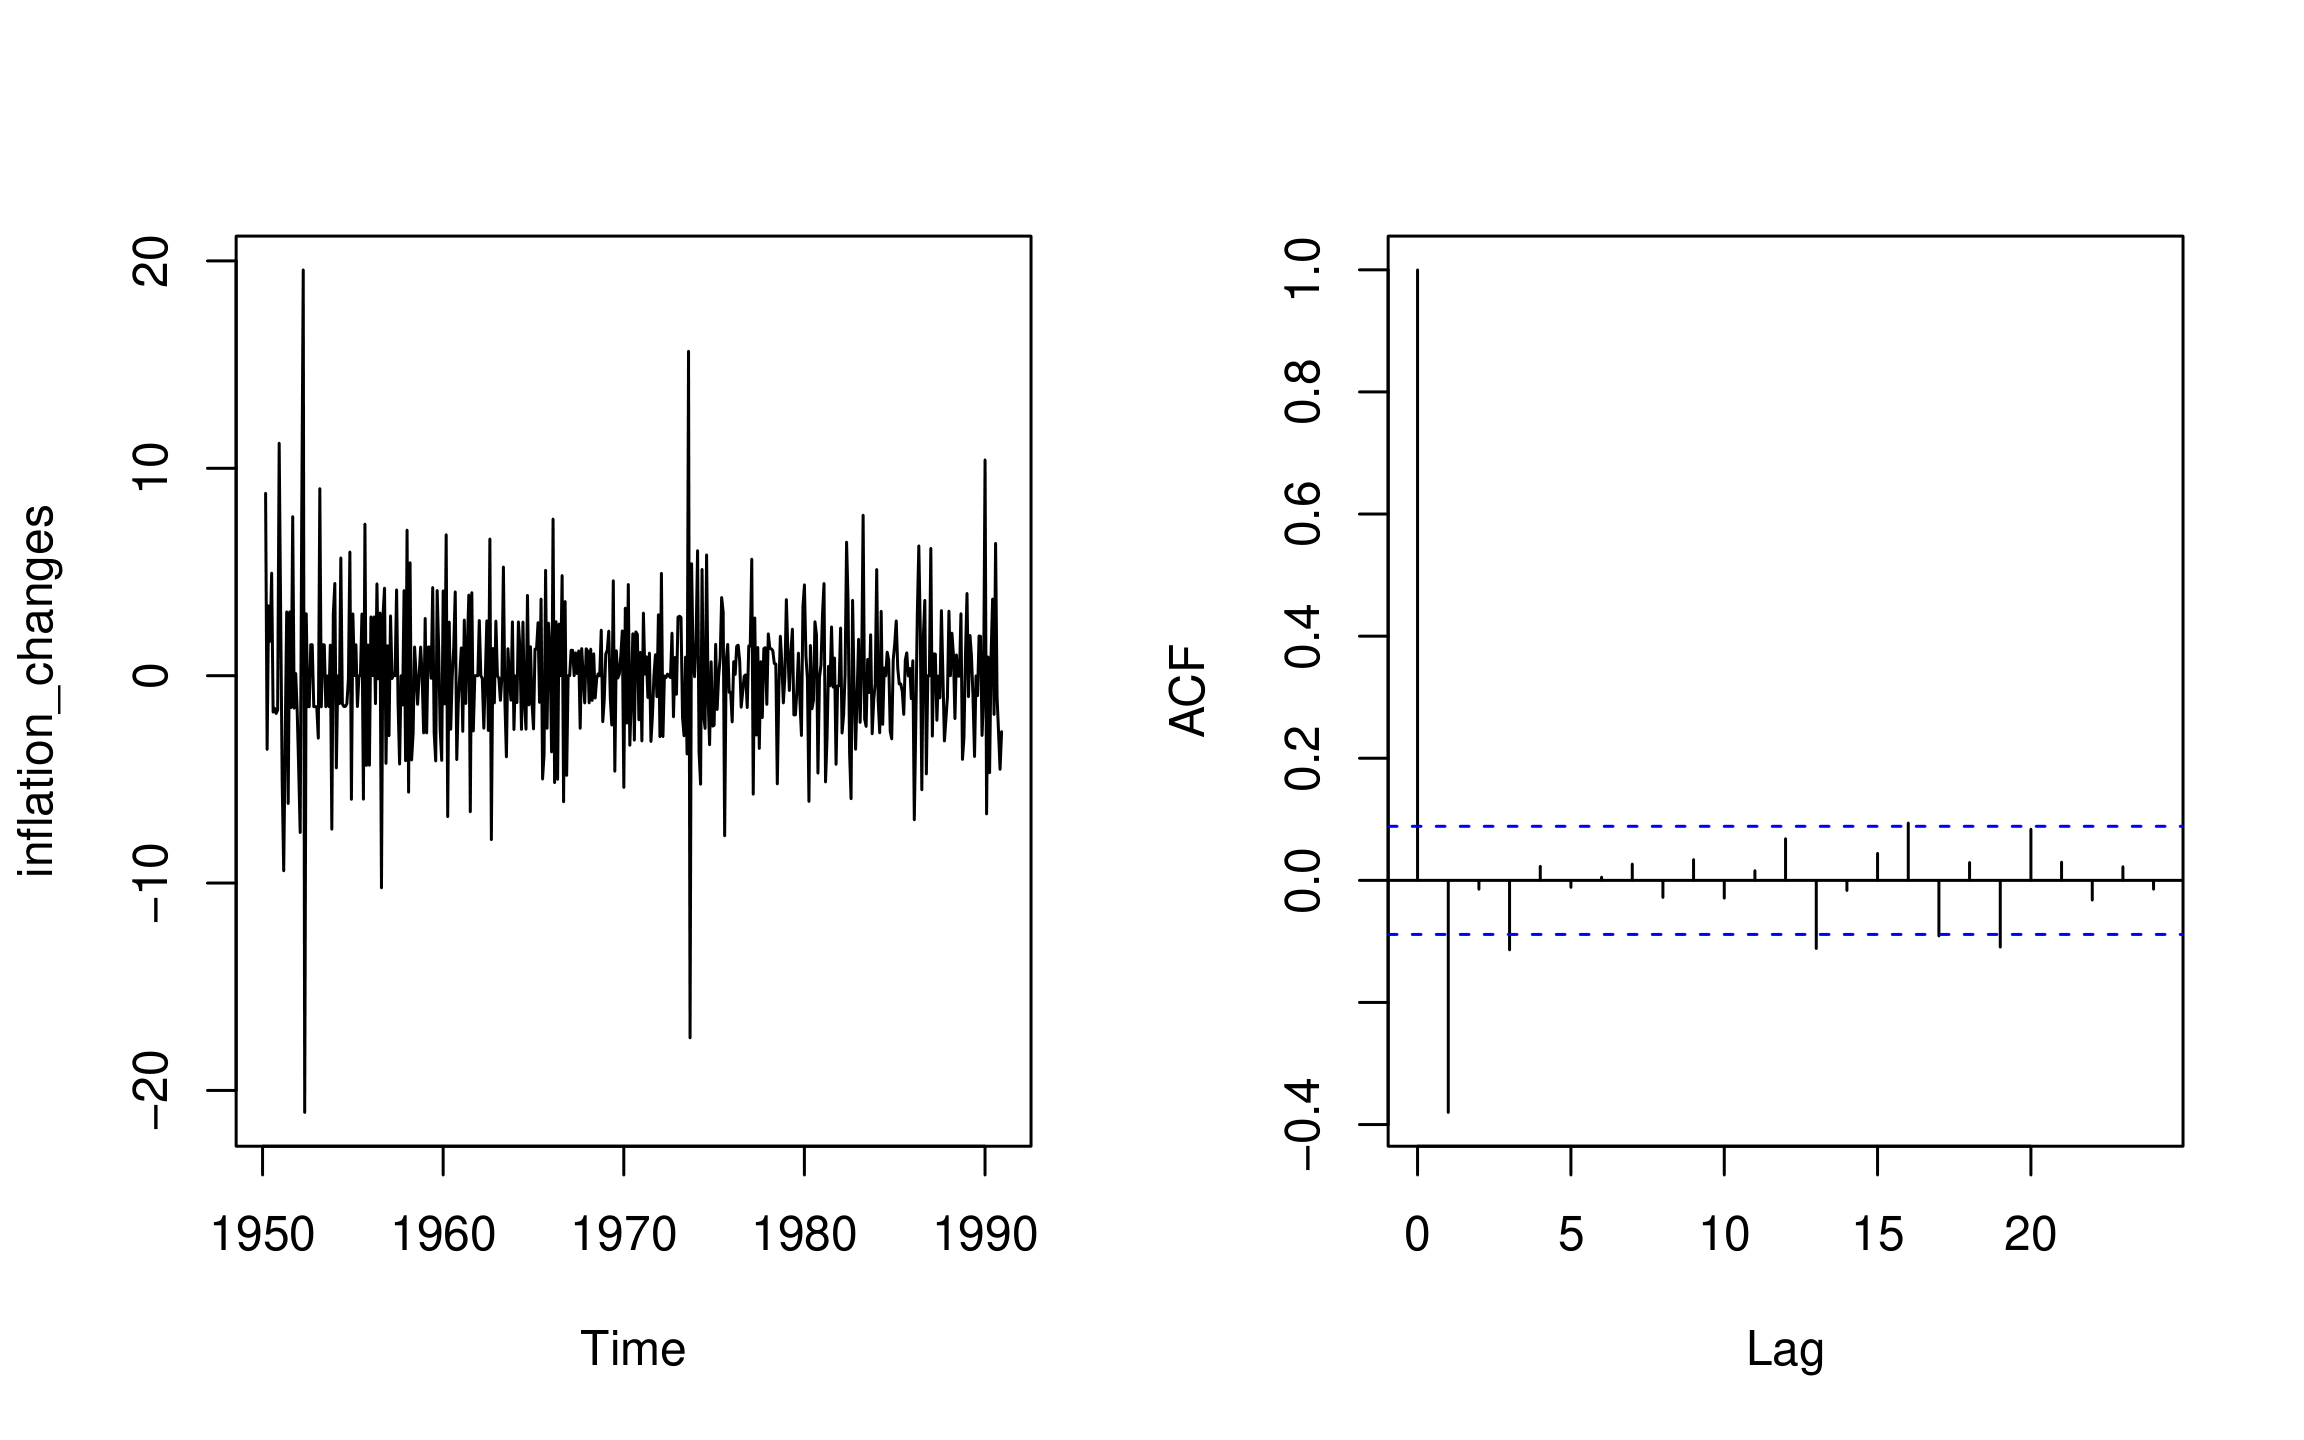
  • Inflation_changes: Änderungen der monatlichen US-Inflationsrate
  • Serie und ACF der Stichprobe plotten:
ts.plot(inflation_changes)
acf(inflation_changes, lag.max = 24)
Zeitreihenanalyse in R

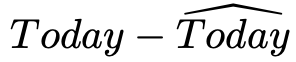
$Heute = Mittelwert + Rauschen + Steigung * (Gesterns Rauschen)$ $$Y_t = \mu + \epsilon_t + \theta\epsilon_{t-1}$$ $$\epsilon_t ~ WhiteNoise(0, \sigma_{\epsilon}^2)$$

MA_inflation_changes <- arima(inflation_changes, 
                              order = c(0, 0, 1))

print(MA_inflation_changes)
Coefficients:
         ma1  intercept
      -0.7932    0.0010
s.e.   0.0355    0.0281
sigma^2 estimated as 8.882

ma1 = $\hat{\theta}$, intercept = $\hat{\mu}$, sigma^2 = $\hat{\sigma^2_{\epsilon}}$

Zeitreihenanalyse in R

MA-Prozesse: Schätzwerte – I

  • MA-Schätzwerte:

$$\hat{Y_t} = \hat{\mu} +\hat{\theta}\hat{\epsilon_{t-1}}$$

  • Residuen =

$$\hat{\epsilon_t} = Y_t - \hat{Y_t}$$

Zeitreihenanalyse in R
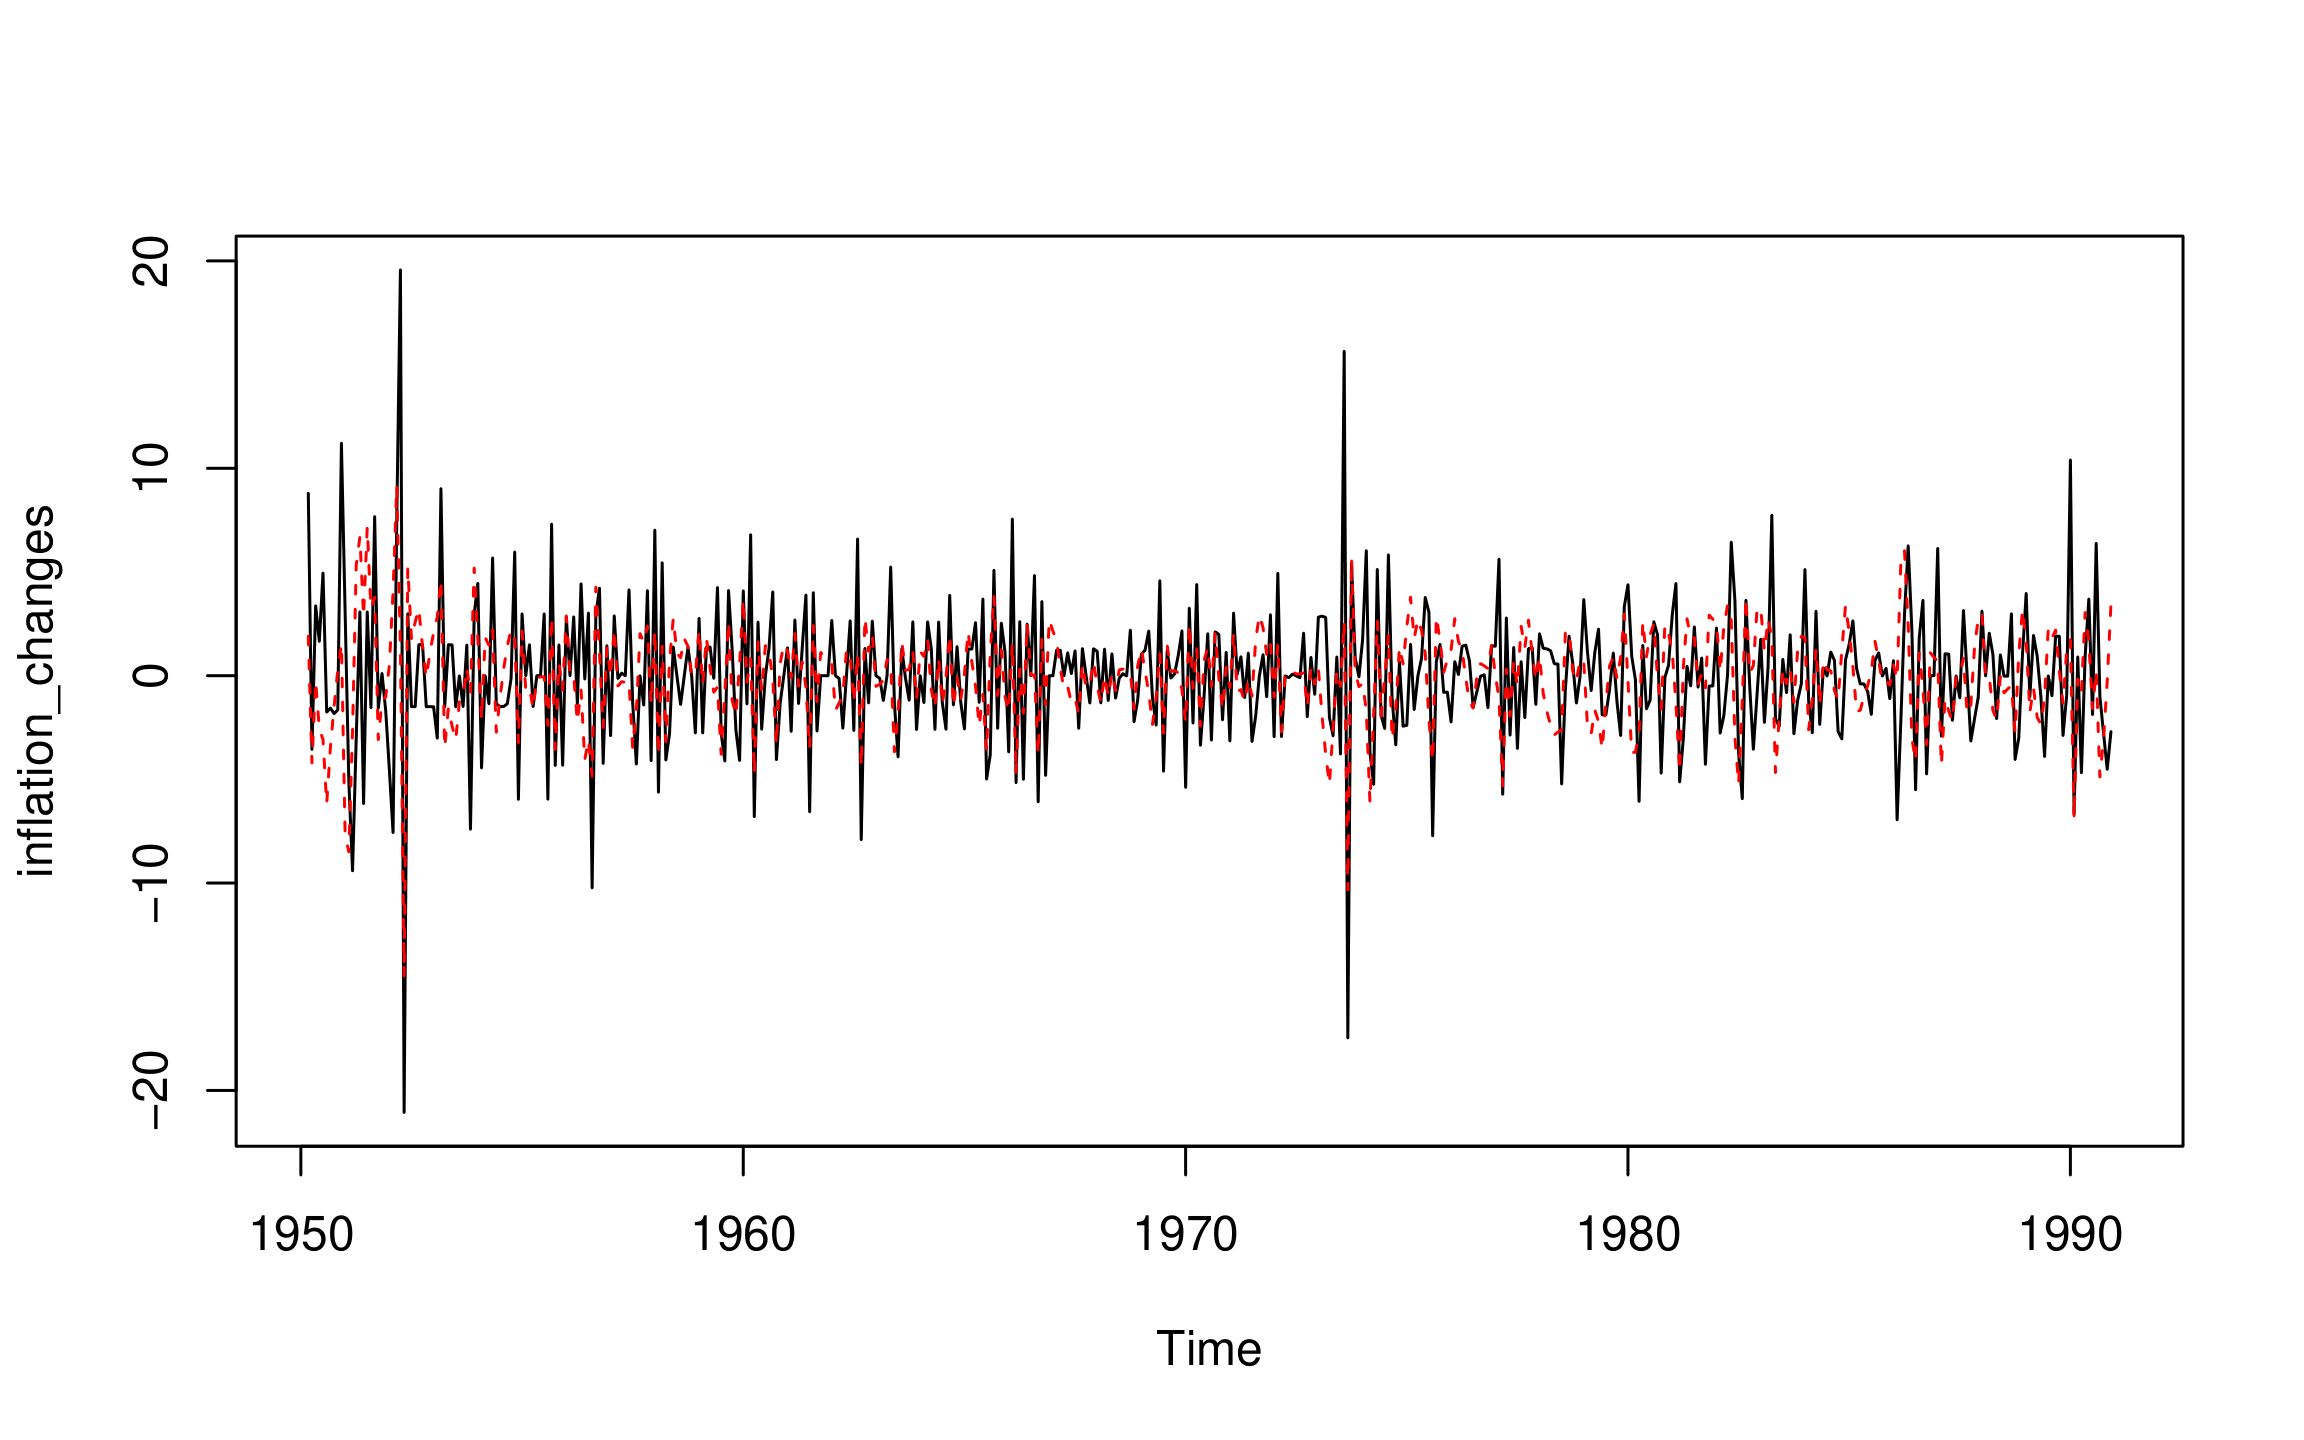
ts.plot(inflation_changes)
MA_inflation_changes_fitted <- 
    inflation_changes - residuals(MA_inflation_changes)

points(MA_inflation_changes_fitted, type = "l", col = "red", lty = 2)
Zeitreihenanalyse in R

Prognose

  • 1-Schritt-Vorhersagen:
predict(MA_inflation_changes)$pred
Jan
1991 4.831632
predict(MA_inflation_changes)$se
Jan
1991 2.980203
Zeitreihenanalyse in R

Prognose (fortgesetzt)

  • h-Schritt-Vorhersagen:
    predict(MA_inflation_changes, n.ahead = 6)$pred
    
           Jan       Feb       Mrz       Apr       Mai       Jun
1991  4.831632  0.001049  0.001049  0.001049  0.001049  0.001049
predict(MA_inflation_changes, n.ahead = 6)$se
           Jan       Feb       Mrz       Apr       Mai       Jun
1991  2.980203  3.803826  3.803826  3.803826  3.803826  3.803826
Zeitreihenanalyse in R

Lass uns üben!

Zeitreihenanalyse in R

Preparing Video For Download...