Optimale Parameter

Statistical Thinking in Python (Teil 2)

Justin Bois

Lecturer at the California Institute of Technology

Histogramm von Michelsons Messungen
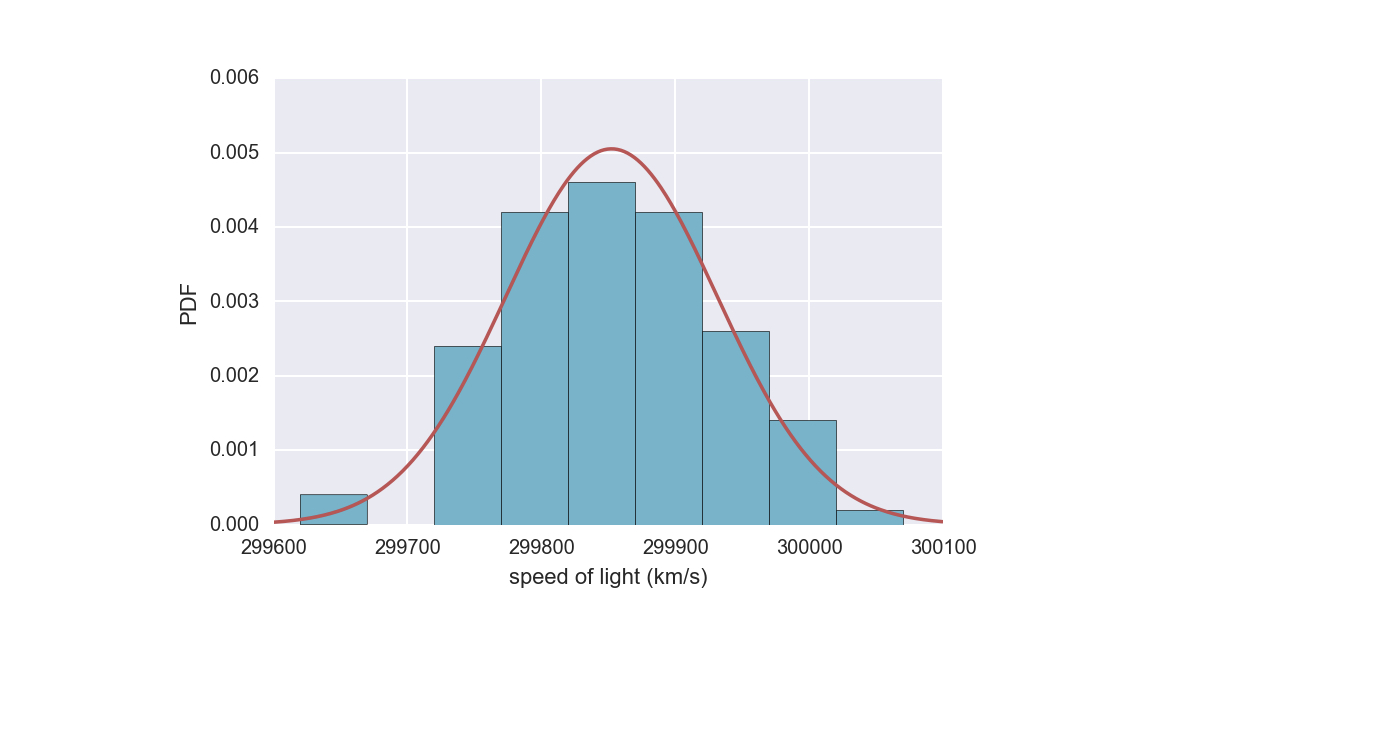
ch1-1.002.png

1 Daten: Michelson, 1880
Statistical Thinking in Python (Teil 2)

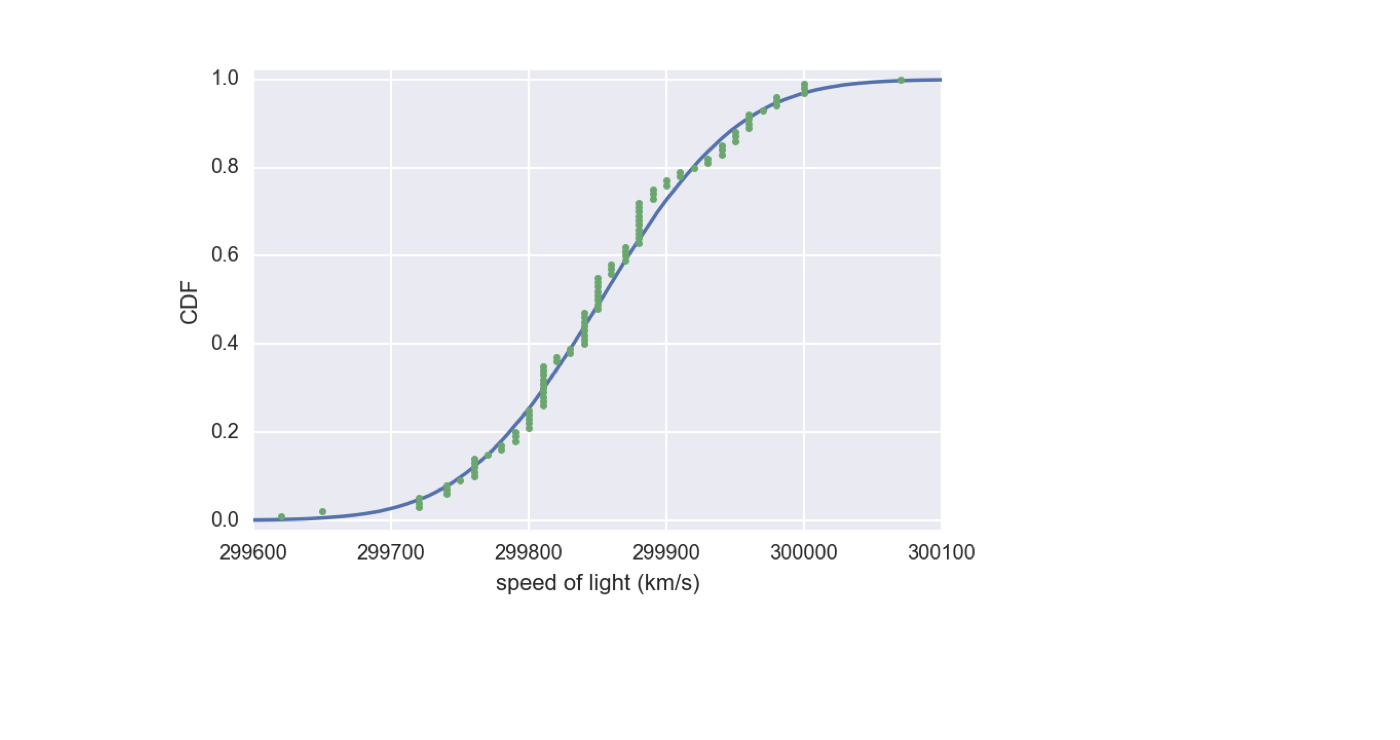
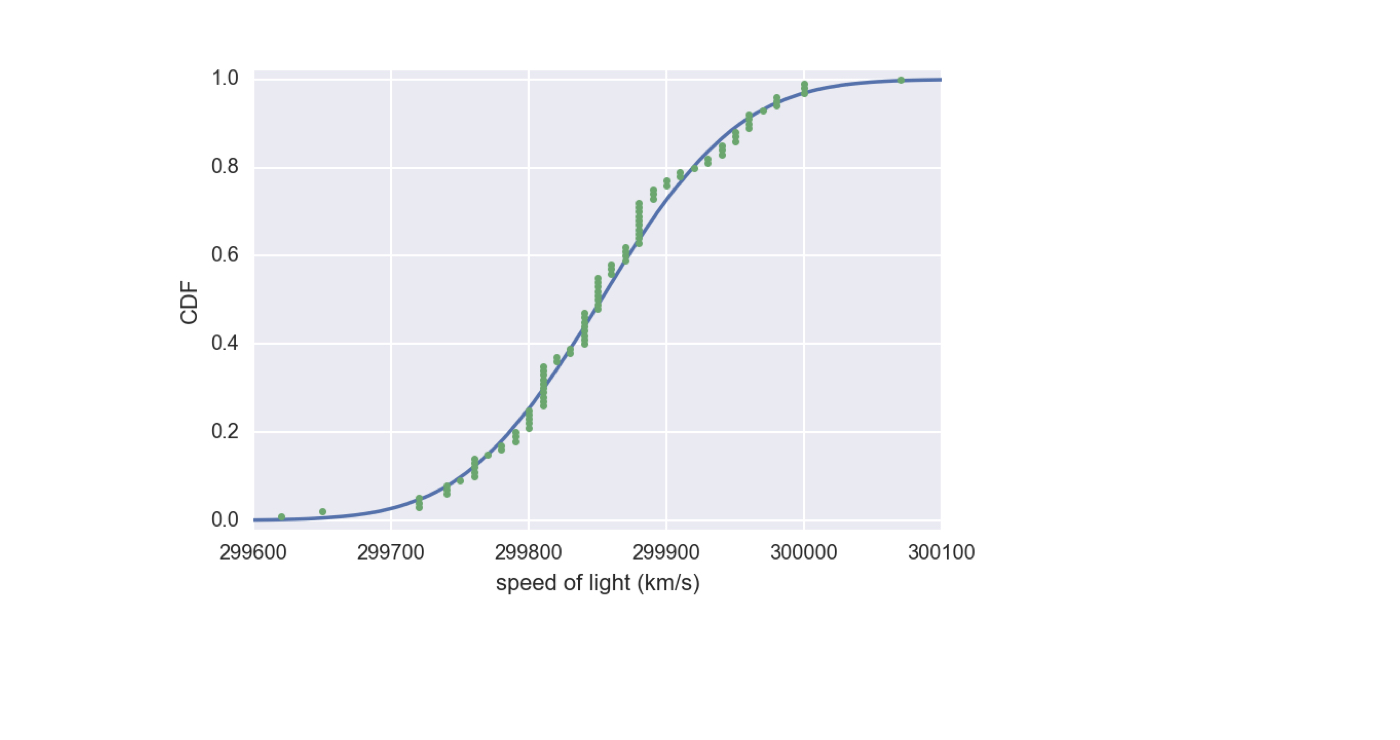
CDF von Michelsons Messungen

ch1-1.004.png

1 Daten: Michelson, 1880
Statistical Thinking in Python (Teil 2)

Normalität der Michelson-Daten prüfen

import numpy as np
import matplotlib.pyplot as plt

mean = np.mean(michelson_speed_of_light) std = np.std(michelson_speed_of_light) samples = np.random.normal(mean, std, size=10000)
Statistical Thinking in Python (Teil 2)

CDF von Michelsons Messungen

ch1-1.010.png

1 Daten: Michelson, 1880
Statistical Thinking in Python (Teil 2)

CDF mit schlechter Schätzung der Std.-Abw.
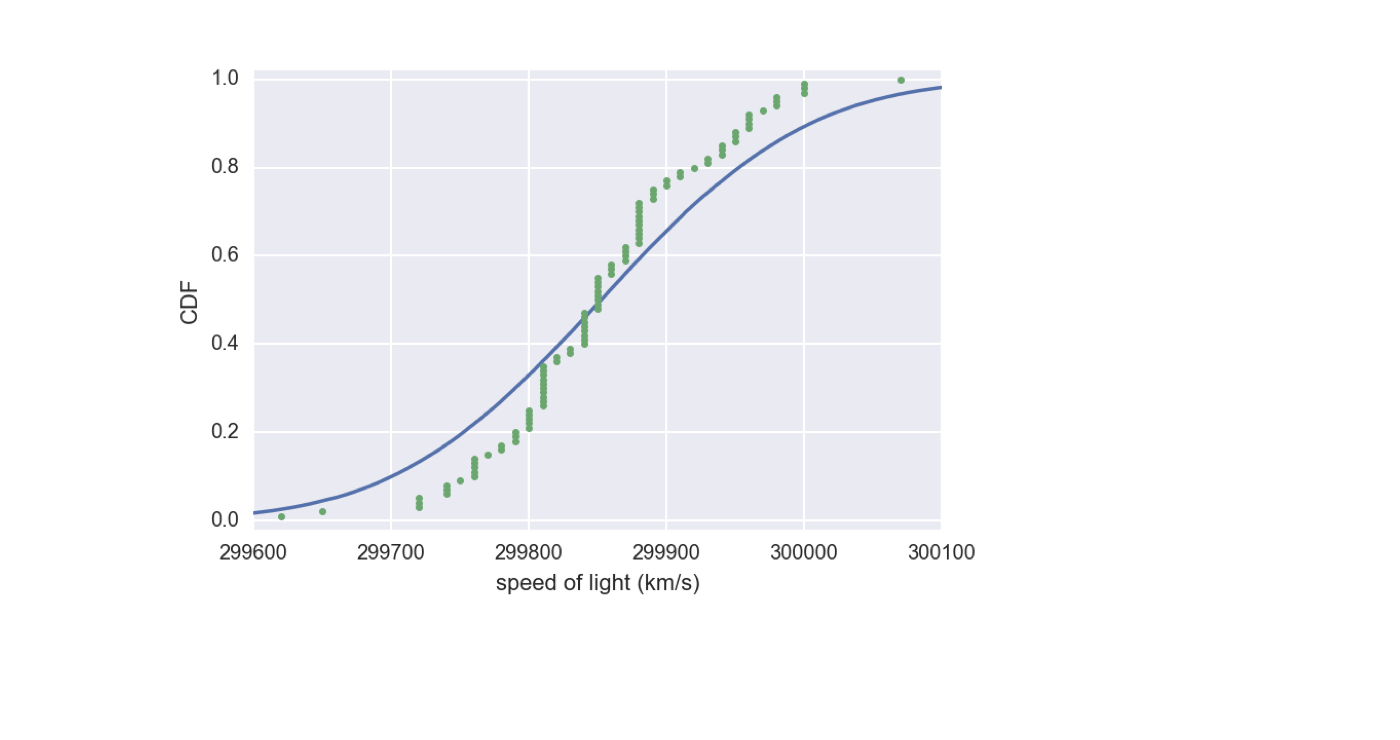
ch1-1.012.png

1 Daten: Michelson, 1880
Statistical Thinking in Python (Teil 2)

CDF mit schlechter Schätzung des Mittels
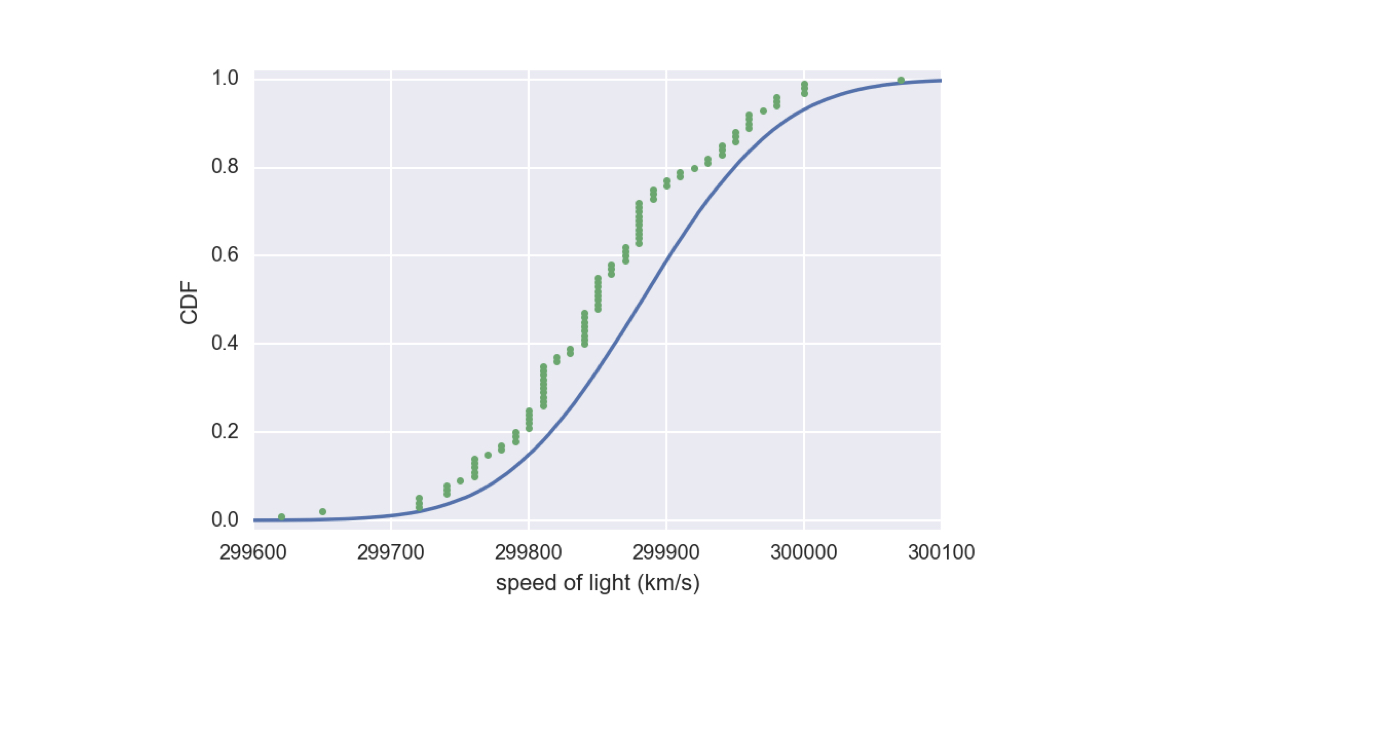
ch1-1.014.png

1 Daten: Michelson, 1880
Statistical Thinking in Python (Teil 2)

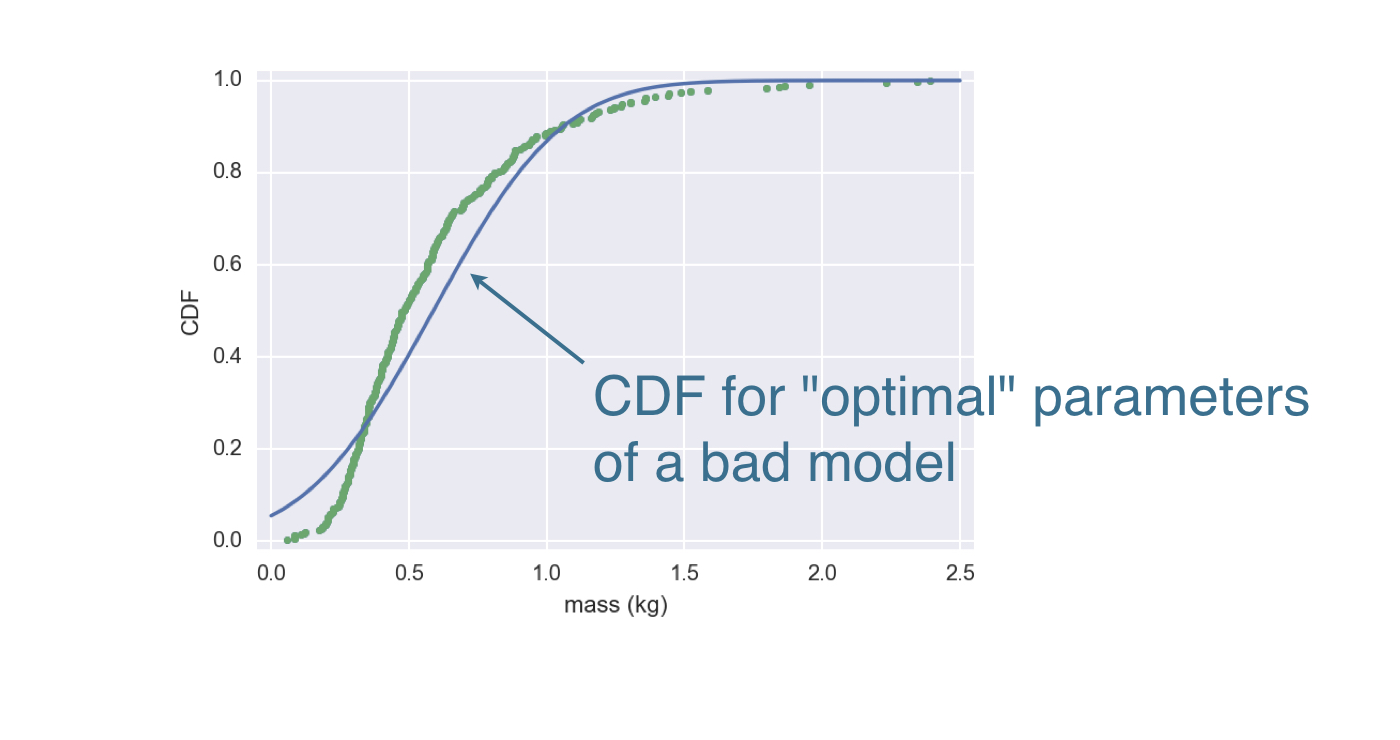
Optimale Parameter

  • Parameterwerte, die Modell und Daten am besten in Einklang bringen
Statistical Thinking in Python (Teil 2)

Masse des Basses mit Großmaul in MA

ch1-1.017.png

1 Quelle: Mass. Dept. of Environmental Protection
Statistical Thinking in Python (Teil 2)

Pakete für statistische Inferenz

ch1-1.020.png

Statistical Thinking in Python (Teil 2)

Pakete für statistische Inferenz

ch1-1.021.png

Statistical Thinking in Python (Teil 2)

Pakete für statistische Inferenz

ch1-1.022.png

1 Messerbild: D-M Commons, CC BY-SA 3.0
Statistical Thinking in Python (Teil 2)

Lass uns üben!

Statistical Thinking in Python (Teil 2)

Preparing Video For Download...